

Abstract
Dopaminergic neurons of the substantia nigra are susceptible to toxin-based insults. Intrastriatal injection of 6-hydroxydopamine results in selective toxicity to these neurons. A mechanistic role for reactive oxygen species is supported by observations that antioxidants confer protection from 6-hydroxydopamine. Although cell culture studies have suggested extracellular or nonmitochondrial mechanisms in 6-hydroxydopamine toxicity, the compartmentalization of oxidative injury mechanisms is incompletely defined in vivo. Transgenic mice overexpressing mitochondrial manganese superoxide dismutase or extracellular superoxide dismutase received unilateral intrastriatal injections of 6-hydroxydopamine. Mice that overexpress manganese superoxide dismutase showed significantly smaller striatal lesions than littermate controls. There were no differences in nonspecific striatal injury associated with contralateral vehicle injection. Manganese superoxide dismutase overexpression also protected against loss of neuronal cell bodies in the substantia nigra. In contrast, mice overexpressing extracellular superoxide dismutase showed no protection from 6-hydroxydopamine toxicity in either brain region. Protection of the nigrostriatal system by overexpression of manganese super-oxide dismutase supports a role for mitochondrially derived superoxide in 6-hydroxydopamine toxicity. Mitochondrial oxidative stress appears to be a common mechanism among diverse models of Parkinson disease, whether involving toxins, mutated genes, or cybrid cells containing patient mitochondria. Antioxidant therapies that target this subcellular compartment may prove promising.
Reactive oxygen species (ROS) have been hypothesized to play a mechanistic role in central nervous system diseases including stroke, seizures, and neurodegeneration. However, administration of a given antioxidant may show beneficial, indifferent, or harmful effects in different model systems. For example, superoxide dismutase (SOD) isoforms can exacerbate brain injuries mediated by nitric oxide or hydrogen peroxide (1, 2) while protecting against other brain injuries (3-5). Extracellular inhibition of oxidative reactions may promote toxicity inside cultured cells by allowing higher levels of unaltered toxin to enter the cell (6). Likewise, individual metal chelators may stimulate, inhibit, or show no effect on catecholamine autoxidation, whereas the combination of SOD and chelators is generally inhibitory (7). Given the growing recognition of ROS as mediators of cellular communication (8, 9), understanding the compartments or sites of ROS generation that contribute to injury will facilitate appropriate targeting of antioxidant therapies.
Parkinson disease is a common neurodegenerative disease characterized by disabling movement abnormalities. Although it is known that injury to substantia nigra pars compacta (SNc) neurons of the nigrostriatal projection leads to parkinsonian symptoms, the mechanisms contributing to dysfunction and death of these dopaminergic neurons are incompletely understood (10). The nigrostriatal system is particularly susceptible to toxin-based insults (11, 12). Although selective uptake of toxic metabolites may account in part for this sensitivity (13, 14), recent discoveries that systemic mitochondrial complex I inhibition also causes selective nigrostriatal toxicity implicate the intrinsic vulnerability of this system to toxic insults (15). Because the mechanisms of parkinsonian neurodegeneration are likely to involve multifactorial interactions (16, 17), a better understanding of common pathways of SNc injury and death mechanisms will facilitate development of new treatments.
The dopamine analog 6-hydroxydopamine (6-OHDA) is a neurotoxin that injures catecholaminergic neurons of the central and peripheral nervous systems. Intrastriatal injection of 6-OHDA induces selective damage to dopaminergic termini in the striatum followed by progressive degeneration of the dopaminergic cell bodies in the ipsilateral SNc in rats (18-20) and mice (21). Loss of midbrain tyrosine hydroxylase (TH)/ dopamine transporter-expressing neurons is highly concordant with loss of SNc neurons as assessed by phenotype-independent measures (Nissl stain, fluorogold labeling, or nuclear counts), indicating that reversible suppression of TH expression is not a major factor in the rat intrastriatal injection model (18-20, 22). A mechanistic role for ROS is supported by observations that anti-oxidants confer protection from 6-OHDA toxicity in vivo (23-29) and in vitro (30-34).
Traditionally, 6-OHDA-induced neurotoxicity has been attributed to direct production of ROS during oxidation of this compound at neutral pH (35). Certainly, the abilities of glutathione, N-acetylcysteine, or metal chelators to protect against 6-OHDA toxicity support involvement of ROS. However, it is not always clear whether the antioxidant compound acts directly on 6-OHDA by affecting autoxidation rates (36, 37) or if 6-OHDA initiates alternative cellular mechanisms of ROS generation which can be modulated by antioxidant treatment. The mitochondrion is a major source of intracellular ROS. Although 6-OHDA can affect activity of isolated mitochondrial complexes (38), cell culture experiments show conflicting results concerning the potential role of mitochondria in 6-OHDA injury (39-41). Moreover, it has been postulated that 6-OHDA induces neuron death primarily through activation of endoplasmic reticulum stress responses (42, 43). 6-OHDA injury can also be initiated by extracellular mechanisms (36), even in systems showing high rates of dopamine transporter activities (40, 44). One such mechanism may involve modulation of amino acid and catecholamine uptake without the need for 6-OHDA internalization (45).
Compartmentalization of oxidant stresses is often difficult to study because many antioxidant compounds cross between sub-cellular compartments, and ROS detection systems can be limited by the propensity for promoting generation of the free radical to be measured (46). There are three major human SOD family members that differ in their subcellular localization: the cytosolic and nuclear copper/zinc SOD (CuZn-SOD), the mitochondrial manganese SOD (Mn-SOD), and a multimeric, extracellular copper/zinc isoform (EC-SOD) (47). Transgenic (Tg) mice overex-pressing Mn-SOD and EC-SOD were utilized to investigate the potential roles of mitochondrial and extracellular superoxide in 6-OHDA toxicity in vivo. This study demonstrates that intrastriatal 6-OHDA causes both terminal injury and neuronal cell loss in the substantia nigra of mice. Moreover, mice overexpressing mitochondrial Mn-SOD were significantly protected from nigrostriatal injury to both the substantia nigra neurons and their termini. Taken together with work in other parkinsonian models, these studies indicate that mitochondrial oxidative stress contributes to a final common pathway of injury in SNc neurons in response to diverse stimuli.
EXPERIMENTAL PROCEDURES
Animals and Treatment
All procedures were conducted in accordance with NIH guidelines for live animal experiments and approved by the University of Pittsburgh Institutional Animal Care and Use Committee. Hemizygous Tg mice overexpressing either Mn-SOD or ECSOD, driven by the β-actin promoter, were used along with their respective nontransgenic (non-Tg) wild-type littermate controls. The construction of the Mn-SOD Tg mice (48) and the EC-SOD Tg mice (1) in the (C57BL/6 × C3H) F1 (B6C3 F1) background have been described previously. Mn-SOD breeders were the gift of Dr. Ye-Shih Ho, Wayne State University, Detroit, MI, and breeding colonies of both lines are maintained at the University of Pittsburgh. EC-SOD Tg mice were genotyped by PCR amplification of the human EC-SOD transgene as described previously (49). Mn-SOD Tg mice were genotyped using primers to the human Mn-SOD transgene (forward, 5′-CCAGTGTTTGCCTTTTATGG-3′; reverse, 5′-TCGTAGGGCAGGTCGGGGAG-3′).
6-OHDA hydrobromide (Sigma) was prepared fresh on the day of use in 0.9% NaCl and 0.05%l-ascorbic acid and stored on ice in the dark. Male mice (10–12 weeks old, 25–30 g) were anesthetized with Nembutal (sodium pentobarbital). 6-OHDA (2.5 μg free base) was pump infused into the right striatum, and an equivalent volume of vehicle (1 μl) was pump infused into the left striatum through a 30-gauge steel cannula at a rate of 12 μl/h, using a Kopf stereotaxic instrument set at the following coordinates: AP, +0.8 mm; ML, +1.9 mm (6-OHDA), −1.9 mm (vehicle); DV −3.4 mm from bregma. The cannula was withdrawn slowly 3 min after the end of the infusion.
Tissue Preparation and Immunohistochemistry
Mice were deeply anesthetized using a lethal dose of Nembutal (150 mg/kg intraperitoneally) 3 weeks after stereotaxic injections and transcardially perfused with ice-cold 0.9% NaCl, pH 7.4, followed by 10% buffered formalin (Fisher). The brains were removed and postfixed for 12–16 h in 10% buffered formalin at 4 °C and then transferred to 20% sucrose in 0.1 m PBS at 4 °C. For each mouse, serial cryostat-cut coronal sections (30 μm) encompassing the entire striatum were collected sequentially into cryoprotectant solution (0.88 m sucrose, 0.00025 m polyvinylpyrrolidone (PVP-40), 0.05 m PBS, pH 7.4, 4.8 m ethylene glycol). Free floating sections were processed for TH immunohistochemistry after removal of cryoprotectant solution. Sections were pretreated with 1% hydrogen peroxide, washed, and incubated with a rabbit polyclonal antibody (1:500 dilution) specific for TH (Chemicon International, Temecula, CA) containing 0.3% Triton X-100 and 1% normal donkey serum, all in DAKO antibody diluent, S3022, followed by Biotin SP-conjugated affinity-purified donkey anti-rabbit IgG (Jackson ImmunoResearch Laboratories), and developed using the Vector Elite kit (Vector Laboratories) and diaminobenzidine. After PBS washes, the sections were mounted onto gelatin-coated slides and coverslipped with Cytoseal 60.
For deOlmos' amino cupric silver degeneration stains, wild-type B6C3 mice were injected with vehicle or 6-OHDA as above, sacrificed at different time points, and perfused with ice-cold perfusion wash solution followed by 4% (w/v) paraformaldehyde, 40 g/liter sucrose, 14 g/liter hydrated sodium cacodylate. The intact brains were sent to NeuroScience Associates (Knoxville, TN) for embedding and amino cupric silver staining with neutral red counterstain (50). The entire set of brains was embedded into a single unit for processing, sectioning, and staining using Multi-Brain Technology, which assures uniformity of silver staining across cases (www.neuroscienceassociates.com/multibrain.htm).
The entire midbrain was embedded en bloc in paraffin and serially sectioned. From the series, adjacent 5-μm thick sections were sampled at regular 100-μm intervals through the SNc and mounted onto Superfrost Plus slides (Fisher Scientific). All sections from Tg and littermate controls were immunohistochemically stained for TH in a single run and counter-stained with hematoxylin for nuclei. Midbrain slides were heated in an oven (55–60 °C) for 30 min, cleared with xylene (3 × 5 min), and hydrated through graded ethanol series. Slides were then treated with 1% hydrogen peroxide in 0.1 m PBST for 30 min, rinsed with 0.1 m PBST, and treated with 0.1% pepsin in 0.1 n HCl for 10 min. Slides were rinsed with 0.1 m PBST and treated with Immunon protein blocking agent (Thermo Shandon, Pittsburgh, PA) for 30 min. Sections were incubated with the same TH rabbit polyclonal antibody and secondary antibodies used for striatal sections, developed with diaminobenzidine, and counterstained with hematoxylin.
Quantitative Image Analysis
Only animals in which the needle tract demonstrated appropriate injection coordinates were subjected to quantitative analysis of the striatum and the midbrain. Fewer than two or three mouse brains/group were excluded because of variation of more than 0.15 mm from the target site in any direction (6% of the average striatal diameter).
All striatal sections were analyzed with a Nikon Eclipse E800 microscope equipped with an Optronics Magna fire 2.0 digital camera and MetaMorph Meta Imaging software, version 4.6. For each striatal section, the right and left striata were defined as regions of interest by tracing. For both 6-OHDA- and vehicle-injected sides, the autothreshold function was used to define the lesion size in pixels, based upon absence of TH immunoreactivity. The lesion area from five regularly spaced (150-μm interval) striatal levels centered at the injection site was summated and expressed as a percentage of the summated pixel area for the entire striatum. There were no significant differences between Tg animals and their littermate controls in the total striatal volume or in the lesion produced by vehicle injection alone.
Counting of SNc Neurons
Cell counts were performed of SNc TH immunoreactive (TH+) neurons and of total SNc neuronal nuclei, defined by size, open chromatin, and nucleoli. Neuronal profiles with clearly defined nuclei and TH+ soma in the same focal plane were counted in uniformly spaced mesencephalic levels encompassing the SNc beginning at −3.0 mm from bregma ±30 μm and running rostral to caudal to −3.75 mm from bregma (51). Distinction of SNc from the ventral tegmental area was accomplished by restricting analysis to the TH-positive cell group lateral to the medial lemniscus or lateral to the line extending dorsally from the cerebral peduncle. The number of neurons on the lesioned side was expressed as a percentage of the control vehicle-injected side for each animal.
Stereological counts were performed using a Zeiss Axioplan2 photomicroscope equipped with a Zeiss planapochromat 100 × oil objective and a Dell computer using the Neurolucida stereology analysis software (MicroBrightField, Inc., Williston, VT). Based on the optical fractionator method used, cell counting did not depend upon the determination of a volume of reference and a density, but rather relied on random, systematic sampling from a known fraction of a structure's total volume, and neuron number was estimated by extrapolating from this known fraction (52, 53). The mathematical formula for estimating total cell number and the algorithm for cell count used in this study are presented in detail by West et al. (52). Cell counts were performed by counting the number of neurons on the right and left SNc of every fourth section throughout the entire extent of the SNc using a standard mouse atlas (51) as anatomical reference. For each animal, the first SNc section to be counted was determined by generating a random number between 1 and 4. To avoid double counting of neurons with unusual shapes, neurons were counted only when their nuclei/nucleoli were visualized optimally using dissector principles (54). Grid size was 125 × 100 mm; counting frame size, 50 × 50 mm; NA of lens, 1.4; guard zones, 2 mm; counting fraction, 20%. The coefficient of error of the estimate was less than or equal to 0.05.
We have found that paraffin-embedded midbrain sections offer superior morphologic detail for TH immunohistochemistry. Thus, we compared counts of 5-μm paraffin sections with those of more commonly used 30-μm cryostat sections, using a separate set of uninjected mice (n = 6/genotype). There were no significant differences. For example, EC-SOD Tg mice had 8,206 ± 145 TH+ SNc neurons as counted in paraffin sections compared with 8,887 ± 523 SNc neurons using cryostat sections (p > 0.2, Student's t test).
SOD Activity Assays
CuZn-SOD and Mn-SOD activities were assayed by measuring inhibition of xanthine plus xanthine oxidase-mediated cytochrome c reduction at pH 7.8 (55). All measurements were performed in the presence of 10 μm KCN to inhibit the activity of cellular cytochrome c oxidase. Both CuZn-SOD and Mn-SOD are insensitive to this concentration of KCN. To distinguish the contribution of CuZn-SOD and Mn-SOD to the total SOD activity, the same measurement was also repeated in the presence of 1 mm KCN, which inhibits CuZn-SOD but not Mn-SOD activity. One unit of SOD activity is defined as the enzyme activity needed to inhibit 50% cytochrome c reduction.
Brain tissue from five mice/group was processed for EC-SOD activity as described previously (56-58). Briefly, brain tissue was homogenized in 50 mm potassium phosphate, 0.3 m potassium bromide, pH 7.4. After separation from CuZn-SOD and Mn-SOD by concanavalin A-Sepharose chromatography (59), EC-SOD activity was measured by inhibition of partially acetylated cytochrome c reduction at pH 10.0 as described previously (55). The total protein concentration in the homogenates was determined using Coomassie Plus protein assay (Pierce).
RT-PCR
The striata and ventral midbrains were dissected from the brains of EC-SOD Tg and non-Tg littermates, and RNA was isolated by acid phenol-chloroform extractions for RT-PCR analysis of EC-SOD transgene expression as described previously (60).
Western Blots
To analyze regional Mn-SOD expression in the Mn-SOD Tg mice, PBS-perfused brains from 14 or 15 mice/group were dissected fresh on ice. Dissected tissues from sets of 3 or 4 mice were combined by brain region for homogenization and subjected to immunoblot analysis using a rabbit anti-recombinant human Mn-SOD antibody (61) followed by gel band densitometry as described previously (62, 63).
Statistical Analysis
Values are expressed as the mean ± S.E. except where indicated. For comparisons of two groups, a two-tailed Student's t test was used, with p < 0.05 considered significant. Analysis of variance followed by Student's t test with Bonferroni correction was used for multiple comparisons.
RESULTS
Characterization of Transgene Expression in Mouse Brains
Hemizygous Mn-SOD Tg mice displayed 2.3-fold increased MnSOD activity in total brain homogenates compared with non-Tg littermates. Overexpression of Mn-SOD did not affect levels of CuZn-SOD activity in the brain (Table I). Previous analysis of these mice using immunogold electron microscopy have confirmed that the Tg mice overexpress Mn-SOD in mitochondria (64, 65). Western blot analysis using anti-human Mn-SOD antiserum, which reacts with both mouse and human Mn-SOD proteins, was performed to assess Mn-SOD protein expression in the nigrostriatal system (Fig. 1). Based upon band densitometry, wild-type mice showed roughly equivalent levels of endogenous Mn-SOD expression in the cortex and striatum, with slightly lower levels observed in the midbrain. The Mn-SOD Tg mice showed 2.6-fold increased Mn-SOD protein expression in the midbrain and 4.6-fold increased expression in the striatum. Because the striatum and the midbrain constitute the primary sites of injury after intrastriatal 6-OHDA administration, these mice are well suited for testing the hypothesis that mitochondrially derived superoxide contributes to 6-OHDA injury in vivo.
Table I.
Mn-SOD and CuZn-SOD activities from brains of Mn-SOD Tg mice and non-Tg control littermates Results are shown in units/mg of protein ± S.D.; n ≥ 6 mice/sample.
| Non-Tg | Mn-SOD Tg | p value | |
|---|---|---|---|
| units/mg protein | units/mg protein | ||
| Mn-SOD activity | 6.5 ± 0.9 | 14.7 ± 3.8 | < 0.001 |
| CuZn-SOD activity | 30.8 ± 9.6 | 32.0 ± 7.9 |
Fig.1.
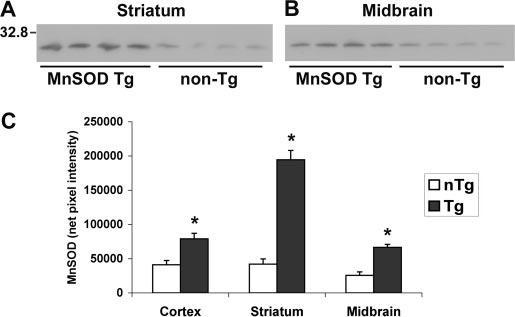
Western blot analysis shows increased Mn-SOD expression in the nigrostriatal system. Each lane represents dissected (A) striata or (B) ventral midbrains from three or four mice of the same genotype which were pooled during homogenization (15 μg of total protein loaded). Note the increased Mn-SOD protein expression in the Tg mice in both brain regions. C, densitometry of Mn-SOD bands from the cortex, striatum, and midbrains of Mn-SOD Tg (dark bars) and non-Tg (nTg) littermates (white bars) confirms significant protein over-expression in all brain regions. Values represent the mean ± S.E. * p < 0.05 compared with non-Tg controls by Student's t test for paired samples.
For the EC-SOD Tg mouse line, characterization of brain EC-SOD expression has been published previously (1, 60). These mice show 4.8-fold increased total brain EC-SOD activity, with significant effects upon both physiologic (hippocampal learning) and pathologic processes (cold-induced brain edema, central nervous system oxygen toxicity) (1, 5, 60, 66). RT-PCR was performed to verify transgene expression in the nigrostriatal system (Fig. 2). In addition, we repeated total brain activity assays in our own breeding colony, finding 3.6 units/mg of protein for EC-SOD activity in the heterozygote Tg mice compared with 0.8 unit/mg of protein in the non-Tg littermate controls.
Fig. 2.
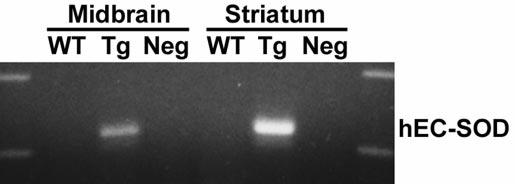
RT-PCR studies show expression of the human EC-SOD transgene in the nigrostriatal system. RT-PCR analysis for human EC-SOD expression in the ventral midbrain and striatum of wild-type (WT) and EC-SOD Tg mice. Note the expression of the human trans-gene in Tg mice. The band is not amplified in control reactions using RNase-pretreated Tg RNA (Neg).
Characterization of 6-OHDA Injury in Wild-type Mice
Initial experiments were conducted using a range of 6-OHDA doses to establish the lesion model. Loss of immunoreactivity for TH, the rate-limiting enzyme for dopamine synthesis, was used to identify injury to SNc neurons and their striatal ter-mini. TH immunoreactivity correlates tightly with other measures of dopaminergic neuron injury (18, 20). Intrastriatal injection of 6-OHDA into the right mouse striatum produced a dose-dependent decrease in TH staining, indicating damage to dopaminergic termini (Fig. 3). Doses of 5 μg of 6-OHDA free base created lesions that extended to or beyond the confines of the striatum at the level of the injection site (not shown). A dose of 2.5 μg of 6-OHDA free base yielded consistent subtotal striatal lesions and was selected for neuroprotection experiments. For subsequent quantitative analysis, the autothresholding function of MetaMorph Image analysis software was used to define the pixel area of the lesion in each of five rostral-caudal striatal planes for each mouse. Normal crossing white matter tracks did not interfere with this analysis (Fig. 3, A and B). The vehicle injected on the left side displayed only minimal disruption of TH immunoreactivity associated with the needle track (Fig. 4, left side, arrows).
Fig. 3.
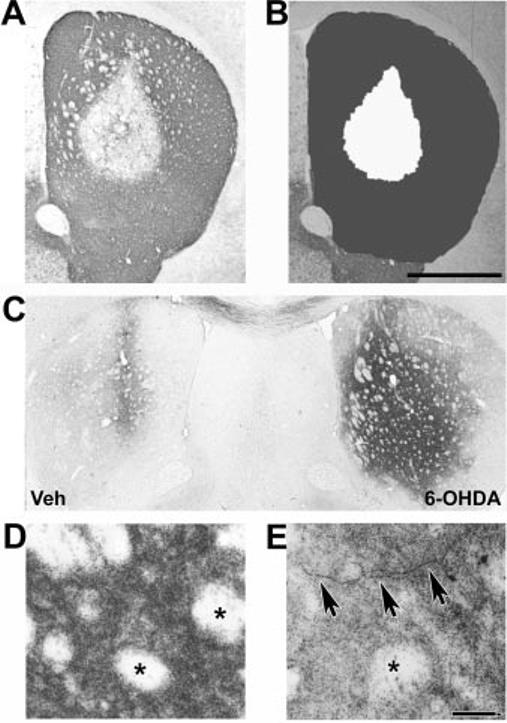
Analysis of striatal lesions elicited by intrastriatal injection of 6-OHDA. Wild-type B6C3 mice received unilateral injections of 6-OHDA free base in their right striata. After 7 days, the animals were sacrificed and their striata processed for TH immunohistochemistry. The 0.5–2.5-μg doses resulted in subsaturating lesions amenable to volumetric analysis, whereas 5-μg doses produced saturating lesions. A, representative section reveals loss of TH immunoreactivity extending from the center of the injection site. B, after digital image capture, the striata were defined as regions of interest (dark gray), and the size of the lesion (white) was determined using the autothresholding function of MetaMorph software. For each mouse, this was performed for the vehicle-injected and the 6-OHDA-injected sides on five uniformly spaced levels spanning the rostral-caudal extent of the striatum. Scale bar, 1,000 μm. C, amino cupric silver degeneration stain of a representative mouse reveals intense staining of the 6-OHDA lesioned right striatum at 1 day after injection. In contrast, cupric silver staining was limited to the region of the needle track on the vehicle-injected left side. D, intense punctate staining of striatal termini in a region distant to the needle track at 1 day after 6-OHDA injection. Note sparing of the crossing white matter bundles that do not contain dopaminergic processes (asterisks). E, axonal degeneration is evident at 4 days after 6-OHDA injection (arrows). Scale bar, 40 μm.
Fig. 4.
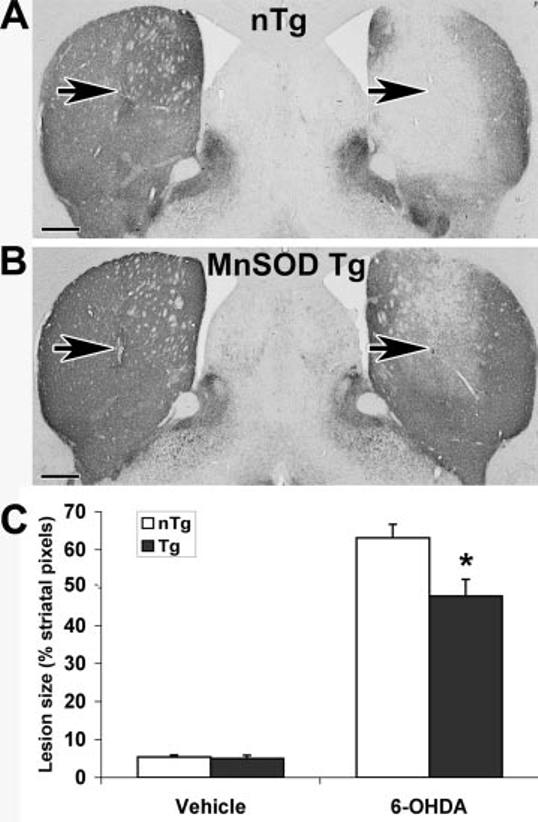
Tg mice overexpressing Mn-SOD are significantly protected from 6-OHDA injury to the striatum (n = 9 mice/group). Mn-SOD Tg mice and non-Tg littermates received intrastriatal injections of 2.5 μg of 6-OHDA free base on the right and an equivalent volume of vehicle on the left. Representative TH-immunostained brain sections at the level of the needle track (arrows) are shown for a non-Tg (nTg) littermate (A) and Mn-SOD Tg mouse (B). Five sections representing the rostral-caudal extent of the striatum were analyzed as described under “Experimental Procedures” and in Fig. 3B. Summated lesion pixels were expressed as a percent of summated total striatal pixels from the five levels. C, the average lesion sizes ± S.E. are shown for the vehicle-injected left side and the 6-OHDA-injected right side of non-Tg littermate controls (white bars) and Mn-SOD Tg mice (dark bars). * p < 0.05 by analysis of variance followed by Student's t test with Bonferroni correction. Scale bar, 500 μm.
Intrastriatal 6-OHDA injection elicited acute TH terminal and axonal injury in mouse striata as assessed with amino cupric silver degeneration stains (Fig. 3, C–E). This stain selectively impregnates disintegrating termini and axons, but staining of normal axons is suppressed, allowing identification of irreversible axonal degeneration (50, 67). At 1 day after injection, there was widespread, strong, punctate staining of degenerating termini on the 6-OHDA-injected side, whereas the vehicle-injected side exhibited silver staining only along the needle track (Fig. 3C). Note the intense punctate staining of the 6-OHDA-injected side distant from the needle track, with sparing of the unaffected crossing white matter bundles (Fig. 3D). By 4 days, degenerating axons were readily identified (Fig. 3E), whereas only a light background stippling remained on the vehicle-injected side. These findings are in agreement with other acute injury models, in which cupric silver staining of termini peaks at 1–3 days, and staining of axons occurs at 3–7 days, with staining disappearing as degenerated debris is cleared (67).
In contrast, there was no visible sign of SNc neuron injury by silver degeneration stain at 3 h to 4 days after lesioning, despite use of the saturating 5-μg dose. This is concordant with published reports in mice and rats, which show that SNc injury is not detectable until 7–10 days after lesion (22), with the bulk of SNc cell loss occurring in the 2nd week (19, 21, 22). In rats, SNc lesions remain stable for months after injury (18, 20). Striatal lesions assessed by TH stains are complete within 1 week, with no significant changes in lesion size at 3 weeks. Based upon these considerations, a 3-week time point was selected for neuroprotection studies.
Effects of Mn-SOD Overexpression on 6-OHDA Injury
Groups of nine Mn-SOD Tg mice and their non-Tg littermates were analyzed after injection with 2.5 μg of 6-OHDA free base. The Mn-SOD Tg mice showed significantly reduced lesion sizes compared with their control littermates (Fig. 4, right side). There were no differences in striatal size between the right (lesioned) and left (control) sides or between Tg and non-Tg mice (summated pixel area from 5 uniformly spaced sections: non-Tg left, 320,837 ± 6,243; non-Tg right, 321,208 ± 5,973; Tg left, 308,386 ± 15,350; Tg right, 301,388 ± 12,864). Tg and control mice also showed identical responses to nonspecific mechanical trauma associated with vehicle injection (Fig. 4, left side). Mn-SOD overexpression has no effect on the activities of glutathione peroxidase, glutathione reductase, catalase, and glucose-6-phosphate dehydrogenase in this line of Tg mice (48). There were also no differences in the brain CuZn-SOD activity of Mn-SOD Tg and littermate controls (Table I). Therefore, protection against 6-OHDA injury to TH termini in the striatum could be attributed specifically to increased Mn-SOD activity.
Unilateral 6-OHDA injection resulted in decreased staining of SNc neuron cell bodies and their dendritic processes (Fig. 5). Image analysis of remaining neurons demonstrated that there was a nonsignificant trend to decreased cell size on the 6-OHDA-injected side compared with the vehicle-injected side at 3 weeks postlesion (Table II). Mn-SOD overexpression conferred significant protection against 6-OHDA-elicited loss of TH+ neurons in the SNc (Fig. 5, A–E). There were no significant differences in TH+ SNc neuron numbers on the vehicle-injected control side between Tg and control littermates (non-Tg, 6,940 ± 374; Tg, 6,206 ± 462). Likewise, there were no significant differences in the size of TH+ neuronal soma or nuclei between Tg and non-Tg littermates on either the vehicle-or the 6-OHDA-injected sides (Table II).
Fig.5.
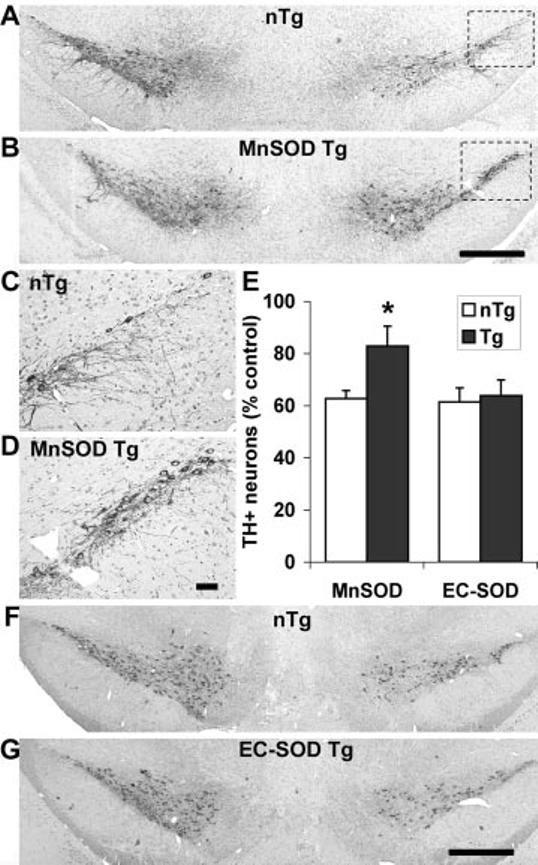
Overexpression of Mn-SOD, but not EC-SOD, confers protection from 6-OHDA-induced TH+ neuron loss in the substantia nigra. Tg mice overexpressing Mn-SOD (n = 9 mice/group) or those overexpressing EC-SOD (n = 7 mice/group) were injected with 6-OHDA or vehicle as described under “Experimental Procedures.” Midbrain sections were stained for TH/hematoxylin and analyzed as described under “Experimental Procedures.” There were no significant differences between Tg and littermate controls in the number of TH+ SNc neuronal profiles on the vehicle-injected left sides (see “Results”). Representative sections for Mn-SOD Tg mice (B) show significant preservation of TH+ SNc neurons on the 6-OHDA-injected right side compared with non-Tg (nTg) littermate controls (A). The lateral SNc of the lesioned side for non-Tg (C) and Mn-SOD Tg (D) mice are shown at higher magnification. In contrast, no differences were observed in TH+ SNc neuron numbers between EC-SOD Tg mice (G) and their control littermates (F). The data obtained from non-Tg (white bars) and Tg (dark bars) mice of both genotypes, expressed as a percent of the vehicle-injected control side, are graphed for comparison (E). * p < 0.05 by analysis of variance followed by Student's t test with Bonferroni correction. Scale bars, 500 μm for A, B, F and G and 50 μm for C and D.
Table II.
Average sizes of TH + neuron soma and nuclei in Mn-SOD Tg mice and non-Tg littermates n = 15 neurons from the lateral SNc from three mice of each geno-type.
| Vehicle |
6-OHDA |
|||
|---|---|---|---|---|
| Soma | Nucleus | Soma | Nucleus | |
| μm2 | μm2 | μm2 | μm2 | |
| nTg | 359 ± 20 | 90 ± 4 | 307 ± 21 | 77 ± 4 |
| Tg | 360 ± 20 | 84 ± 4 | 321 ± 22 | 76 ± 5 |
To demonstrate whether loss of TH+ neurons reflected true SNc neuron loss, which has not been shown previously in mice, we also performed counts of neuronal nuclei irrespective of TH status. Loss of SNc neurons was observed in both Tg and non-Tg mice, indicating neuronal cell death rather than potentially reversible effects on TH expression. Moreover, Mn-SOD Tg mice were significantly protected from 6-OHDA-elicited SNc neuronal cell death (Fig. 6).
Fig.6.
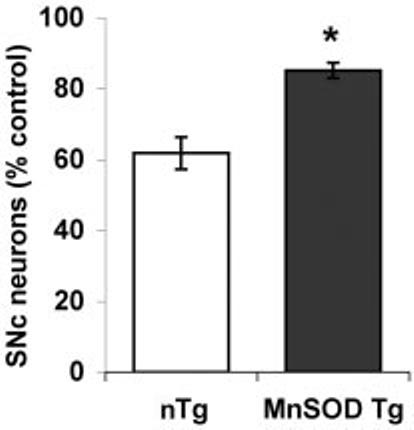
Overexpression of Mn-SOD confers protection from 6-OHDA-induced SNc neuron cell loss in the substantia nigra. The total number of SNc neurons in midbrain sections from Mn-SOD Tg mice and their littermate controls (nTg) was analyzed by counting hematoxylin-stained neuronal nuclei. The data obtained from non-Tg (white bar) and Mn-SOD Tg (dark bar) mice, expressed as a percent of the vehicle-injected control side, are graphed for comparison. * p < 0.05 by Student's t test.
Effects of EC-SOD Overexpression on 6-OHDA Injury
Groups of seven EC-SOD Tg mice and their non-Tg littermates were analyzed after injection with 2.5 μg of 6-OHDA free base. There was no evidence of a protective effect of EC-SOD over-expression on either striatal lesion size or SNc neuron loss (Figs. 5, E–G, and 7). There were no differences in the integrated striatal size between right and left sides or between Tg and non-Tg mice (summated pixel area from five uniformly spaced sections: non-Tg left, 420,285 ± 24,197; non-Tg right, 442,669 ± 24,122; Tg left, 422,834 ± 22,034; Tg right, 444,134 ± 28,123). Tg mice showed no significant differences in responses to nonspecific mechanical trauma associated with vehicle injection (Fig. 7, left side). There were no significant differences in SNc neuron numbers on the vehicle-injected control side between Tg and non-Tg littermates (non-Tg, 9,291 ± 501; Tg, 8,206 ± 145).
Fig.7.
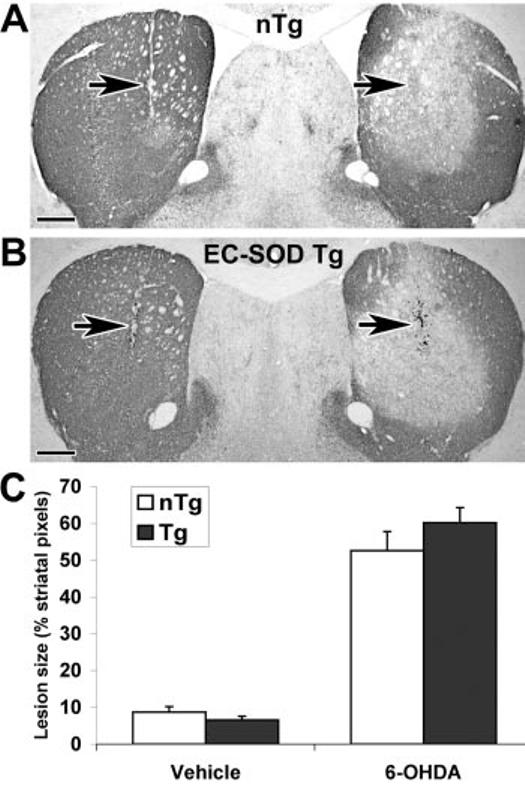
Tg mice overexpressing EC-SOD are not protected from 6-OHDA injury to the striatum (n = 7 mice/group). EC-SOD Tg mice and non-Tg littermates received intrastriatal injections of 2.5 μg of 6-OHDA free base on the right and an equivalent volume of vehicle on the left. Representative TH-immunostained brain sections at the level of the needle track (arrows) are shown for a non-Tg (nTg) littermate (A) and EC-SOD Tg mouse (B). Five sections representing the rostralcaudal extent of the striatum were analyzed as described under “Experimental Procedures.” Scale bars, 500 μm. C, the average lesion size ± S.E. are shown for the vehicle-injected left side and the 6-OHDA-injected right side of non-Tg littermate controls (white bars) and ECSOD Tg mice (dark bars).
DISCUSSION
Mice overexpressing mitochondrial Mn-SOD are protected from 6-OHDA injury to the TH+ striatal termini and cell bodies of SNc neurons (25% reduction in striatal lesion size and 60% reduction in SNc neuron cell loss). In contrast, Tg mice overexpressing EC-SOD showed no protective effects. These findings support a role for mitochondrially derived superoxide in SNc neuron cell death elicited by 6-OHDA.
Mitochondrial dysfunction has long been implicated in Parkinson disease based upon postmortem tissue studies (68) and studies of cybrid cells containing mitochondria derived from patients with Parkinson disease (69, 70). Although measured alterations in Parkinson disease patient material may occur as a result of cellular dysfunction or as primary/amplifying mechanisms that cause neurodegeneration, a role for mitochondrial ROS in striatal terminal injury has been supported by observations that Mn-SOD overexpression protects against loss of striatal dopamine levels after administration of 1-methyl-4-phenyl-1,2,3,6-tetrahydropyridine (MPTP) (3) and methamphetamine (65). However, the ability of Mn-SOD to protect against SNc neuronal loss has not been demonstrated previously. The results presented here indicate that Mn-SOD over-expression can protect against both terminal injury and SNc neuronal cell death.
MPTP is metabolized in the brain to MPP+, an inhibitor of mitochondrial complex I activity. Complex I inhibition enhances superoxide generation (71). In addition, mitochondria can become uncoupled during hypoxic-ischemic insults, resulting in enhanced oxidative injury upon reperfusion (72). Likewise, impairment of oxidative phosphorylation has been associated with seizures and excitotoxicity. Mitochondrial ROS may also play a role in regulating survival and death-associated signaling pathways (73), and altered mitochondrial expression of signaling proteins has been observed in degenerating neurons (74). Because mitochondrial dysfunction is intricately linked to complex I inhibition, ischemic injury, and excitotoxicity, it is perhaps not surprising to find that Mn-SOD overexpression confers protection in these types of models (3, 75-77).
There are several studies in the literature suggesting that mechanisms of action between MPP+ and 6-OHDA are different (39, 78-80). Mitochondria are directly targeted by MPP+ (3). In contrast, a primary role of mitochondrial dysfunction in the 6-OHDA model has been controversial, based upon in vitro systems (38-41). Although extracellular and nonmitochondrial mechanisms have been proposed for 6-OHDA toxicity to cultured cells (36, 39, 40, 42, 43), the results of the current study indicate that oxidative mitochondrial mechanisms contribute to 6-OHDA-elicited injury in vivo.
Although there have been numerous studies indicating profound effects of a 5-fold change in EC-SOD activity upon brain pathophysiology in this line of transgenic mice (1, 5, 47, 49, 60, 66), it is possible that the dose of 6-OHDA given exceeds the capacity of the overexpressed EC-SOD, which accounts for only a minor percentage of total SOD activity in the brain. However, the lack of protection by EC-SOD does correlate mechanistically with studies that suggest that internalization is important for 6-OHDA toxicity in vivo (14). In addition, even in cell culture systems in which 6-OHDA toxicity likely is initiated extracellularly, extracellular administration of CuZn-SOD does not confer protection (32, 63). In contrast, metalloporphyrin antioxidant mimetics, which penetrate into mitochondrial fractions after extracellular administration (81), protect against 6-OHDA-elicited neuronal cell death (32). The ability of mitochondrially targeted antioxidants to protect in both in vivo and in vitro systems suggests a secondary mitochondrial source of ROS which contributes to 6-OHDA-initiated cell death.
Although oxidative stress is a leading pathogenic hypothesis for dopaminergic neuron degeneration, different models may elicit oxidative stress through different mechanisms. In the MPTP model, ROS can emanate from the cytosol and mitochondria of dopaminergic neurons (3, 82-84). Deficits in complex I activity, such as that induced by the pesticide rotenone, also increase intracellular oxidative stress (85). Patients with sporadic Parkinson disease show deficits in complex I activity which can be transmitted through mitochondrial DNA (69, 70), and mitochondrial oxidative stress may be a central mechanism associated with the parkinsonian DJ-1 mutation (86). Overexpression of α-synuclein, the first protein found to be mutated in parkinsonian families (87), may also promote mitochondrial injury and oxidative stress (88, 89). Thus, mitochondrial oxidative stress serves as a potential integration point for many divergent forms of injury relevant to parkinsonian neurodegeneration.
ROS associated with 6-OHDA has been assumed to derive from direct autoxidation (35), with a large extracellular component in most cell culture studies. However, 6-OHDA is relatively short lived, whereas SNc degeneration proceeds over a sustained period of time after a single injection (19). Just as recent data indicate a second wave of extracellular microglial derived superoxide in MPTP injury (90), the ability of Mn-SOD to protect the nigrostriatal system in this study suggests that more than one source of ROS may operate in 6-OHDA toxicity. It is interesting to note that 6-OHDA lesioning causes decreased Mn-SOD message expression in the SNc (91). It has also been suggested that neuronal populations that fail to induce Mn-SOD show increased susceptibility in the neurode-generative disease amyotrophic lateral sclerosis (92). Effective therapies for neurodegenerative diseases may need to provide antioxidant activity to more than one compartment as well as potentially including compounds to regenerate the antioxidants (25).
Acknowledgments
We thank Ye-Shih Ho of Wayne State University, Detroit, MI, for providing breeders of the Mn-SOD Tg mice and data on brain SOD activities in these mice. We thank Teresa Hastings of the University of Pittsburgh for training in rodent stereotaxic brain injections. We are grateful to Serge Przedborski and Vernice Jackson-Lewis of the Department of Neurology of Columbia University Medical Center, Simon Watkins of the University of Pittsburgh Center for Biologic Imaging, and Robert and Rosalyn Garman of Consultants in Veterinary Pathology, Inc., for providing training in quantitative analysis of nigrostriatal injury and many helpful discussions.
The abbreviations used are
- ROS
reactive oxygen species
- CuZn-SOD
copper zinc superoxide dismutase or SOD1
- EC-SOD
extracellular superoxide dismutase or SOD3
- Mn-SOD
manganese superoxide dismutase or SOD2
- MPP+
1-methyl-4-phenylpyridinium
- MPTP
1-methyl-4-phenyl-1,2,3,6-tetrahydropyridine
- 6-OHDA
6-hydroxydopamine
- PBS
phosphate-buffered saline
- RT
reverse transcription
- SNc
substantia nigra pars compacta
- SOD
superoxide dismutase
- Tg
transgenic
- TH+
tyrosine hydroxylase immunoreactive
Footnotes
This study was supported by National Institutes of Health Grants R01 NS40817 and R01 HL63700, the American Federation for Aging Research, and the American Parkinson Disease Association. The costs of publication of this article were defrayed in part by the payment of page charges. This article must therefore be hereby marked “advertisement” in accordance with 18 U.S.C. Section 1734 solely to indicate this fact.
REFERENCES
- 1.Oury TD, Ho Y-S, Piantadosi CA, Crapo JD. Proc. Natl. Acad. Sci. U. S. A. 1992;89:9715–9719. doi: 10.1073/pnas.89.20.9715. [DOI] [PMC free article] [PubMed] [Google Scholar]
- 2.Fullerton HJ, Ditelberg JS, Chen SF, Sarco DP, Chan PH, Epstein CJ, Ferriero DM. Ann. Neurol. 1998;44:357–364. doi: 10.1002/ana.410440311. [DOI] [PubMed] [Google Scholar]
- 3.Klivenyi P, Clair D, Wermer M, Yen HC, Oberley T, Yang L, Flint Beal M. Neurobiol. Dis. 1998;5:253–258. doi: 10.1006/nbdi.1998.0191. [DOI] [PubMed] [Google Scholar]
- 4.Oury TD, Day BJ, Crapo JD. Lab. Invest. 1996;75:617–636. [PubMed] [Google Scholar]
- 5.Oury TD, Piantadosi CA, Crapo JD. J. Biol. Chem. 1993;268:15394–15398. [PubMed] [Google Scholar]
- 6.Mytilineou C, Danias P. Biochem. Pharmacol. 1989;38:1872–1875. doi: 10.1016/0006-2952(89)90426-7. [DOI] [PubMed] [Google Scholar]
- 7.Gee P, Davison AJ. Free Radic. Biol. Med. 1989;6:271–284. doi: 10.1016/0891-5849(89)90054-3. [DOI] [PubMed] [Google Scholar]
- 8.Suzuki YJ, Forman HJ, Sevanian A. Free Radic. Biol. Med. 1997;22:269–285. doi: 10.1016/s0891-5849(96)00275-4. [DOI] [PubMed] [Google Scholar]
- 9.Chu CT, Levinthal DJ, Kulich SM, Chalovich EM, DeFranco DB. Eur. J. Biochem. 2004;271:2060–2066. doi: 10.1111/j.1432-1033.2004.04132.x. [DOI] [PMC free article] [PubMed] [Google Scholar]
- 10.Lang AE, Lozano AM. N. Engl. J. Med. 1998;339:1044–1053. doi: 10.1056/NEJM199810083391506. [DOI] [PubMed] [Google Scholar]
- 11.Dauer W, Przedborski S. Neuron. 2003;39:889–909. doi: 10.1016/s0896-6273(03)00568-3. [DOI] [PubMed] [Google Scholar]
- 12.Beal MF. Nat. Rev. Neurosci. 2001;2:325–334. doi: 10.1038/35072550. [DOI] [PubMed] [Google Scholar]
- 13.Uhl GR. Mov. Disord. 2003;18(Suppl 7):S71–S80. doi: 10.1002/mds.10578. [DOI] [PubMed] [Google Scholar]
- 14.Lees GJ, Kydd RR, Horsburgh RJ, Wright JJ. Brain Res. 1984;308:155–158. doi: 10.1016/0006-8993(84)90928-4. [DOI] [PubMed] [Google Scholar]
- 15.Betarbet R, Sherer TB, MacKenzie G, Garcia-Osuna M, Panov AV, Greenamyre JT. Nat. Neurosci. 2000;3:1301–1306. doi: 10.1038/81834. [DOI] [PubMed] [Google Scholar]
- 16.Dawson TM, Dawson VL. Science. 2003;302:819–822. doi: 10.1126/science.1087753. [DOI] [PubMed] [Google Scholar]
- 17.Betarbet R, Sherer TB, Di Monte DA, Greenamyre JT. Brain Pathol. 2002;12:499–510. doi: 10.1111/j.1750-3639.2002.tb00468.x. [DOI] [PMC free article] [PubMed] [Google Scholar]
- 18.Ichitani Y, Okamura H, Nakahara D, Nagatsu I, Ibata Y. Exp. Neurol. 1994;130:269–278. doi: 10.1006/exnr.1994.1205. [DOI] [PubMed] [Google Scholar]
- 19.Sauer H, Oertel WH. Neuroscience. 1994;59:401–405. doi: 10.1016/0306-4522(94)90605-x. [DOI] [PubMed] [Google Scholar]
- 20.Przedborski S, Levivier M, Jiang H, Ferreira M, Jackson-Lewis V, Donaldson D, Togasaki DM. Neuroscience. 1995;67:631–647. doi: 10.1016/0306-4522(95)00066-r. [DOI] [PubMed] [Google Scholar]
- 21.He Y, Appel S, Le W. Brain Res. 2001;909:187–193. doi: 10.1016/s0006-8993(01)02681-6. [DOI] [PubMed] [Google Scholar]
- 22.Marti MJ, Saura J, Burke RE, Jackson-Lewis V, Jimenez A, Bonastre M, Tolosa E. Brain Res. 2002;958:185–191. doi: 10.1016/s0006-8993(02)03694-6. [DOI] [PubMed] [Google Scholar]
- 23.Ben-Shachar D, Eshel G, Finberg JP, Youdim MB. J. Neurochem. 1991;56:1441–1444. doi: 10.1111/j.1471-4159.1991.tb11444.x. [DOI] [PubMed] [Google Scholar]
- 24.Bensadoun JC, Mirochnitchenko O, Inouye M, Aebischer P, Zurn AD. Eur. J. Neurosci. 1998;10:3231–3236. doi: 10.1046/j.1460-9568.1998.00345.x. [DOI] [PubMed] [Google Scholar]
- 25.Weinberg A, Nylander KD, Yan C, Ma L, Hsia CJ, Tyurin VA, Kagan VE, Schor NF. Brain Res. 2004;1012:13–21. doi: 10.1016/j.brainres.2004.03.048. [DOI] [PubMed] [Google Scholar]
- 26.Asanuma M, Hirata H, Cadet JL. Neuroscience. 1998;85:907–917. doi: 10.1016/s0306-4522(97)00665-9. [DOI] [PubMed] [Google Scholar]
- 27.Munoz AM, Rey P, Soto-Otero R, Guerra MJ, Labandeira-Garcia JL. J. Neurosci. Res. 2004;76:551–562. doi: 10.1002/jnr.20107. [DOI] [PubMed] [Google Scholar]
- 28.Borisenko GG, Kagan VE, Hsia CJ, Schor NF. Biochemistry. 2000;39:3392–3400. doi: 10.1021/bi992296v. [DOI] [PubMed] [Google Scholar]
- 29.Kabuto H, Yokoi I, Iwata-Ichikawa E, Ogawa N. Neurochem. Res. 1999;24:1543–1548. doi: 10.1023/a:1021152115752. [DOI] [PubMed] [Google Scholar]
- 30.Tiffany-Castiglioni E, Saneto RP, Proctor PH, Perez-Polo JR. Biochem. Pharmacol. 1982;31:181–188. doi: 10.1016/0006-2952(82)90208-8. [DOI] [PubMed] [Google Scholar]
- 31.Barkats M, Millecamps S, Bilang-Bleuel A, Mallet J. J. Neurochem. 2002;82:101–109. doi: 10.1046/j.1471-4159.2002.00952.x. [DOI] [PubMed] [Google Scholar]
- 32.Kulich SM, Chu CT. J. Biosci. 2003;28:83–89. doi: 10.1007/BF02970136. [DOI] [PMC free article] [PubMed] [Google Scholar]
- 33.Zhu J-H, Kulich SM, Oury TD, Chu CT. Am. J. Pathol. 2002;161:2087–2098. doi: 10.1016/S0002-9440(10)64487-2. [DOI] [PMC free article] [PubMed] [Google Scholar]
- 34.Pong K, Doctrow SR, Baudry M. Brain Res. 2000;881:182–189. doi: 10.1016/s0006-8993(00)02841-9. [DOI] [PubMed] [Google Scholar]
- 35.Graham DG, Tiffany SM, Bell WR, Jr., Gutknecht WF. Mol. Pharmacol. 1978;14:644–653. [PubMed] [Google Scholar]
- 36.Blum D, Torch S, Nissou MF, Benabid AL, Verna JM. Neurosci. Lett. 2000;283:193–196. doi: 10.1016/s0304-3940(00)00948-4. [DOI] [PubMed] [Google Scholar]
- 37.Soto-Otero R, Mendez-Alvarez E, Hermida-Ameijeiras A, Munoz-Patino AM, Labandeira-Garcia JL. J. Neurochem. 2000;74:1605–1612. doi: 10.1046/j.1471-4159.2000.0741605.x. [DOI] [PubMed] [Google Scholar]
- 38.Glinka YY, Youdim MB. Eur. J. Pharmacol. 1995;292:329–332. doi: 10.1016/0926-6917(95)90040-3. [DOI] [PubMed] [Google Scholar]
- 39.Wu Y, Blum D, Nissou MF, Benabid AL, Verna JM. Neurosci. Lett. 1996;221:69–71. doi: 10.1016/s0304-3940(96)13276-6. [DOI] [PubMed] [Google Scholar]
- 40.Storch A, Kaftan A, Burkhardt K, Schwarz J. J. Neural Transm. 2000;107:281–293. doi: 10.1007/s007020050023. [DOI] [PubMed] [Google Scholar]
- 41.Mazzio EA, Reams RR, Soliman KF. Brain Res. 2004;1004:29–44. doi: 10.1016/j.brainres.2003.12.034. [DOI] [PubMed] [Google Scholar]
- 42.Ryu EJ, Harding HP, Angelastro JM, Vitolo OV, Ron D, Greene LA. J. Neurosci. 2002;22:10690–10698. doi: 10.1523/JNEUROSCI.22-24-10690.2002. [DOI] [PMC free article] [PubMed] [Google Scholar]
- 43.Holtz WA, O'Malley KL. J. Biol. Chem. 2003;278:19367–19377. doi: 10.1074/jbc.M211821200. [DOI] [PubMed] [Google Scholar]
- 44.Michel PP, Hefti F. J. Neurosci. Res. 1990;26:428–435. doi: 10.1002/jnr.490260405. [DOI] [PubMed] [Google Scholar]
- 45.Decker DE, Althaus JS, Buxser SE, VonVoigtlander PF, Ruppel PL. Res. Commun. Chem. Pathol. Pharmacol. 1993;79:195–208. [PubMed] [Google Scholar]
- 46.Fridovich I. J. Biol. Chem. 1997;272:18515–18517. doi: 10.1074/jbc.272.30.18515. [DOI] [PubMed] [Google Scholar]
- 47.Fattman CL, Schaefer LM, Oury TD. Free Radic. Biol. Med. 2003;35:236–256. doi: 10.1016/s0891-5849(03)00275-2. [DOI] [PubMed] [Google Scholar]
- 48.Ho YS, Vincent R, Dey MS, Slot JW, Crapo JD. Am. J. Respir. Cell Mol. Biol. 1998;18:538–547. doi: 10.1165/ajrcmb.18.4.2959. [DOI] [PubMed] [Google Scholar]
- 49.McGirt MJ, Parra A, Sheng H, Higuchi Y, Oury TD, Laskowitz DT, Pearlstein RD, Warner DS. Stroke. 2002;33:2317–2323. doi: 10.1161/01.str.0000027207.67639.1e. [DOI] [PubMed] [Google Scholar]
- 50.de Olmos JS, Beltramino CA, de Olmos de Lorenzo S. Neurotoxicol. Teratol. 1994;16:545–561. doi: 10.1016/0892-0362(94)90033-7. [DOI] [PubMed] [Google Scholar]
- 51.Franklin K, Paxinos G. The Mouse Brain in Stereotaxic Coordinates. Academic Press; San Diego: 1997. [Google Scholar]
- 52.West MJ, Slomianka L, Gundersen HJ. Anat. Rec. 1991;231:482–497. doi: 10.1002/ar.1092310411. [DOI] [PubMed] [Google Scholar]
- 53.West MJ. Neurobiol. Aging. 1993;14:275–285. doi: 10.1016/0197-4580(93)90112-o. [DOI] [PubMed] [Google Scholar]
- 54.Coggeshall RE, Lekan HA. J. Comp. Neurol. 1996;364:6–15. doi: 10.1002/(SICI)1096-9861(19960101)364:1<6::AID-CNE2>3.0.CO;2-9. [DOI] [PubMed] [Google Scholar]
- 55.Crapo JD, McCord JM, Fridovich I. Methods Enzymol. 1978;53:382–393. doi: 10.1016/s0076-6879(78)53044-9. [DOI] [PubMed] [Google Scholar]
- 56.Fattman CL, Chu CT, Kulich SM, Enghild JJ, Oury TD. Free Radic. Biol. Med. 2001;31:1198–1207. doi: 10.1016/s0891-5849(01)00699-2. [DOI] [PubMed] [Google Scholar]
- 57.Oury TD, Schaefer LM, Fattman CL, Choi A, Weck KE, Watkins SC. Am. J. Physiol. 2002;283:L777–L784. doi: 10.1152/ajplung.00011.2002. [DOI] [PubMed] [Google Scholar]
- 58.Tan RJ, Fattman CL, Watkins SC, Oury TD. J. Appl. Physiol. 2004;97:2006–2013. doi: 10.1152/japplphysiol.00480.2004. [DOI] [PubMed] [Google Scholar]
- 59.Marklund SL. Methods Enzymol. 1990;186:260–265. doi: 10.1016/0076-6879(90)86117-e. [DOI] [PubMed] [Google Scholar]
- 60.Thiels E, Urban NN, Gonzalez-Burgos GR, Kanterewicz BI, Barrionuevo G, Chu CT, Oury TD, Klann E. J. Neurosci. 2000;20:7631–7639. doi: 10.1523/JNEUROSCI.20-20-07631.2000. [DOI] [PMC free article] [PubMed] [Google Scholar]
- 61.Chang LY, Kang BH, Slot JW, Vincent R, Crapo JD. Lab. Invest. 1995;73:29–39. [PubMed] [Google Scholar]
- 62.Hanford LE, Fattman CL, Shaefer LM, Enghild JJ, Valnickova Z, Oury TD. Am. J. Respir. Cell Mol. Biol. 2003;29:S77–S81. [PubMed] [Google Scholar]
- 63.Kulich SM, Chu CT. J. Neurochem. 2001;77:1058–1066. doi: 10.1046/j.1471-4159.2001.00304.x. [DOI] [PMC free article] [PubMed] [Google Scholar]
- 64.Oberley TD, Coursin DB, Cihla HP, Oberley LW, el-Sayyad N, Ho YS. Histochem. J. 1993;25:267–279. doi: 10.1007/BF00159118. [DOI] [PubMed] [Google Scholar]
- 65.Maragos WF, Jakel R, Chesnut D, Pocernich CB, Butterfield DA, Clair D, Cass WA. Brain Res. 2000;878:218–222. doi: 10.1016/s0006-8993(00)02707-4. [DOI] [PubMed] [Google Scholar]
- 66.Levin ED, Brady TC, Hochrein EC, Oury TD, Jonsson LM, Marklund SL, Crapo JD. Behav. Genet. 1998;28:381–390. doi: 10.1023/a:1021673703129. [DOI] [PubMed] [Google Scholar]
- 67.Switzer RC., III Toxicol. Pathol. 2000;28:70–83. doi: 10.1177/019262330002800109. [DOI] [PubMed] [Google Scholar]
- 68.Jenner P, Olanow CW. Ann. Neurol. 1998;44(Suppl 1):S72–SS84. doi: 10.1002/ana.410440712. [DOI] [PubMed] [Google Scholar]
- 69.Cassarino DS, Fall CP, Swerdlow RH, Smith TS, Halvorsen EM, Miller SW, Parks JP, Parker WD, Jr., Bennett JP., Jr. Biochim. Biophys. Acta. 1997;1362:77–86. doi: 10.1016/s0925-4439(97)00070-7. [DOI] [PubMed] [Google Scholar]
- 70.Swerdlow RH, Parks JK, Davis JN, Jr., Cassarino DS, Trimmer PA, Currie LJ, Dougherty J, Bridges WS, Bennett JP, Jr., Wooten GF, Parker WD. Ann. Neurol. 1998;44:873–881. doi: 10.1002/ana.410440605. [DOI] [PubMed] [Google Scholar]
- 71.Fiskum G, Starkov A, Polster BM, Chinopoulos C. Ann. N. Y. Acad. Sci. 2003;991:111–119. doi: 10.1111/j.1749-6632.2003.tb07469.x. [DOI] [PubMed] [Google Scholar]
- 72.Duchen MR, McGuinness O, Brown LA, Crompton M. Cardiovasc. Res. 1993;27:1790–1794. doi: 10.1093/cvr/27.10.1790. [DOI] [PubMed] [Google Scholar]
- 73.Horbinski C, Chu CT. Free Radic. Biol. Med. 2005;38:2–11. doi: 10.1016/j.freeradbiomed.2004.09.030. [DOI] [PubMed] [Google Scholar]
- 74.Zhu J-H, Guo F, Shelburne J, Watkins S, Chu CT. Brain Pathol. 2003;13:473–481. doi: 10.1111/j.1750-3639.2003.tb00478.x. [DOI] [PMC free article] [PubMed] [Google Scholar]
- 75.Keller JN, Kindy MS, Holtsberg FW, Clair DK, Yen H-C, Germeyer A, Steiner SM, Bruce-Keller AJ, Hutchins JB, Mattson MP. J. Neurosci. 1998;18:687–697. doi: 10.1523/JNEUROSCI.18-02-00687.1998. [DOI] [PMC free article] [PubMed] [Google Scholar]
- 76.Liang LP, Ho YS, Patel M. Neuroscience. 2000;101:563–570. doi: 10.1016/s0306-4522(00)00397-3. [DOI] [PubMed] [Google Scholar]
- 77.Gonzalez-Zulueta M, Ensz LM, Mukhina G, Lebovitz RM, Zwacka RM, Engelhardt JF, Oberley LW, Dawson VL, Dawson TM. J. Neurosci. 1998;18:2040–2055. doi: 10.1523/JNEUROSCI.18-06-02040.1998. [DOI] [PMC free article] [PubMed] [Google Scholar]
- 78.Oh YJ, Wong SC, Moffat M, O'Malley KL. Neurobiol. Dis. 1995;2:157–167. doi: 10.1006/nbdi.1995.0017. [DOI] [PubMed] [Google Scholar]
- 79.Lotharius J, Dugan LL, O'Malley KL. J. Neurosci. 1999;19:1284–1293. doi: 10.1523/JNEUROSCI.19-04-01284.1999. [DOI] [PMC free article] [PubMed] [Google Scholar]
- 80.Choi WS, Yoon SY, Oh TH, Choi EJ, O'Malley KL, Oh YJ. J. Neurosci. Res. 1999;57:86–94. doi: 10.1002/(SICI)1097-4547(19990701)57:1<86::AID-JNR9>3.0.CO;2-E. [DOI] [PubMed] [Google Scholar]
- 81.Li QY, Pedersen C, Day BJ, Patel M. J. Neurochem. 2001;78:746–755. doi: 10.1046/j.1471-4159.2001.00457.x. [DOI] [PubMed] [Google Scholar]
- 82.Przedborski S, Kostic V, Jackson-Lewis V, Naini AB, Simonetti S, Fahn S, Carlson E, Epstein CJ, Cadet JL. J. Neurosci. 1992;12:1658–1667. doi: 10.1523/JNEUROSCI.12-05-01658.1992. [DOI] [PMC free article] [PubMed] [Google Scholar]
- 83.Lotharius J, O'Malley KL. J. Biol. Chem. 2000;275:38581–38588. doi: 10.1074/jbc.M005385200. [DOI] [PubMed] [Google Scholar]
- 84.Hasegawa E, Takeshige K, Oishi T, Murai Y, Minakami S. Biochem. Biophys. Res. Commun. 1990;170:1049–1055. doi: 10.1016/0006-291x(90)90498-c. [DOI] [PubMed] [Google Scholar]
- 85.Sherer TB, Betarbet R, Stout AK, Lund S, Baptista M, Panov AV, Cookson MR, Greenamyre JT. J. Neurosci. 2002;22:7006–7015. doi: 10.1523/JNEUROSCI.22-16-07006.2002. [DOI] [PMC free article] [PubMed] [Google Scholar]
- 86.Dekker MC, Bonifati V, van Duijn CM. Brain. 2003;126:1722–1733. doi: 10.1093/brain/awg172. [DOI] [PubMed] [Google Scholar]
- 87.Dickson DW. Curr. Opin. Neurol. 2001;14:423–432. doi: 10.1097/00019052-200108000-00001. [DOI] [PubMed] [Google Scholar]
- 88.Hsu LJ, Sagara Y, Arroyo A, Rockenstein E, Sisk A, Mallory M, Wong J, Takenouchi T, Hashimoto M, Masliah E. Am. J. Pathol. 2000;157:401–410. doi: 10.1016/s0002-9440(10)64553-1. [DOI] [PMC free article] [PubMed] [Google Scholar]
- 89.Song DD, Shults CW, Sisk A, Rockenstein E, Masliah E. Exp. Neurol. 2004;186:158–172. doi: 10.1016/S0014-4886(03)00342-X. [DOI] [PubMed] [Google Scholar]
- 90.Wu DC, Teismann P, Tieu K, Vila M, Jackson-Lewis V, Ischiropoulos H, Przedborski S. Proc. Natl. Acad. Sci. U. S. A. 2003;100:6145–6150. doi: 10.1073/pnas.0937239100. [DOI] [PMC free article] [PubMed] [Google Scholar]
- 91.Kunikowska G, Jenner P. Brain Res. 2001;922:51–64. doi: 10.1016/s0006-8993(01)03149-3. [DOI] [PubMed] [Google Scholar]
- 92.Wakai M, Mokuno K, Hashizume Y, Kato K. Acta Neuropathol. 1994;88:151–158. doi: 10.1007/BF00294508. [DOI] [PubMed] [Google Scholar]