Abstract
We examined changes in the genomic response during continuous exposure to the xenoestrogen ethynylestradiol. Isogenic rainbow trout Oncorhynchus mykiss were exposed to nominal concentrations of 100 ng/L ethynyl estradiol (EE2) for a period of three weeks. At fixed time points within the exposure, fish were euthanized, livers harvested and RNA extracted. Fluorescently labeled cDNA were generated and hybridized against a commercially available Salmonid array (GRASP project, University of Victoria, Canada) spotted with 16,000 cDNAs. The slides were scanned to measure abundance of a given transcript in each sample relative to controls. Data were analyzed via Genespring (Silicon Genetics) to identify a list of up and down regulated genes, and to determine gene clustering patterns that can be used as “expression signatures”. Gene ontology was determined using the annotation available from the GRASP website. Our analysis indicates each exposure time period generated specific gene expression profiles. Changes in gene expression were best understood by grouping genes by their gene expression profiles rather than examining fold change at a particular time point. Many of the genes commonly used as biomarkers of exposure to xenoestrogens were not induced initially and did not have gene expression profiles typical of the majority of genes with altered expression.
Keywords: ethynyl estradiol
1. Introduction
The last decade has seen an increase in the attention paid to the potential role of hormone active compounds in the environment (Colborn et al., 1993). These compounds include both environmental contaminants with binding affinities for the estrogen or androgen receptors, such as nonylphenol, methyoxychlor and trenbelone (Denny et al., 2005, Ankley et al., 2003, Larkin et al., 2002a), as well as human and veterinary pharmaceuticals released into the environment, including ethynyl estradiol (EE2) and trenbelone (Kolodziej et al., 2004). The contributions of these compounds towards a suite of disorders in humans, including debate over decreased male fertility due to reduced sperm counts and increased rates of breast cancers (Safe, 1995).
The impacts of endocrine disruptors in aquatic environments are particularly well studied (Ankley et al. 1998). When fish are exposed to estrogenic compounds, the yolk protein vitellogenin is induced (Sumpter and Jobling, 1995; Bjerregaard et al., 1998; Schultz et al., 2001), and is an especially sensitive biomarker for this class of endocrine disrupting compounds. Adverse impacts to wild fish populations exposed to estrogenic compounds have been documented, which include altered sexual phenotype, altered sex ratios, decreased fecundity, and impaired embryonic development (Bortone and Davis, 1994, Parks et al., 2001, Schultz et al., 2003).
The rainbow trout, (Oncorhynchus mykiss), has been shown to be especially sensitive to exposure to xenoestrogens. Vitellogenin has been shown to be induced after exposure to EE2 at levels as low as 0.3 ng/L (Sheehan et al., 1994). Previous studies in our laboratory have seen declines in fertilization success after nine weeks of exposure to EE2 at measured levels of 17 ng L−1 EE2 (Schultz et al., 2003). Associated with reduced fertility were significant reductions in circulating levels of 11-keto-testosterone and elevated levels of 17α,20β dihydroxyprogesterone (Schultz et al. 2003). The toxicokinetics of EE2 after intravascular and water exposures has also been well characterized in trout. During water exposures EE2 is rapidly absorbed, reaching, a pseudo-equilibrium between the exposure water, blood plasma and liver within 24 hours (Skillman et al., in press). The elimination of EE2 is dose-dependent, but can be rapid at doses < 0.1 mg/kg with plasma elimination half-lives of 20 h (Schultz et al., 2001).
Microarrays have emerged as a useful tool to quantify gene expression (Schena et al., 1996), allowing for exploration of the mechanism of toxicity (Hamadeh et al., 2001, Amin et al., 2002, Hamadeh et al., 2002, Neuman and Galvez, 2002, Miracle and Ankley, 2005) and for the identification of potential exposure and effects biomarkers (Snell et al., 2003, Snape et al., 2004, van Delft et al., 2004). Studies with human cell cultures have demonstrated there are gene expression profiles specific to estrogenic compounds (Wang et al., 2004). Microarrays have been used to characterize the response of fish to xenoestrogens. Initial analysis was done using targeted arrays, with cDNA of estrogen responsive genes identified via differential display experiments spotted on nylon membranes (Larkin et al., 2002a,b, 2003a,b). Previous studies conducted in our laboratory examined the estrogenic profiles in rainbow trout using a targeted array (Skillman et al., in press), or a 16,000 gene cDNA array (Skillman et al., in press, Hook et al, 2006). These experiments have consistently identified gene expression profiles specific to estrogenic exposure, regardless of the specific xenoestrogen used (Larkin et al., 2002a,b, 2003a,b, Skillman et al., in press, Hook et al., 2006) In this study, we measured the temporal changes in gene expression following prolonged exposure to EE2. We hypothesized that the gene expression profiles would be dynamic with time and would alter in ways that reflect mode of toxic action.
2. Material and Methods
2.1 Fish
All fish were maintained according to the guidelines established by the Institutional Animal Care and Use Committee (IACUC) of Battelle. These experiments used male isogenic rainbow trout (Oncorhynchus mykiss Walbaum) of the OSU x Swanson cross (Young et al. 1996). These fish were transferred to the Marine Research Operations Sequim, WA (USA) laboratory at 530 degree days in age. Throughout the study, all fish were maintained in single pass flow through tanks under natural photoperiod conditions and fed Bio-Oregon® soft moist pellets of various sizes based on fish size.
2.2 Chemicals
The Ethynyl estradiol was obtained from Sigma-Aldrich Chem Co.
2.3 Exposures
Exposures began in Febuary and continued through March, 2005. Prior to exposure, the fish were group housed in 1400-L circular tanks and then transferred to 370-L circular tanks for exposure. 8 fish were transferred into each tank. Water flow in exposure tanks were 4 ± 1 L / min, temperature was 11.5 ±. 0.5 °C. Trout were continuously exposed to EE2 for up to 21 d using a continuous flow-through exposure system. The nominal exposure level of 100 ng/L EE2 was used throughout the study. A concentrated stock solution of EE2 was prepared in methanol and slowly added to the exposure tanks using a peristaltic pump at a flow rate of 0.10 mL/min (equals 0.0005 % methanol in tanks). Control tanks had only methanol added (solvent control). The exposure tanks were allowed to equilibrate with the EE2 dosing system for 4 d prior to the addition of trout. EE2 concentrations were monitored at day 1, 7 and 21 days during the exposure to quantify actual levels using GC-MS as described in Schultz et al., 2001. Measured concentrations of EE2 in all exposure tanks during the study were between 115 and 137 ng/L with an overall mean value (± SD, n=9 measurements) of 125 ± 8 ng/L.
Three fish were euthanized immediately prior to exposure. These fish served as time 0 controls for all array and qPCR measures of gene expression, since they were never exposed to EE2 yet were at the same maturational state and had been reared in a common environment. All remaining fish were exposed to nominal concentrations of EE2 as described above in three replicate tanks. At fixed periods during exposure, one fish was chosen at random from each tank and euthanized. Fish were euthanized with a lethal overdose of MS 222 (250 mg/L). The liver was immediately removed and a subsection placed in RNAlater (Qiagen) to stabilize the RNA during storage and stored following the manufacturer’s protocols.
2.4 RNA extractions
Microarray experiments were conducted as previously described (Hook et al., 2006). RNA was extracted using a standard TRIzol procedure (Invitrogen) and purified the TURBO DNA free kit (Ambion). Total RNA was quantified via fluorometry using ribogreen reagent (Molecular Probes) and RNA quality was verified via gel electrophoresis. After processing, SUPRNasin (RNase inhbitor, Ambion) was added to help maintain sample integrity and RNA was stored at −80 °C.
2.5 Microarray methods
Salmonid cDNA microarrays were obtained from the GRASP consortium (Dr. Ben Koop, University of Victoria, Canada). These arrays have 16,000 cDNA and EST’s from either Atlantic salmon (Salmo salar) or rainbow trout (Oncorhynchus mykiss). The methods for obtaining the cDNAs for the array, developing the arrays and validating the arrays themselves are desbribed in detail in Rise et al., 2004a. Sequence homology between the two species is sufficiently high, allowing for the cross species use of the array (Rise et al., 2004a). Array hybridizations were performed in a 3x3 replicate design; with three animal replicates and three technical replicates. RNA was transcribed into cDNA and indirectly labeled via an aminoallyl technique (Invitrogen’s Superscript cDNA Indirect Labelling kit). Control cDNA was labeled with Cy3 (Amersham), and exposed cDNA was labeled with Cy5. A split control experiment (where control RNA is put into two separate tubes, labeled with Cy3 or Cy5, then recombined for array hybridization) was also performed to examine genes selected as significant due to differences in dye incorporation (Draghici, 2003). Exposed and control samples were paired according to cDNA yield and label incorporation, combined, and reduced in volume to 32 μl in a vacuum concentrator. Samples were mixed with 20 μg tRNA and 20 μg Herring Sperm DNA to prevent non specific hybridization, then mixed with 35 μL of modified “Genisphere” hybridization buffer (50% formamide, 40% 20x SSC, 9% Denhardt’s solution, 1% SDS). This mixture was then applied to the arrays and allowed to hybridize overnight (16 h) at 45 °C. After hybridization, arrays were washed in SSC/SDS buffers with descending stringency to remove any unhybridized or weakly (nonspecifically) hybridized cDNAs. Arrays were scanned using a Perkin Elmer ScanArray Express, with laser power and PMT gain varied to equalize fluorescence intensity between channels and to prevent oversaturation of signal intensity.
2.6 Microarray data analysis
Data were extracted using ScanArray Express software (Perkin Elmer). The median fluorescence intensity with background subtracted was imported into a MIAME compliant database (Brazma et al., 2001). Genespring (Silicon Genetics) microarray analysis software was used for further analysis. Data were LOWESS normalized (Draghici, 2003), and spots that did not meet a minimum signal intensity were removed. The resultant signal information was analyzed using student’s t-test (p=0.05) with a Benjamani-Hochberg correction for multiple comparisons (GeneSpring). Genes with altered expression were grouped according to their gene expression profile, using simple correlations and a minimum similarity of 80%. Grouping was intentionally not stringent to allow for a managable number of groups. A similar approach has been successfully used to model the response of skeletal muscle to methylpredisolone (Almon et al., 2004). Gene Ontology (GO) terms were taken from the information available on the GRASP website http://web.uvic.ca/cbr/grasp/. These terms were assigned by members of the GRASP consortium as described on the website (von Schalburg et al., 2005 a).
Gene expression data were further analyzed via Hierarchical Cluster Analysis Gene trees were created to group similar genes and allow for better visualization of the data (Butte, 2002). Genes that were found to be significantly different in expression in at least one time were used to create a gene tree in GeneSpring. Trees were created using a Pearson’s correlation (Claverie, 1999) as a similarity measure, and branches that were more than 95% similar were merged
2.7. Quantiative real time PCR
RNA for quantitative real time PCR (qRT PCR) was collected, purified, quantified and stored as described in section 2.4. All qRT PCR analyses were performed using Applied Biosystems 7300 Real time system and the one step RT PCR master mix reagents (Applied Biosystems). Standards for each of the specific genes to be validated via qRT PCR were made either from the cDNA clones used to print the array (gift from Dr. Ben Koop, University of Victoria) or from previously isolated rainbow trout genes (J.A. Small, unpublished). Plasmids of genes to be used as standards were transcribed in vitro (Riboprobe system, Promega) and quantified via fluorometry (Ribogreen quantitation kit, Molecular Probes). Primers used for q RT PCR are given in Table 1. Transcription levels in treated and untreated fish were compared to a dilution series of the above standards. All PCR reactions (samples and standards) were run in triplicate, and a set of PCR reactions were run from three replicates for each treatment. All samples and standards were compared to a no reverse transcriptase control (to eliminate the possibility that signal resulted from DNA contamination), and each plate contained no template controls to serve as blanks. Data were normalized to expression levels of beta actin. Significance was determined via a student’s t-test (p <0.05).
Table 1.
Primers used for qPCR verification
All primers are listed from 5′ to 3′. Fluorescently labeled primers have a 6-FAM fluor on the 5′ end and a TAMRA fluor on the 3′ end.
| Gene | Forward | Reverse | Fluorescently Labeled |
|---|---|---|---|
| 17bdhs | TTCCTACGATGCCTCCTTTAGAA | AGTGTAGCGGCCTATGATGGA | CAGAGTACGCTGCCTGGCCCACC |
| Beta Actin | ACGGCCAGAGGCGTACAG | TTCAACCCTGCCATGT | ACAACACGGCCTGGATGGCCA |
| Cyt oxidase II | GAGGCAATAAAGGCTGTTTGGT | GAGCCGTTCCTTCTTTAGGTGTAA | TAATCGTCCTGGAACTGCGTCTATC |
| Estrogen Receptor | GCAGGACCAAACTCCGTAGTG | TGGCCAACGCGAGGTA | TACCCAGAGGCAAAGTCGCTGCAGA |
| Pyruvate Kinase | TGGTGGGCCTGTCTGTCA | CAGTCCACGTGCCCTAAACA | TCAGTGGTAGTGTCCAATAGGAGCAGA |
| Retinol Binding Protein | TCTGTATTTGCCGAGGAAGCA | AGGCCCGAAGACCAGAAGA | ATCTCCTTTTTCTTGTTTGTGACA |
| Serum Albumin 2 | TCTTCCCAGAGAGCAGCAGATC | GATGCCAGCAGCTTCCACAT | TTGCTGTCCTTGGTGCAGAGCTCG |
| Vitellogenin | CTTGTGAACCCTGAGATC | GCAGCTGGGACGAAAGG | TTGAGTACAGTGGTGTGTGGCCCAAAGA |
| Vitelline Envelope | GCCGGTTCCTCCTCCAAAT | TCCGCTGCCCAGTCTGA | CTGATATAGCTCCTGGGCCCCTCATAGTTG |
| VSVH induced protein | CGAGACCACGTCGCTCAAT | TGAAAAGATCTCTGTGCGCAAA | TAGACAGTGCTAACAGGCTATTTTGCT |
3. Results
3.1 Exposure results and kinetics
In a previous study, we examined the kinetics of EE2 uptake and distribution in tissues of rainbow trout along with the rate of vitellogenin induction. A portion of these results are included in the present study to guide interpretation of array results with regard to EE2 distribution into the liver and the time delays associated with ER activation and associated gene induction. The uptake and distribution of EE2 is shown in Figure 1 panel A. It shows that EE2 is rapidly aborbed from the water, reaching an equilibrium with the plasma within 24 hours (reprinted from Skillman et al., in press). By contrast, vitellogenin induction is much slower, with the protein being gradually induced and leveling off after 48 hours (Figure 1B).
Figure 1.
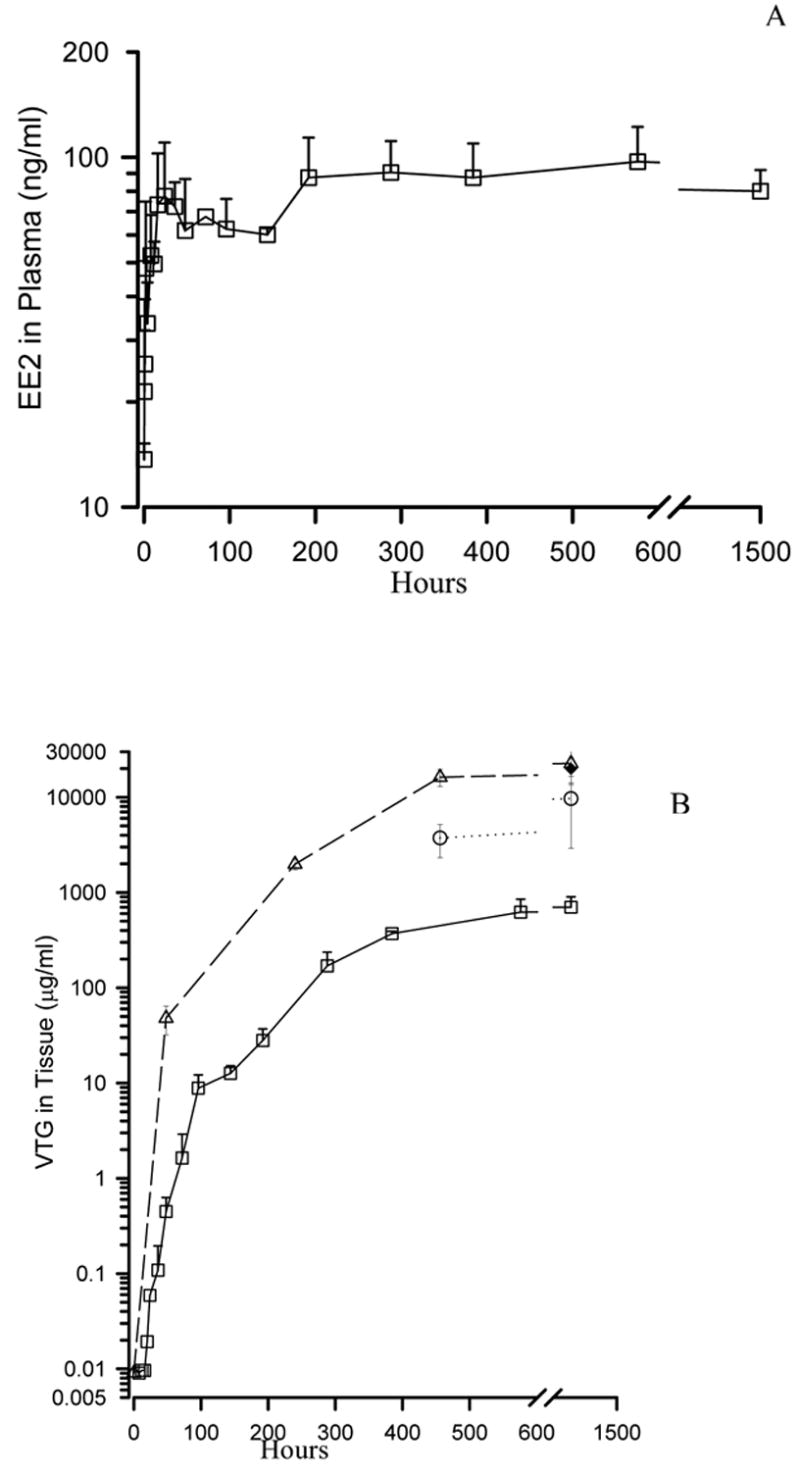
EE2 concentration-time profiles in water and trout that were continuously exposed to 125 ng/l EE2 for up to 1456 hrs in a flow-through exposure system. A) EE2 plasma profile in trout fitted with a dorsal aortic cannula and repetitively sampled (mean ± SD; n= 3–5, error bars not shown fit within the data point). B) VTG plasma and tissue profiles. Plasma VTG (squares, solid line) was measured in aliquots of the same plasma samples used for EE2 analysis in Figure 1A. Liver VTG (triangles, dashed lines), trunk kidney (circles, dotted line) and testes (filled diamond, single measurement at 1456 hrs) were measured in trout serially euthanized at times indicated on the graph (mean ± SD; n= 3–5, error bars not shown fit within the data point). Reprinted from Skillman et al., in press.
3.2 Microarray results
The analysis of our microarray hybrizations indicated that nearly 3000 genes were altered at one or more time point (p <0.05). The temporal changes in expression in these genes are shown in Figure 2. As shown, the 8 hour and one week time points altered the fewest genes, 543 and 508 respectively. At 24 hours, when the concentrations of EE2 within the tissues of the trout are expected to be reaching a pseudo-equilibrium with the exposure, as shown in Figure 1A, 2686 genes had significantly altered expression. While the 24 h time point had the greatest number of genes with altered expression, in general, the magnitiude of change in expression seems to progress with time. The three week exposure had the highest number of strongly up or down regulated genes, whereas the 24 h time point had more genes with expression levels significantly different than controls, the fold change of many of these genes was less than two fold. The proportion of genes up or down regulated differed at each time point, with no discernable trend over time. Many genes with altered expression have unknown function, and grouping the genes by the time points at which they were expressed did not result in any obvious patterns as to functional group.
Figure 2.
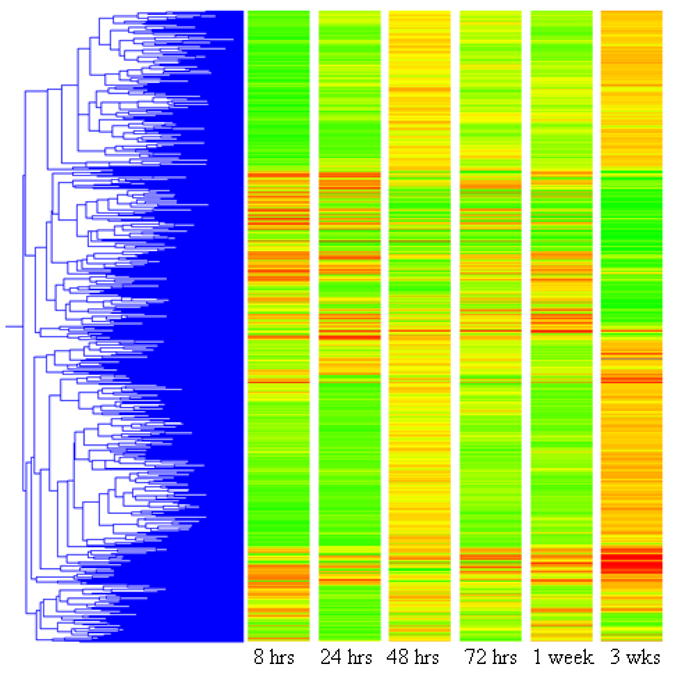
Gene tree depicting those genes with significantly altered expression (t test, p < 0.05, Benjamani-Hochberg multiple test correction) at one or more time points. Genes are clustered for similar expression profiles and are colored by expression level at the specified time point. Bright green genes are down regulated at least 5 fold, bright red genes are up regulated at least 5 fold, and yellow genes are not different from control.
In general, we found that most genes fit one of four expression profile patterns. Gene expression profiles were defined as groups of genes with similar changes in expression over time as determined by simple correlation with degree of similarity set at 80% (Genespring). Most genes were either consistently up regulated, consistently down regulated, initially up regulated or initially down regulated. The expression profile (as fold change) of the first of these groups, genes consistently up regulated, is depicted in Figure 3. As shown in the inset, these genes group together via hierarchical clustering. Most genes in this category, and all other categories, have unknown function. Of the genes with known function, those that bind calcium, with kinase activity or with protein binding activity, as well as those genes involved in the cell cycle, are consistently up regulated. A detailed list of the 227 genes that are grouped as consistently up regulated is in table 1 of the supplementary material.
Figure 3.
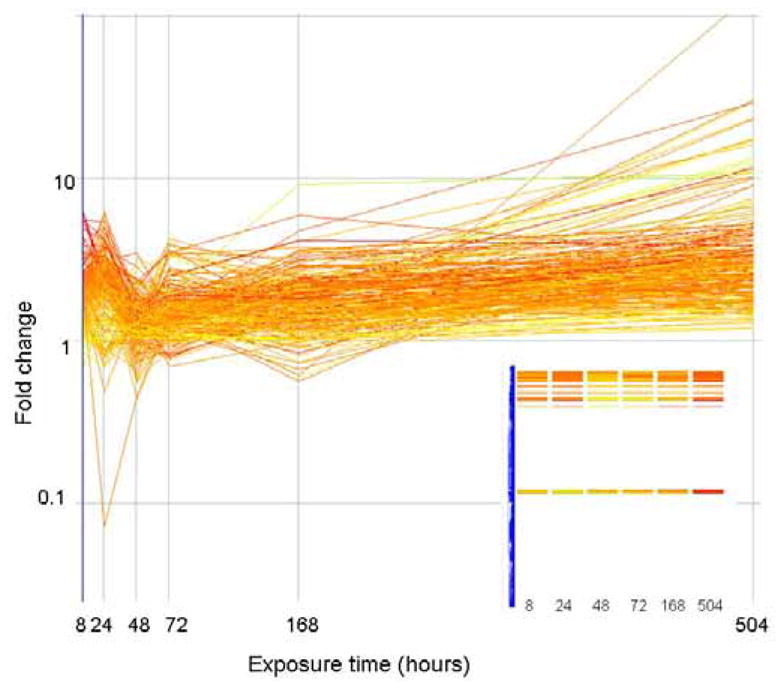
The expression level (as fold change in comparison to control) of genes that correlate (similarity index = 0.8) with a profile that is consistently up regulated are plotted above. Genes are colored by their fold change at t=8 as explained for Figure 2. The inset shows how these genes are arranged in the original clustering algorithim.
Figure 4 shows the gene expression profile of those genes that were consistently down regulated. As shown in the inset, these genes cluster together and are distinct from the cluster shown in Figure 3. Genes in this group include the hemoglobins, genes with copper binding activity or oxidoreductase activity, and genes involved in mitochondrial electron transport, ribosome biogenesis and protein biosysthesis. Genes involved in the inflammatory response and in immune function are also progressively down regulated. Table 2 of the supplementary material gives detailed information regarding the 383 genes in this group of expression profiles.
Figure 4.
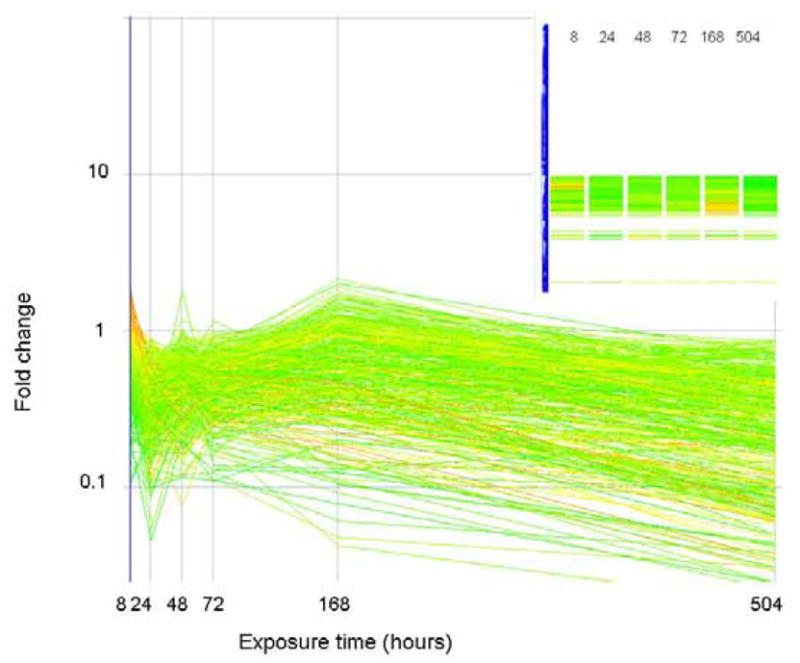
The expression level (as fold change in comparison to control) of genes that correlate (similarity index = 0.8) with a profile that is consistently down regulated are plotted above. Genes are colored by their fold change at t=8 as explained for Figure 2. The inset shows how these genes are arranged in the original clustering algorithim.
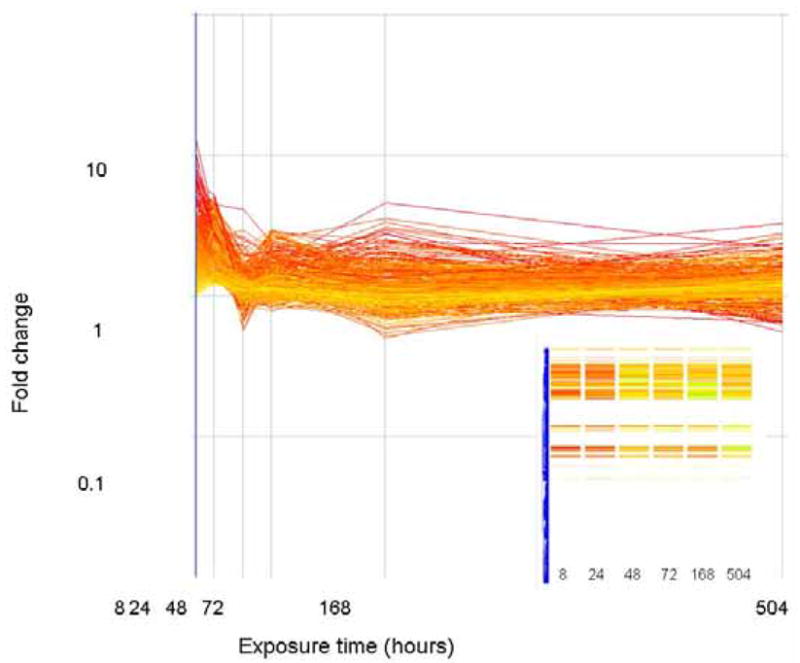
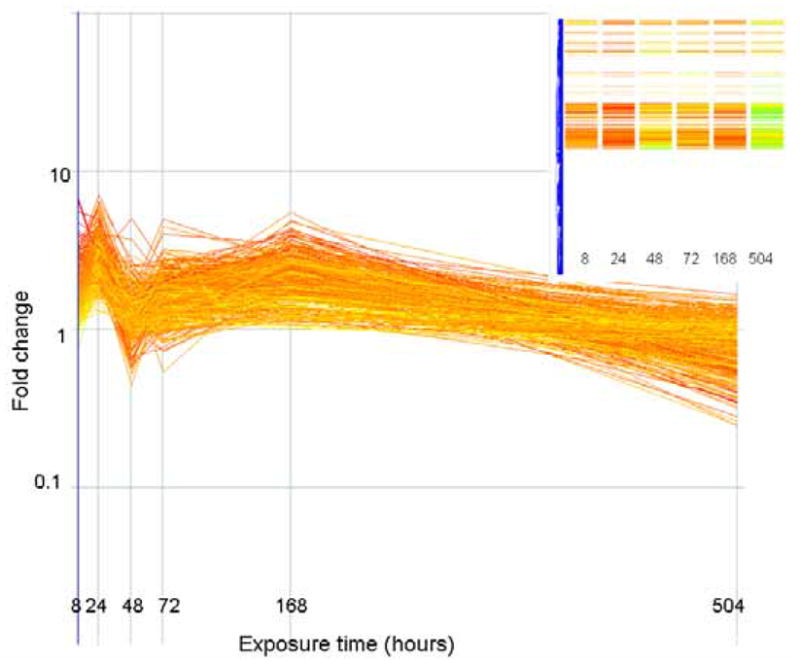
Figure 5 shows the expression profiles of the genes that are initially up regulated. Those genes which are up regulated initially but are down regulated by the end of the exposure are shown in panel a, genes initially up regulated but return to basal levels by the end of exposure are shown in panel b, and those that peak 24 hours after exposure are shown in panel c, respectively. Although the expression profiles are mathematically distinct as determined by simple correlation in Genespring, the clustering alogorithim would overlay these genes (as shown in the inset) and genes within these groups have many of the same functions. Since these groups are similar to each other yet distinct from the other categories, they are considered a unit. Many of the genes up regulated only at early time periods were hydrolases, had oxidoreductase activity, or were protein or nucleic acid binding properties. Genes involved in the broad category of “transport” were down regulated, as were those involved in proteolysis and peptidolysis. Genes with metabolic activity or involved in protein biosynthesis were highly represented in those genes up regulated initially yet down regulated by the end of exposure. Zinc binding genes were exclusively up regulated at 24 hours. Tables 3, 4 and 5 of the supplementary material have detailed lists of the genes in these categories.
Figure 5.
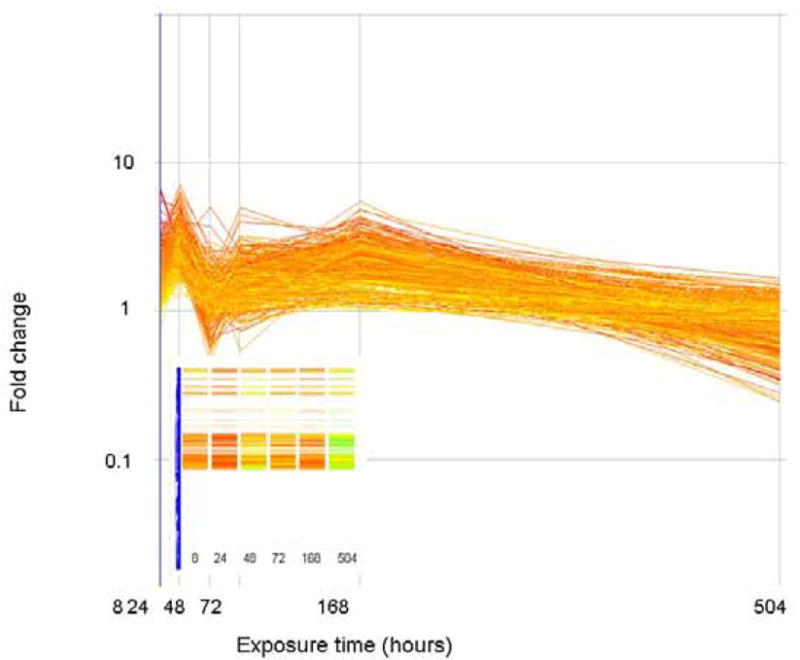
The expression level (as fold change in comparison to control) of genes that correlate (similarity index = 0.8) with a profile that is initially up regulated but down regulated at the end of exposure are plotted above. Genes are colored by their fold change at t=8 as explained for Figure 2. The inset shows how these genes are arranged in the original clustering algorithim.
The expression level (as fold change in comparison to control) of genes that correlate (similarity index = 0.8) with a profile that are initially up regulated but return to basal levels at the end of exposure are plotted above. Genes are colored by their fold change at t=8 as explained for Figure 2. The inset shows how these genes are arranged in the original clustering algorithim.
The expression level (as fold change in comparison to control) of genes that correlate (similarity index = 0.8) with a profile that is only significantly altered (in this case up regulated) at the 24 hour time period. Genes are colored by their fold change at t=8 as explained for Figure 2. The inset shows how these genes are arranged in the original clustering algorithim.
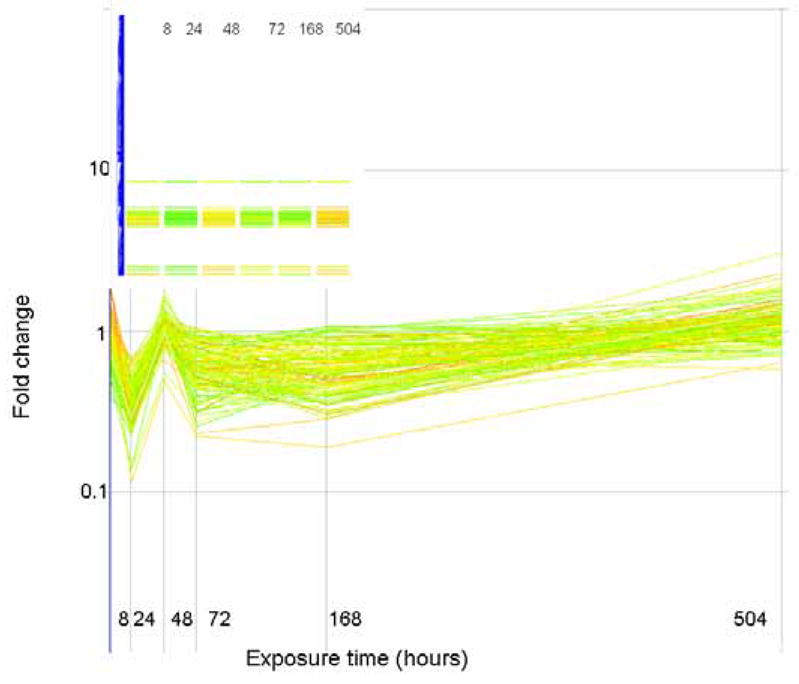
Figure 6 shows the expression profiles of genes initially down regulated. These gene profiles are divided into three subsets that are: initially down regulated but later up regulated (panel 6a), initially down regulated but return to basal levels at the end of exposure (panel 6b) and initially down regulated then show dynamic change with rapid up regulation and subsequent return to basal levels (panel 6c). As with the genes that were up regulated at the initial time periods only, these groups of genes were grouped as being mathematically distinct yet have overlapping gene clusters and functional group assignments. The functions of genes in the expression groups include oxidoreductase genes and those involved in protein biosynthesis, as well as the structural constituents of ribosomes.
Figure 6.
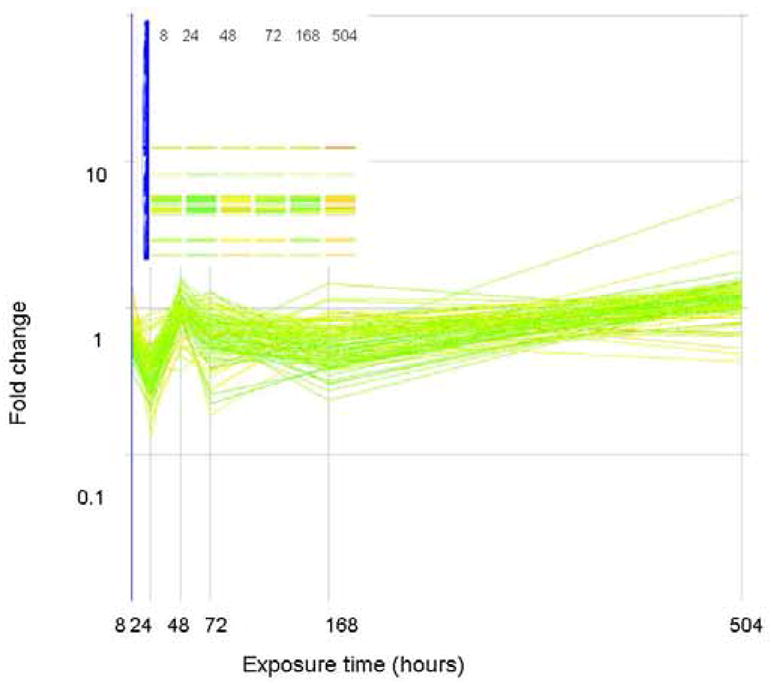
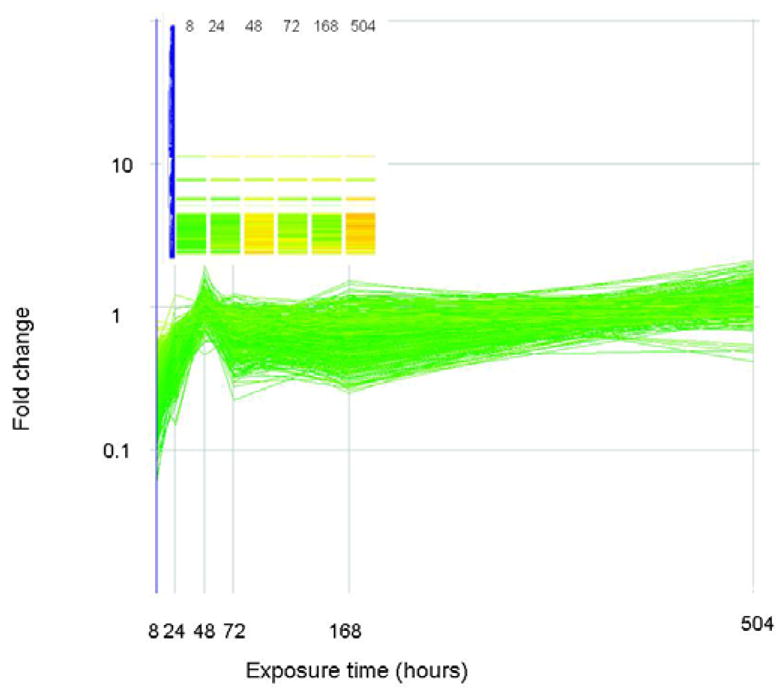
The expression level (as fold change in comparison to control) of genes that correlate (similarity index = 0.8) with a profile that is initially down regulated but up regulated at the end of exposure are plotted above. Genes are colored by their fold change at t=8 as explained for Figure 2. The inset shows how these genes are arranged in the original clustering algorithim.
The expression level (as fold change in comparison to control) of genes that correlate (similarity index = 0.8) with a profile that are initially down regulated but return to basal levels at the end of exposure are plotted above. Genes are colored by their fold change at t=8 as explained for Figure 2. The inset shows how these genes are arranged in the original clustering algorithim.
The expression level (as fold change in comparison to control) of genes that correlate (similarity index = 0.8) with a profile that is only significantly altered (in this case down regulated) at the 24 hour time period. Genes are colored by their fold change at t=8 as explained for Figure 2. The inset shows how these genes are arranged in the original clustering algorithim.
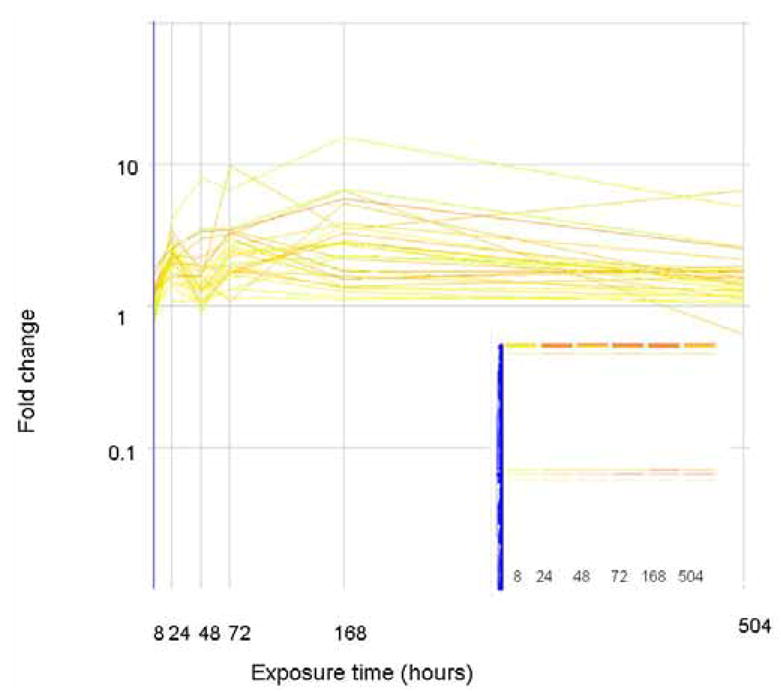
Since none of the expression profiles described above matches the expression levels of commonly used estrogenic biomarkers, we correlated the gene expression profiles of vitellogenin to other genes. These profiles, where genes are progressively and increasingly up regulated after an initial lag period, are shown in Figure 7. Panel a shows those genes that cluster with vitellogenin as measured via the gene array, panel b shows those genes that cluster with the qPCR measures of vitellogenin. In each case, very few genes clustered with vitellogenin, and few of them had known function. One gene that had an expression profile similar to vitellogenin is a “differentially regulated trout protein”, which we have noted in our previous work (Hook et al., 2006). Figure 8 shows those genes which remain unclassified. The expression profiles of these genes do not correlate, they do not cluster together, and they share no functional similarities.
Figure 7.
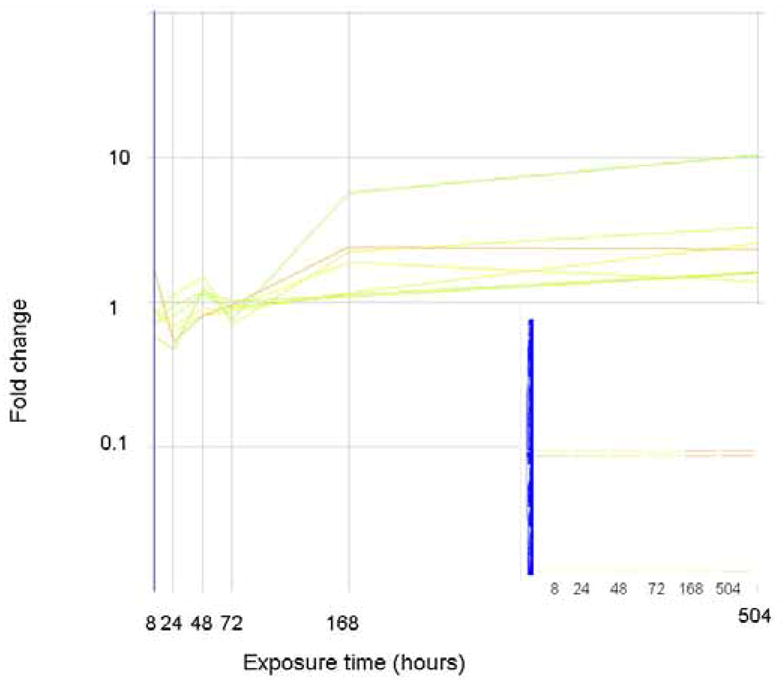
The expression level (as fold change in comparison to control) of genes that correlate (similarity index = 0.8) with the gene expression profile of vitellogenin. Genes are colored by their fold change at t=8 as explained for Figure 2. The inset shows how these genes are arranged in the original clustering algorithim.
The expression level (as fold change in comparison to control) of genes that correlate (similarity index = 0.8) with the gene expression profile of vitellogenin as measured via qPCR. Genes are colored by their fold change at t=8 as explained for Figure 2. The inset shows how these genes are arranged in the original clustering algorithim.
Figure 8.
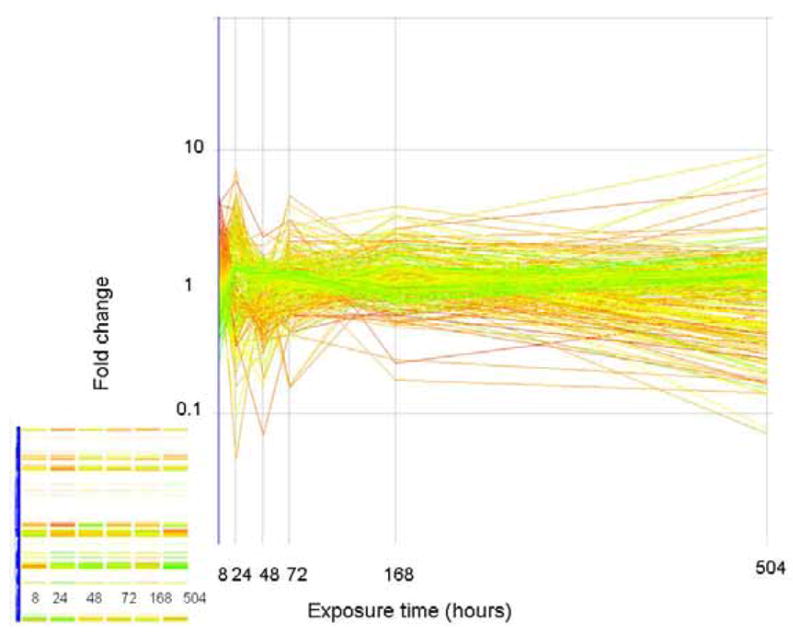
The expression level (as fold change in comparison to control) of genes that do not correlate (similarity index = 0.8) to any of the expression profiles previously described. Genes are colored by their fold change at t=8 as explained for Figure 2. The inset shows how these genes are arranged in the original clustering algorithim.
The array results agree in general as to the direction of change, though not always to the magnitude of that change, as shown in Figure 9. Typically, the array is more conservative than qPCR, and differences in expression are greater as measured by qPCR. For instance, the vitelline envelope protein (panel D) was up regulated to a greater extent than predicted by the array. The direction of change predicted by the array was generally accurate, but occasionally a change in expression was predicted that could not be verified via qPCR, for instance the last time point of the VSVH induced protein. The agreement between array for the estrogen receptor and vitellogenin were particularly poor, as will be discussed below.
Figure 9.
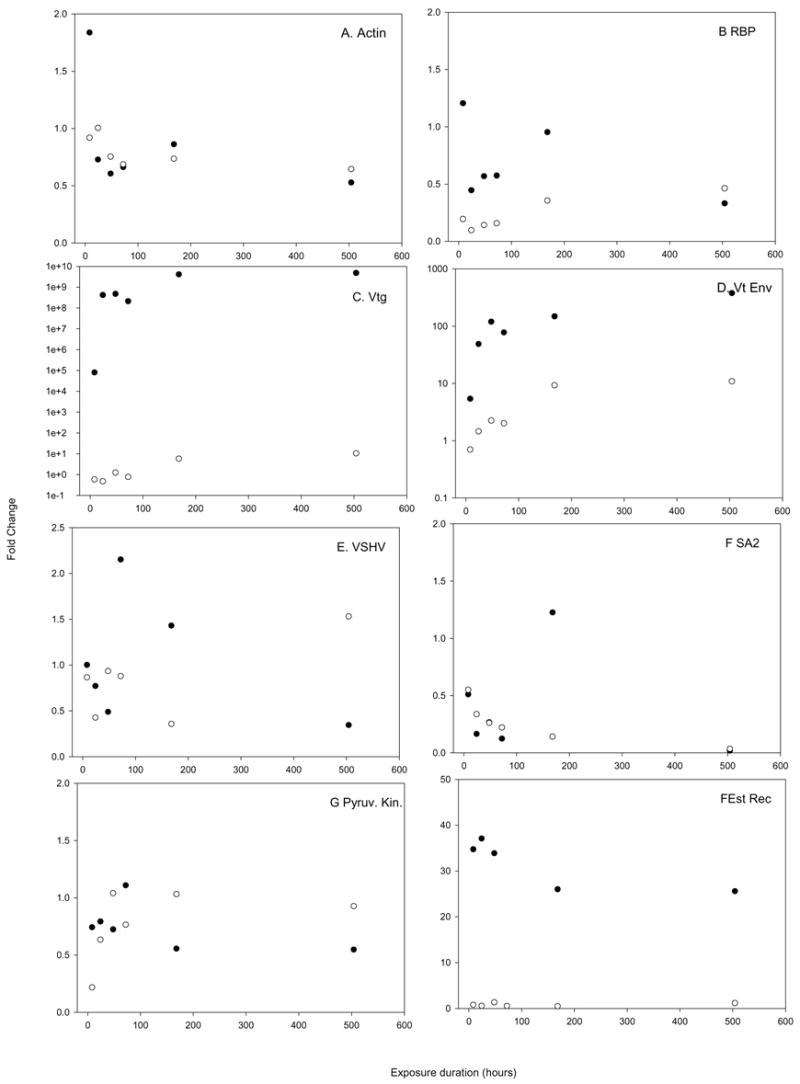
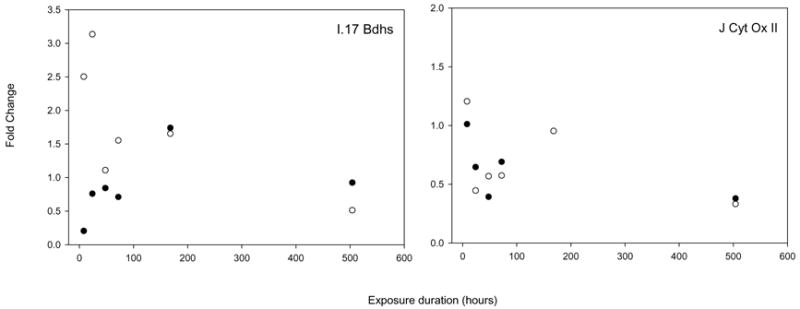
qPCR verification of array results. The expression levels (as fold change in comparison to t=0 controls) are plotted for each of the time points. Open circles denote those measurements made via the array, closed circles denotes those measurements made via qPCR. Panel A shows beta actin, panel B shows a retinol binding protein, panel C shows vitellogenin, panel D show the vitelline envelope protein, panel E shows the VSHV induced protein, panel F shows Serum albumin 2, panel G shows pyruvate kinase, panel H shows the estrogen receptor, panel I shows 17 beta hydroxyl steroid dehydrogenase and panel J shows Cytochrome oxidase II.
4. Discussion
Our array results show the dynamic nature of the transcriptomic response to xenoestrogens. At each time point, a large number of genes (543 at 8 hours following exposure to 2486 at 24 hours after exposure) had altered levels of expression when compared to time 0. The identities of these genes and the magnitude of change in expression differed with time. Although some genes had a constant change expression (as shown in Figures 3 and 4), many more had profiles that showed genes altered at early time points, but not at later ones. The 24 hour time point, when EE2 levels in the exposure media achieve a pseudo-equilibrium with plasma and liver, has the most altered genes. Also, many of the genes had altered expression at the earlier time periods, but not at later periods, presumably because the trout has some compensatory physiological functions to the altered levels of circulating reproductive hormones. Very few genes had the progressively increasing expression levels that are associated with vitellogenin, the vitelline envelope proteins or the estrogen receptor alpha, the classic biomarkers of expsore to estrogenic compounds.
We found the complex data set generated by high density gene arrays was best approached by examining the changes in gene expression over time (gene expression profiles), rather than examining the fold changes in gene expression at fixed time points. This approach relies on the fact that genes with similar expression profiles typically have similar function (Eisen et al., 1998, Waring et al., 2003, Hamadeh et al., 2001, 2002) and has been successfully used by other researchers with similar data sets (Almon et al., 2004). When we grouped genes by time point, we were unable to discern functional groupings. However, when the genes were grouped by how their expression changed with time and by how they were clustered, we could group the genes together by functional category. Although the high number of unknown genes (62 to 79%) makes any analysis of function somewhat crude and speculative, it may provide valuable insight as to the functional changes and metabolic costs of xenoestrogen response.
The changes in gene expression we observed may be a direct effect of xenoestrogen exposure, or may instead be a secondary impact of the response to xenoestrogens. The time following the initiation of exposure at which the relative level of transcription is altered may be an indication as to whether the change is a direct response to EE2 (mediated by activation of ER-alpha) or a change mediated by secondary responses subsequent to the initial gene activation. We would expect that the primary impacts of EE2 would be mediated by the estrogen receptor alpha and would be initiated within the first 24 hours after exposure. An example of a primary response to the elevated levels of circulating EE2 would be the altered expression levels of the hydrolases, which contribute to steroid metabolism, particularly early in exposure. Of the hydrolases with altered levels of expression following exposure to EE2, 39 were most altered at the initial two time-points, whereas only 11 were altered at any of the other time points. The secondary responses would be alterations in gene expression in response to the initial transcriptomic changes. Hemoglobins and blood coagulating agents were consistently down regulated in our exposures. This may be a compensatory response to the increased viscosity of the blood due to the greatly elevated levels of circulating vitellogenin. Many of the spots (28 total) encoding hemoglobins were initially down regulated at 24 hours, and most significantly down regulated at three weeks. However, a few (only 5) spots were down regulated initially, and other spots did not change in response to EE2 exposure. The fish may become more susceptible to anoxia and injury as the hemoglobin content of the blood is lowered. Other changes in expression we have documented correspond to the known function of EE2. For instance, von Schalburg et al., (2005) suggested that immune cells may modulate the development of germ line cells, and may have their expression levels regulated by circulating steroid hormone levels.
Our array results were verified using q rt PCR, with generally concordant results. In general, the array agreed with the qPCR assay to the direction of change but not the magnitude. The array was typically more conservative than qPCR in determining which genes were significantly altered. We have previously reported good agreement between this array and its qPCR verification (Hook et al., 2006, Skillman et al., in press), as have other researchers working with this array. Two genes that did not show agreement between the array and qPCR measurements were the estrogen receptor and vitellogenin. As we have discussed in greater detail in previous papers (Hook et al., 2006), there are two isoforms of the estrogen receptor in trout: one is basally transcribed whereas the other is induced by estrogen and xenoestrogens (Pakdel et al., 2000, Thomas, 2000, Sabo-Atwood et al., 2004). We hypothesize that the basally transcribed isoform is on the array and the inducable isoform is what we measured via qPCR. When the sequence of the vitellogenin spot is aligned via CLUSTAL W to its best match in Genbank (accession number #X92804 O. mykiss vtg 1) (Figure 10), there are many gaps and areas that do not allign. Since a large portion of the spot for vitellogenin may not encode vitellogenin, there is likely a high degree of nonspecific hybridization, which would greatly decrease the sensitivity of the array. These findings highlight the need to use arrays as a semi- quantitative screening tool and to carefully check the annotation of genes of interest to the researcher. The expression profiles we obtained for vitellogenin and the estrogen receptor via qPCR match those obtained by other researchers (Aruwke et al. 2001, Hemmer et al., 2002, Craft et al., 2004).
Figure 10.
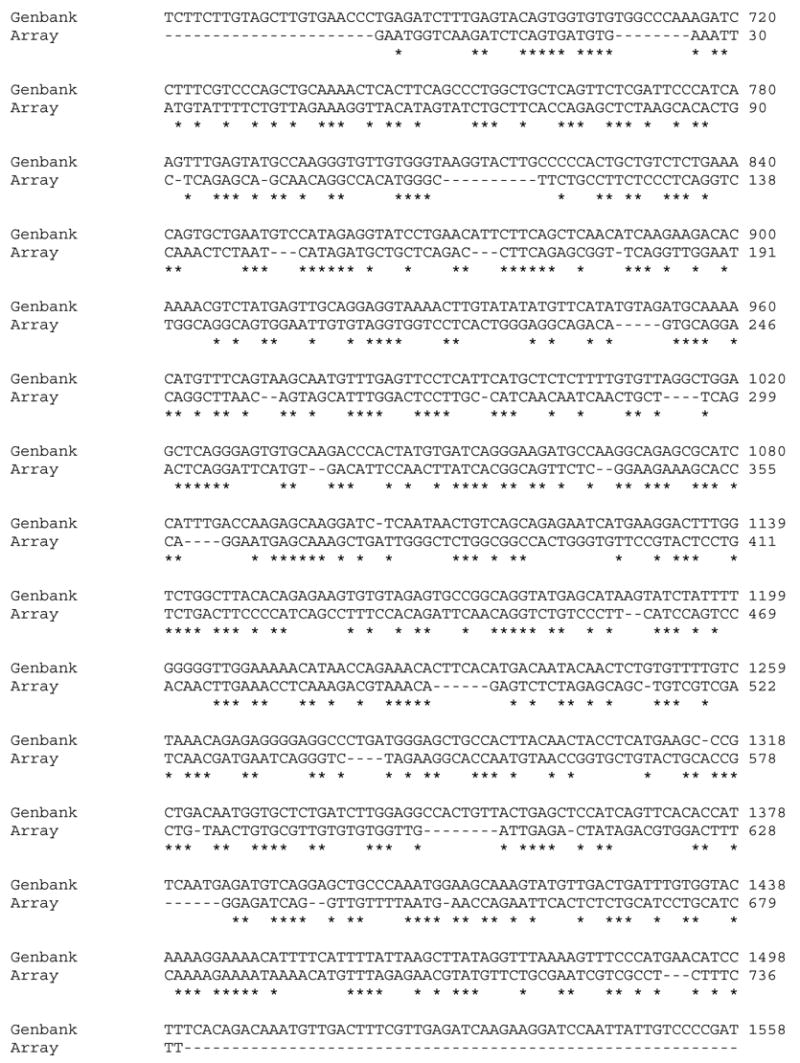
Allignment of the vitellogenin sequence on the array with its best match in GenBank. The asterisk beneath a base pair denotes a perfect match in the sequence.
The alterations in gene expression that we report have been observed by other researchers studying the response to xenoestrogens in fish. Other researchers using arrays to study the hepatic gene expression profiles of fish exposed to estrogenic compounds have observed down regulation in the expression levels of transferrin (Larkin et al., 2003b), which is among the genes we found to be consistenly down regulated. Williams et al. (2003) reported that the elongation factors 1 and 2, complement component 3, and translation initiation factor 3 subunit 6 were down regulated in male fish from a polluted river when compared to male fish from a pristine river. We found that both elongation factors and the complement component 3 were consistently down regulated in response to EE2, and that the translation initiation factor 3 subunit 9 was initially down regulated.
The aim of this study was to characterize the gene expression following exposure to EE2, a common xenoestrogen. The typical “estrogenic” profile that one thinks of is that of vitellogenin, the vitelline envelope proteins and the estrogen receptor alpha – a gene that is induced after an initial lag period and is progressively up regulated to levels that are typically 100’s to 1000’s fold above control levels as exposures progress. We found very few genes that followed this typical profile. Instead, we found that the vast majority of genes with altered expression following exposure to EE2 followed one of four profiles: these genes were up or down regulated through out exposure, but not to the high level typically seen with the traditional biomarkers of xenoestrogen exposure, and genes that were initially up or down regulated, but returned to “normal” levels during exposure. We were intrigued with the observation that the 24 hour time point is the most dynamic time point as far as the number of genes changed. This study suggests that temporal changes in biomarkers of exposure to a contaminant may not correlate well with the onset of physiological impacts of contaminant exposure. The function of some of the genes changed suggests important ecological consequences of xenoestrogen exposure. A fish with down regulated inflammatory and immune response, blood coagulation and hemoglobin could be more susceptible to injury, disease or anoxia for instance. The onset of these potential impacts would not be expected to correlate with measurable increases in vitellogenin at the transcript or protein level. Further study is needed to evaluate the potential ecological consequences of the transcriptomic changes following prolonged exposure to xenoestrogens.
Supplementary Material
Acknowledgments
This research was supported by the U. S. Department of Energy under contract DE-AC06-76RLO 1830 and NIEHS grant 5R01ES012446-03. The arrays used in this study were purchased from the GRASP consortium http://web.uvic.ca/cbr/grasp/. The authors would like to thank G. Cooper for technical assistance.
Footnotes
This paper is based on a presentation given at the conference: Aquatic Animal Models of Human Disease hosted by the University of Georgia in Athens, Georgia, USA, October 30 – November 2, 2005.
Publisher's Disclaimer: This is a PDF file of an unedited manuscript that has been accepted for publication. As a service to our customers we are providing this early version of the manuscript. The manuscript will undergo copyediting, typesetting, and review of the resulting proof before it is published in its final citable form. Please note that during the production process errors may be discovered which could affect the content, and all legal disclaimers that apply to the journal pertain.
References
- Almon RR, DuBois DC, Piel WH, Jusko WJ. The genomic response of skeletal muscle to methylprednisolone using microarrays, tailoring data mining to the structure of the pharmacogenomic time series. Pharmacogenomics. 2004;5:525–552. doi: 10.1517/14622416.5.5.525. [DOI] [PMC free article] [PubMed] [Google Scholar]
- Amin RP, Hamadeh HK, Bushel PR, Bennett L, Afshari CA, Paules RS. Genomic interrogation of mechanism(s) underlyng cellular responses to toxicants. Toxicology. 2002;181182:555–563. doi: 10.1016/s0300-483x(02)00481-x. [DOI] [PubMed] [Google Scholar]
- Ankley GT, Jensen KM, Makynen EA, Kahl MD, Korte JJ, Hornung MW, Henry TR, Denny JS, Leino RL, Wilson VS, Cardon MC, Hartig PC, Gray LE. Effects of the androgenic growth promoter 17-beta-trenbolone on fecundity and reproductive endocrinology of the fathead minnow. Environ Toxicol Chem. 2003;22:1350–1360. [PubMed] [Google Scholar]
- Ankley G, Mihaich E, Stahl R, Tillitt D, Colborn T, McMaster S, Miller R, Bantle J, Campbell P, Denslow N, Dickerson R, Folmar L, Fry M, Giesy J, Gray LE, Guiney P, Hutchinson T, Kennedy S, Kramer V, LeBlanc G, Mayes M, Nimrod A, Patino R, Peterson R, Purdy R, Ringer R, Thomas P, Touart L, Van der Kraak G, Zacharewski T. Overview of a workshop on screening methods for detecting potential (anti-) estrogenic/androgenic chemicals in wildlife. Environ Toxicol Chem. 1998;17:68–87. [Google Scholar]
- Arukwe A, Kullman SW, Hinton DE. Differential biomarker and protein expressions in nonylphenol and estradiol-17β treated rainbow trout (Oncorhynchus mykiss) Comp Biochem Physiol C. 2001;129:1–10. doi: 10.1016/s1532-0456(01)00170-3. [DOI] [PubMed] [Google Scholar]
- Bjerregaard P, Korsgaard B, Christiansen LB, Pedersen KL, Christensen LJ, Pedersen SN, Horn P. Monitoring and Risk assessment for endocrine disruptors in the aquatic environment, a biomarker approach. Arch Toxicol Suppl. 1998;20:97–107. doi: 10.1007/978-3-642-46856-8_9. [DOI] [PubMed] [Google Scholar]
- Bortone SA, Davis WB. Fish intersexuality as an indicator of environmental stress. Bioscience. 1994;44:165–172. [Google Scholar]
- Colborn T, vom Saal FS, Soto AM. Developmental Effects of Endocrine Disrupting Chemicals in Wildlife and Humans. Environ Health Perspect. 1993;101:378–384. doi: 10.1289/ehp.93101378. [DOI] [PMC free article] [PubMed] [Google Scholar]
- Denny JS, Tapper MA, Schmieder PK, Hornung MW, Jensen KM, Ankley GT, Henry TR. Comparison of relative binding affinities of endocrine active compounds to fathead minnow and rainbow trout estrogen receptors. Environ Toxicol Chem. 2005;24:2948–2953. doi: 10.1897/04-595r.1. [DOI] [PubMed] [Google Scholar]
- Eisen MB, Spellman PT, Brown PO, Botstein D. Cluster analysis and display of genome-wide expression patterns. Proc Natl Acad Sci USA. 1998;95:14863–14868. doi: 10.1073/pnas.95.25.14863. [DOI] [PMC free article] [PubMed] [Google Scholar]
- Hamadeh HK, Bushel P, Paules RS, Afshari CA. Discovery in toxicology, mediation by gene expression array technology. J Biochem Mol Toxicol. 2001;15:231–242. doi: 10.1002/jbt.10006. [DOI] [PubMed] [Google Scholar]
- Hamadeh HK, Bushel PR, Jaydev S, Martin K, DiSorbo O, Siber S, Bennett L, Tennant R, Stoll R, Barrett JC, Blanchard K, Paules RS, Afshari CA. Gene expression analysis reveals chemical specific profiles. Toxicol Sci. 2002;67:219–231. doi: 10.1093/toxsci/67.2.219. [DOI] [PubMed] [Google Scholar]
- Hemmer MJ, Bowman CJ, Hemmer BL, Friedman SD, Marcovich D, Kroll KJ, Denslow ND. Vitellogenin mRNA regulation and plasma clearance in male sheepshead minnows (Cyprinodon variegates) after cessation of exposure to 17β estradiol and p-nonylphenol. Aquat Toxicol. 2002;58:99–112. doi: 10.1016/s0166-445x(01)00238-7. [DOI] [PubMed] [Google Scholar]
- Hook SE, Skillman AD, Small JA, Schultz IR. Gene expression patterns in Rainbow Trout, Onorhynchus mykiss, exposed to a suite of model toxicants. Aquatic Toxicology. 2006;77:372–385. doi: 10.1016/j.aquatox.2006.01.007. [DOI] [PMC free article] [PubMed] [Google Scholar]
- Kolodziej EP, Harter T, Sedlak DL. Dairy wastewater, aquaculture, and spawning fish as sources of steroid hormones in the aquatic environment. Environ Sci Technol. 2004;38:6377–6384. doi: 10.1021/es049585d. [DOI] [PubMed] [Google Scholar]
- Larkin P, Sabo-Attwood T, Kelso J, Denslow ND. Gene expression analysis of largemouth bass exposed to estradiol, nonylphenol, and p,p ’-DDE. Comp Biochem Physiol B. 2002a;133:543–557. doi: 10.1016/s1096-4959(02)00155-0. [DOI] [PubMed] [Google Scholar]
- Larkin P, Folmar LC, Hemmer MJ, Poston AJ, Lee HS, Denslow ND. Array technology as a tool to monitor exposure to fish xenoestrogens. Mar Environ Res. 2002b;54:395–399. doi: 10.1016/s0141-1136(02)00172-1. [DOI] [PubMed] [Google Scholar]
- Larkin P, Sabo-Attwood T, Kelso J, Denslow ND. Analysis of gene expression profiles in largemouth bass exposed to 17-B-Estradiol and to Anthroprogenic contaminants that behave as estrogens. Ecotoxicology. 2003a;12:463–468. doi: 10.1023/b:ectx.0000003031.05390.b5. [DOI] [PubMed] [Google Scholar]
- Larkin P, Folmar LC, Hemmer MC, Poston AJ, Denslow ND. Expression profiling of estrogenic compounds using a sheepshead minnow cDNA Macroarray. Environ Health Perspect. 2003b;111:839–846. [PubMed] [Google Scholar]
- Pakdel F, Metivier R, Flouriot G, Valotaire Y. Two different estrogen receptor (ER) isoforms with different estrogen dependencies are generated from the trout ER gene. Endocinology. 2000;141:571–580. doi: 10.1210/endo.141.2.7296. [DOI] [PubMed] [Google Scholar]
- Parks LG, Lambright CS, Orlando EF, Guillette LJ, Ankley GT, Gray LE., Jr Masculinization of female mosquitofish in kraft mill effluent –contaminated Fenholloway River water is associated with androgen receptor agonist activity. Toxicol Sci. 2001;62:257–267. doi: 10.1093/toxsci/62.2.257. [DOI] [PubMed] [Google Scholar]
- Sabo-Atwood T, Kroll KJ, Denslow ND. Differential expression of largemouth bass (Micropterus salmoides) estrogen receptor isotypes by alpha, beta and gamma by estradiol. Molec Cell Endocrinol. 2004;218:107–118. doi: 10.1016/j.mce.2003.12.007. [DOI] [PubMed] [Google Scholar]
- Safe SH. Environmental and dietary estrogens in human health – is there a problem? Environ Health Perspect. 1995;103:346–351. doi: 10.1289/ehp.95103346. [DOI] [PMC free article] [PubMed] [Google Scholar]
- Schena M, Shalon D, Heller R, Chai A, Brown PO, Davis RW. Parallel human genome analysis, microarray-based expression monitoring of 1000 genes. Proc Natl Acad Sci USA. 1996;93:10614–10619. doi: 10.1073/pnas.93.20.10614. [DOI] [PMC free article] [PubMed] [Google Scholar]
- Schultz IR, Orner G, Merdink JL, Skillman A. Dose-response relationships and pharmacokinetics of vitellogenin in rainbow trout after intravascular administration of 17α-ethynylestradiol. Aquat Toxicol. 2001;51:305–318. doi: 10.1016/s0166-445x(00)00118-1. [DOI] [PubMed] [Google Scholar]
- Schultz IR, Skillman A, Nicolas J-M, Cyr DG, Nagler JJ. Short term exposure to 17α-Ethynylestradiol decreases the fertility of sexually maturing male rainbow trout (Oncorhynchus mykiss) Environ Toxicol Chem. 2003;22:1272–1280. [PubMed] [Google Scholar]
- Sheehan DA, Bucke D, Matthiessen P, Sumpter JP, Kirby MF, Neall P, Waldock M. The effects of low levels of 17alpha-ethylnylestradiol upon plasma vitellogenin levels in male and female rainbow troutOncorhynchus mykiss. In: Muller R, Lloyd R, editors. Sublethal and Chronic Effects of Pollutants on Freshwater Fish. Fishing News Books; London: 1994. pp. 99–112. [Google Scholar]
- Skillman AD, Nagler JJ, Hook SE, Small JA, Schultz IR. Dynamics of Ethynylestradiol Exposure in Rainbow Trout (Oncorhynchus mykiss), Absorption, Tissue Distribution and Hepatic Gene Expression Patterns. Environ Toxicol Chem. doi: 10.1897/05-565r.1. in press. [DOI] [PMC free article] [PubMed] [Google Scholar]
- Sumpter JP, Jobling S. Vitellogenesis as a biomarker for estrogenic contamination of the marine environment. Enivron Health Perspect. 1995;103:173–178. doi: 10.1289/ehp.95103s7173. [DOI] [PMC free article] [PubMed] [Google Scholar]
- Thomas P. Chemical interference with genomic and nongenomic actions of steroids in fishes, role of receptor binding. Mar Environ Res. 2000;50:127–134. doi: 10.1016/s0141-1136(00)00114-8. [DOI] [PubMed] [Google Scholar]
- vanDelft JHM, van Agen E, van Breda SGJ, Herwijnen MH, Stall YCM, Kleinjans JCS. Discrimination of genotoxic from non-genotoxic carcinogens by gene expression profilining. Carcinogenesis. 2004;25:1265–1276. doi: 10.1093/carcin/bgh108. [DOI] [PubMed] [Google Scholar]
- Wang DY, McKague B, Liss SN, Edwards EA. Gene expression profiles for detecting and distinguishing potential endocrine disrupting compounds in environmental samples. Environ Sci Technol. 2004;38:6396–6406. doi: 10.1021/es049235r. [DOI] [PubMed] [Google Scholar]
- Waring JF, Cavet G, Jolly RA, McDowell J, Dai H, Ciurionis R, Zhang C, Stoughton R, Lum P, Ferguson A, Roberts CJ, Ulrich RG. Development of a DNA microarray for toxicology based on hepatotoxin-regulated sequences. Environ Health Perspect. 2003;111:863–870. [PubMed] [Google Scholar]
Associated Data
This section collects any data citations, data availability statements, or supplementary materials included in this article.


