Abstract
Objectives
To determine the value and limitations of Tc-99m MAG3 clearance measurements obtained using a gamma camera (camera-based MAG3 clearance), a prospective study was conducted to evaluate the reproducibility of the camera-based MAG3 clearance compared to that of the conventional creatinine clearance.
Materials and Methods
Twenty-four male patients with stable renal function entered the study; the mean age was 66.5 ± 7.9 years and the mean serum creatinine was 1.38 ± 0.57 mg/dL. MAG3 renal scans and 24-hour creatinine clearance measurements were performed 11 ± 8 days apart. A camera-based MAG3 clearance was obtained at the time of each MAG3 scan; no blood samples were required. Bland-Altman plots were constructed to assist in data analysis.
Results
The Pearson correlation for the first and second camera-based MAG3 clearances (means of 151 vs 158 mL/min/1.73m2, respectively) was 0.965 compared to 0.729 for the two creatinine clearance measurements (means of 62 vs 72 mL/min/1.73m2, respectively). Even with the omission of two outliers, the creatinine clearance would have to change by 58.2% compared to the baseline measurement before the clinician could be confident the change exceeded the error of measurement; in contrast, the change required for the camera-based MAG3 clearance was 30.8%.
Conclusion
This study demonstrates that MAG3 clearance obtained using a camera-based technique shows greater precision than the conventional creatinine clearance and is superior to the creatinine clearance for monitoring changes in renal function.
Keywords: creatinine clearance, camera-based MAG3 clearance, Tc-99m mercaptoacetyltriglycine, renal function
INTRODUCTION
Management of urologic patients often requires an accurate evaluation of renal function. In clinical practice, the serum creatinine is the most commonly utilized method of monitoring renal function, however the test is insensitive; by the time the creatinine rises, there has been a major loss of renal function1. The creatinine clearance provides a more sensitive method for monitoring renal function but this test is cumbersome and inconvenient for patients as well as physicians. Further, the inherent physiological and methodological variability of the creatinine clearance measurement severely limits its utility1,2. There is currently a need for a more reliable yet convenient method to monitor renal function in urologic patients. The test needs to be precise so that changes in the measured values represent changes in renal function rather than physiological fluctuations and/or methodological variables.
99mTc-mercaptoacetytriglycine (MAG3) has now become the most widely used renal radiopharmaceutical in the United States. MAG3 is extracted by the renal tubules similar to PAH (para-aminohippuric acid) and I-131 OIH (orthoiodohippurate); consequently, the MAG3 clearance provides a measurement of effective renal plasma flow (ERPF) which is used to assess and monitor changes in renal function3–11. The normal MAG3 clearance is approximately 300–320 mL/min/1.73m2, 7–8; moreover, the MAG3 clearance parallels the creatinine clearance9 and can be measured at the time of a standard radionuclide renal scan using a camera-based technique that does not require any blood samples10–13. The camera-based MAG3 clearance technique has been validated in a multicenter trial using a multiple plasma sample clearance technique as the gold standard10.
Before using the MAG3 clearance to monitor changes in renal function, however, the urologist needs to know the normal variation in the MAG3 clearance to be able to determine when a change is clinically meaningful. To answer this question, we conducted a prospective study to compare the reproducibility of the camera-based MAG3 clearance measurements with the reproducibility of creatinine clearance measurements in patients with stable renal function.
MATERIALS AND METHODS
Patient Population and Study Protocol
A prospective study was conducted in 24 male patients at the Veterans Affairs Medical Center, Atlanta, GA. The study was approved by the Institutional Review Board of Emory University and the Atlanta Veterans Affairs Medical Center and informed consent was obtained. Patients with normal renal function and patients with impaired but stable renal function were identified by members of the Urology Service and invited to participate. MAG3 renal scans and 24-hour creatinine clearance measurements were performed a mean of 11 ± 8 days apart (range, 2–29 days). Patients were given a urine container, instructed in the need for meticulous urine collection and returned the 24-hour urine container in the morning at the time of the MAG3 scan. On three occasions, there was a laboratory error and the creatinine clearance was not recorded. Clearance data from one MAG3 study were excluded because of dose infiltration. One patient had a single left kidney.
In all subjects, the clearance of 99mTc MAG3 was measured concurrently with the MAG3 scan using a gamma camera technique that does not require blood or urine sampling (camera-based clearance). Patients received an intravenous injection of 1–2 mCi (37–74 MBq) of 99mTc MAG3 and data were acquired and processed using the QuantEMTM 2.0 software9,10. Briefly, the software determines the percent injected dose in each kidney from 1–2.5 minutes post-injection and uses an algorithm derived from a multicenter trial to convert the sum of the percent injected dose in the left and right kidneys to a global MAG3 clearance (mL/min/1.73m2) 10. The pre-injection and post-injection syringes containing the 1–2 mCi (37–74 MBq) dose were counted on the camera; counts in the post-injection syringe were corrected for decay and subtracted from the counts in the pre-injection syringe to determine counts injected. To obtain percent injected dose in each kidney, the kidney counts from 1–2.5 minutes post-injection were corrected for background, infiltration, attenuation and renal depth and divided by the counts injected; complete details of the methodology are described in previous publications 9,10. The reproducibility of the camera-based MAG3 clearance was compared to the reproducibility of the creatinine clearance.
Statistical Analysis
To describe the reproducibility of measurements, we calculate the measurement error as the repeat measurement minus the first measurement; this difference is called ‘error’ throughout this paper. We describe the distribution of error via the mean and the standard deviation (SD). Since any value beyond 1.96 times the SD is considered to be unlikely, any difference beyond this number can be considered as a measurable change from the baseline. Percent error is calculated as error /baseline value. The paired t-test was used to test the null hypothesis that the mean change is zero. Rejection of this hypothesis indicates that there is a significant systematic bias. Correlations between the baseline and repeat measurements were calculated. To assess reproducibility, Bland–Altman plots were constructed14. To address the clinical question of change compared to baseline, modified Bland-Altman plots were also calculated relating the percent change between the baseline and repeat measurements to the baseline measurement.
RESULTS
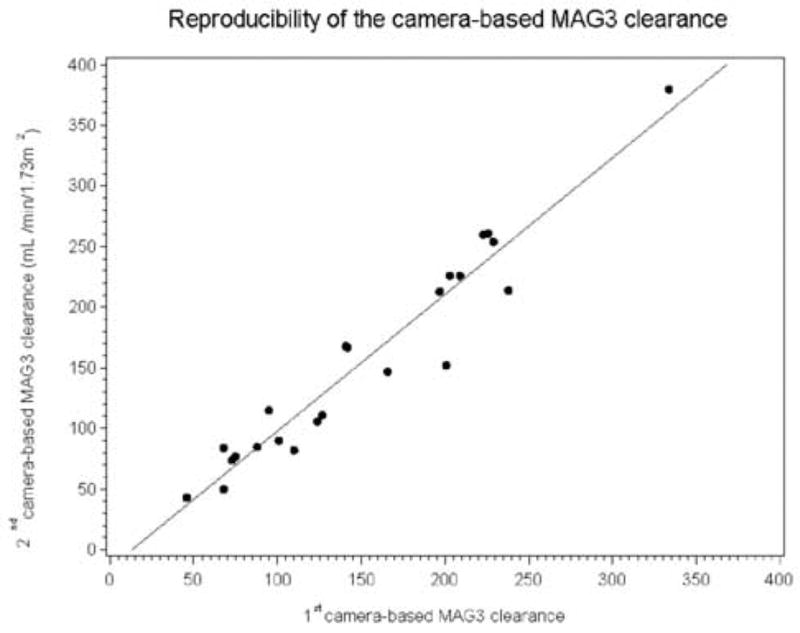
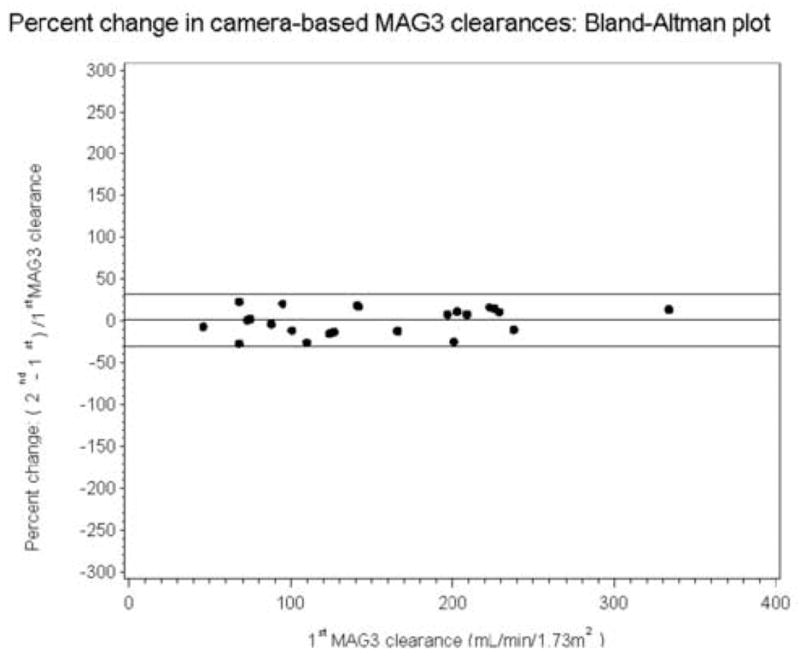
The mean age of the patients was 66.5 ± 7.9 years (range, 51 to 79 years). At entry, the mean serum creatinine was 1.38 ± 0.57 mg/dL (range, 0.7 to 2.8 mg/dL). The mean values for the baseline and repeat camera based MAG3 clearances were 151 ± 73 and 156 ± 86 mL/min/1.73 m2, respectively, with a Pearson correlation of 0.965 (Table 1). There was no significant difference between the first and second MAG3 clearance measurements (p=0.40). The standard deviations of the MAG3 clearance values (and relative function measurements) were relatively large because the subject population was heterogeneous and included patients with normal and significantly reduced renal function. The equivalence of the two MAG3 clearance measurements is further supported by the fact that the slope of the regression line (1.12) was not significantly different from unity, p = 0.07, and the intercept (−14.9) was not significantly different from zero, p = 0.20 (Fig 1A). A Bland–Altman plot (not presented) showed that the magnitude of the error increased as the magnitude of MAG3 clearance increased; however, when the error was expressed as a percentage of the baseline value [(repeat clearance – baseline clearance)/baseline clearance], the mean error was 1.04% (15.7% SD). The significant change is calculated by multiplying the SD of the mean of the individual differences by 1.96; consequently, any change beyond 30.8% is a significant change beyond the error of measurement and is illustrated by the Bland-Altman plot (Fig 1B).
Table 1.
Reproducibility of MAG3 and creatinine clearance measurements
| Variable | Number | 1st Study (mean ± SD* | 2nd Study (mean ± SD)* | Mean Error (SD)1 | P-value for difference* |
|---|---|---|---|---|---|
| MAG3 clearance (mL/min/1.73 m2) | 23 | 151 ± 73 | 156 ± 86 | 4.39 (24.43) | 0.40 |
| Serum creatinine (mg/dL) | 24 | 1.38 ± 0.57 | 1.33 ± 0.53 | −0.05 (0.15) | 0.16 |
| Creatinine clearance (mL/min/1.73 m2) | 21 | 62 ± 29 | 72 ± 30 | 10.06 (21.53) | 0.04 |
The p-value tests the null hypothesis that the mean values are the same using a paired t-test. The standard deviations are large because the population was heterogeneous.
Error = Repeat measurement – Initial Measurement
Figure 1A.

Linear regression showing the relationship between the two camera-based MAG3 clearance measurements. The intercept of the regression line was −14.9, not significant different from zero, p = 0.20; moreover, the slope of the regression line was 1.12, not significantly different from unity (p = 0.07).
Figure 1B.

Bland-Altman plot showing that the error is relatively constant when it is expressed as a percent of the baseline value [(baseline minus repeat measurement)/baseline value]; the mean percent error was only 1.04% with a SD of 15.7%. Consequently, a change exceeding 31.4% represents a significant change in the camera based MAG3 clearance beyond the error of measurement. The horizontal lines represent the mean error and 1.96 SD of the error.
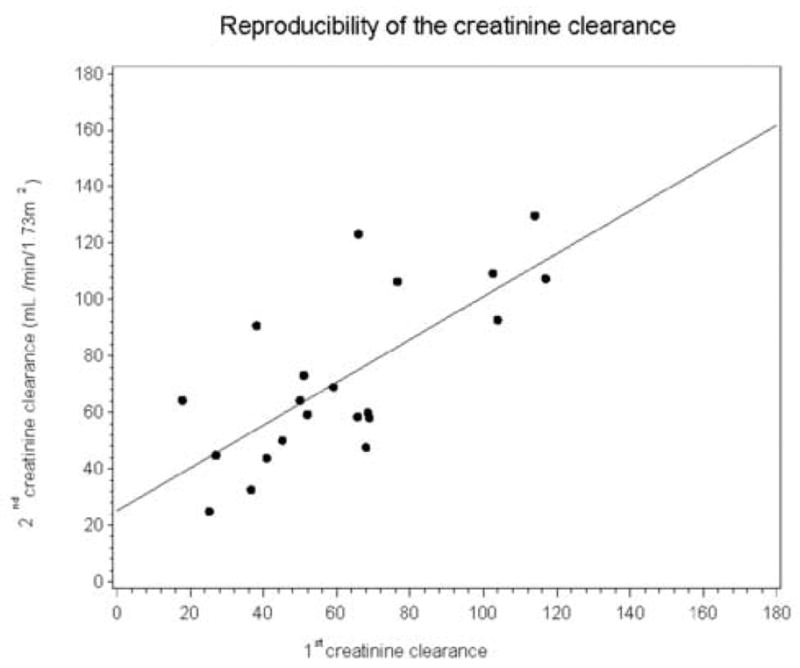
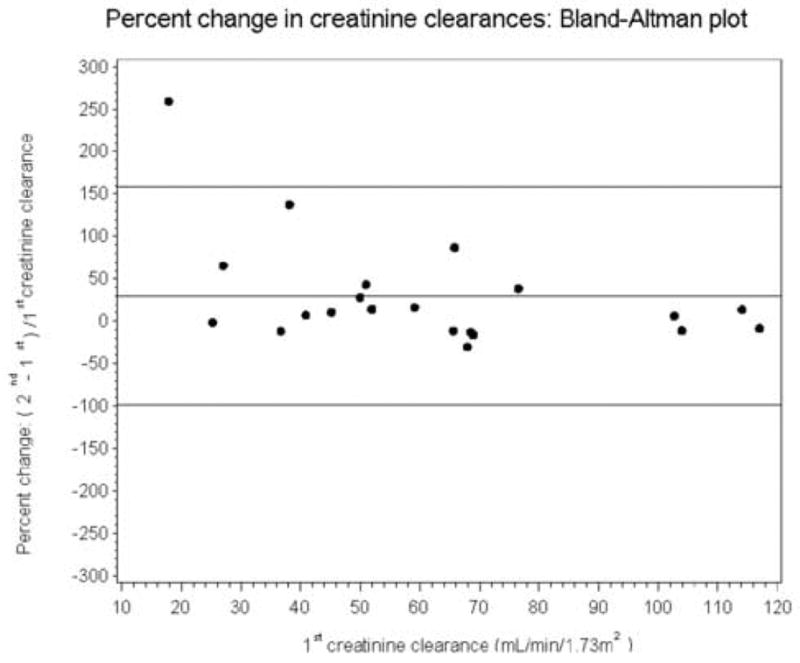
The mean values for the baseline and repeat creatinine clearances were 62 ± 29 versus 72 ± 30 mL/min/1.73 m2, respectively, and this difference was significant (p = 0.04). The slope of the regression line (0.76) was not significantly different from unity (p = 0.15); however, the intercept (25.1) was significantly different from zero, p = 0.04 (Fig 2A). The Pearson correlation was 0.729. Bland-Altman plots of the two creatinine clearance measurements (not presented) illustrate the bias which has a magnitude of 11.0 mL/min/1.73 m2. When the error was expressed as a percent of baseline (error/baseline value), the mean value was 29.0% (SD = 65.5 %), (Fig 2B). When the two outliers in Fig 2B were omitted, the mean percent error was still 12.2% (SD = 29.7%), much higher than the 1.04% mean error for the MAG3 clearance. Because of the large SD associated with the creatinine clearance measurements, even with the two outliers omitted, the creatinine clearance would have to change by 58.2% (1.96 times the SD of 29.7%) before the clinician could be confident that the change represented more than measurement variation. There was no difference in mean urine volume between the two studies, 1848 versus 1860 mL, respectively, p = 0.91
Figure 2A.

Linear regression showing the relationship between the two creatinine clearance measurements. The intercept of the regression line was 25.09, significantly different from zero, p =0.04; however, the slope of the regression line was 0.76, not significantly different from zero, p = 0.15.
Figure 2B.

Bland-Altman plot showing the error expressed as a percent of the baseline value [(baseline minus repeat measurement)/baseline value]; the mean percent error was 29.0% with a SD of 65.5%. Even when the two outliers are omitted, the mean percent error was still 12.2% with a SD of 29.7%. Consequently, even with the two outliers omitted, the change in the creatinine clearance would have to exceed 59.4% before the physician could be confident that the change was beyond the error of the measurement. The horizontal lines represent the mean error and 1.96 SD of the error.
COMMENT
A number of factors (muscle mass, diet, age, certain drugs, illness, tubular secretion) can affect the serum creatinine1,2. Nevertheless, because of convenience, serum creatinine is currently used to monitor renal function despite its potential variability and insensitivity in detecting and monitoring impaired renal function. The creatinine clearance provides a more accurate measure of renal function but repeated measurements of creatinine clearance in stable patients have been shown to have a disappointingly high 25% coefficient of variation (standard deviation/mean)15. Our study confirms that the creatinine clearance is not a reliable measurement (Fig 2B); even when the two outliers in Fig 2B are omitted, the creatinine clearance would still have to change by 58.2% before the clinician could be confident that the change represented more than measurement variation.
Surprisingly, the creatinine clearance was higher in the first study than in the second study. The patients were selected because they had stable renal function and were studied a mean of 11 days apart. Moreover, there was no significant difference in urine volumes, serum creatinines or MAG3 clearances between the first and second studies; consequently, changes in renal function or urine output are not likely to be explanations for this observation. The p value for the significance of the difference in the two sets of creatinine clearance measurements was only 0.04. There is no physiological reason for the observed bias and the difference would probably have disappeared with a larger series.
The reproducibility of the MAG3 clearance has been a focus of debate. Klingensmith et al16 used a gamma camera approach to express the clearance as the early renal uptake of MAG3 divided by the dose injected and found no significant difference between the first and second measurement (Klingensmith, personal communication). Clearance measurements based on one or more plasma samples are considered to have greater accuracy than camera based clearance measurements5; however, the reproducibility of MAG3 clearance measurements based on plasma samples have shown mixed results17–19. Clearances that rely on plasma samples have sources of error (timing of plasma samples, correction for radioactive decay, dilution of standards, pipetting errors) that are largely avoided by camera based techniques. Although camera-based techniques have their own sources of error, particularly background correction and correction for scatter, attenuation and renal depth9–10, these potential sources of error are relatively constant if the patient’s height and weight are stable. Consequently, although these sources of error may affect accuracy, they should have a minimal effect on reproducibility and reproducibility is the critical factor when patients are being monitored over time for deterioration or improvement in renal function. Moreover, very few nuclear medicine sites in the United States currently perform clearances that require plasma samples.
The standard Bland-Altman analysis is calculated as the difference between the first two measurements divided by the mean of the two measurements. The mean was chosen as the denominator since it provides the best estimate of the true value. While this approach provides a good measure of agreement, we believe it does not adequately address the clinical situation. The clinician needs to know if there is a change between the baseline and the repeat measurement. For this reason, we have presented our data looking at a change compared to the baseline clearance even though our approach mathematically results in larger error than the traditional Bland-Altman analysis because the difference is divided by baseline measurement rather than the mean of the baseline and repeat measurements (Figs 1B and 2B). Nevertheless, we found no significant difference between the first and second camera based MAG3 clearance measurements and the reproducibility was comparable or superior to results obtained by every study relying on plasma sample techniques17–20.
Even though the camera-based MAG3 clearance is much more reproducible than the creatinine clearance, is it reproducible enough to be acceptable for monitoring changes in renal function? The question is analogous to setting a cutoff point to determine sensitivity and specificity. The camera-based MAG3 clearance needs to change by 30.8% before the clinician can be confident that this change represents exceeds the error of measurement; a smaller percentage change could represent a real change in MAG3 clearance but the clinician would not have the same degree of confidence in the result. Clinical decisions will need to be based on all the patient data including changes in clearance. Importantly, this manuscript shows that the camera-based MAG3 clearance is much more reproducible than the creatinine clearance and it also defines limitations of the camera-based MAG3 clearance for monitoring renal function.
Camera based MAG3 clearances are available on most nuclear medicine camera/computer systems. The particular software program, QuantEMTM 2.0, used for this study is currently available on the General Electric Xpert computer system and an upgraded version will soon be available that could be used by other vendors. As with Klingensmith’s study14, in house and other commercial software programs for determining the MAG3 clearance should obtain similar results to those reported here as long as the vendor incorporates similar quality control features including a check for dose infiltration, avoiding potential dead time loses, automated peri-renal background regions of interest, and a standardized time zero that is constant between studies. The vendor should also provide citable validation studies to confirm that there have been no coding errors and that the software is performing as designed.
Conclusions
The camera-based MAG3 clearance is much more reproducible and shows a greater sensitivity to changes in renal function than the creatinine clearance and it is superior to the creatinine clearance for monitoring changes in renal function.
Acknowledgments
This work was partially supported by a grant from the National Library of Medicine, ROI LM 007595 and by a grant from Mallinckrodt, Inc.
Footnotes
Publisher's Disclaimer: This is a PDF file of an unedited manuscript that has been accepted for publication. As a service to our customers we are providing this early version of the manuscript. The manuscript will undergo copyediting, typesetting, and review of the resulting proof before it is published in its final citable form. Please note that during the production process errors may be discovered which could affect the content, and all legal disclaimers that apply to the journal pertain.
References
- 1.Levey AS, Madaio MP, Perrone RD. Laboratory assessment of renal disease: clearance, urinalysis and renal biopsy. In: Brenner BM, Rector FC Jr, editors. The Kidney. WB Saunders Company; Philadelphia, PA: 1991. pp. 919–937. [Google Scholar]
- 2.Manjunath G, Sarnak MJ, Levery AS. Estimating the glomerular filtration rate; Dos and don’ts for assessing kidney function. Postgraduate Medicine. 2001;110(6):55–62. doi: 10.3810/pgm.2001.12.1065. [DOI] [PubMed] [Google Scholar]
- 3.Eshima D, Taylor A., Jr Technetium-99m (99mTc) mercaptoacetyltriglycine: Update on the new 99m Tc renal tubular function agent. Semin Nucl Med. 1992;22:61–73. doi: 10.1016/s0001-2998(05)80082-0. [DOI] [PubMed] [Google Scholar]
- 4.Blaufox MD, Aurell M, Bubeck B, et al. Report of the radionuclides in nephrourology committee on renal clearance. J Nucl Med. 1996;37:1883–1890. [PubMed] [Google Scholar]
- 5.Russell CD, Dubovsky EV. Single-sample Tc-99m MAG3 renal clearance in the long-term management of patients with spinal cord injury. Nucl Med Communications. 1998;19:494–498. [Google Scholar]
- 6.Russell CD, Taylor AT, Dubovsky EV. Measurement of renal function with technetium-99m-MAG3 in children and adults. J Nucl Med. 1996;37:588–593. [PubMed] [Google Scholar]
- 7.Esteves FP, Taylor A, Manatunga A, et al. 99mTc-MAG3 renography: Normal values for camera-based MAG3 clearance, curve parameters, excretory parameters and residual urine volume. AJR. 2006 Dec;187 doi: 10.2214/AJR.05.1550. [DOI] [PubMed] [Google Scholar]
- 8.Esteves FP, Halkar RK, Issa M, et al. Evaluation of renal function: A comparison between camera-based MAG3 and 24-hour creatinine clearances. AJR. 2006;187:W1–W4. doi: 10.2214/AJR.05.1025. [DOI] [PubMed] [Google Scholar]
- 9.Taylor A, Corrigan PL, Galt J, et al. Measuring technetium-99m-MAG3 clearance with an improved camera-based method. J Nucl Med. 1995;36:1689–1695. [PubMed] [Google Scholar]
- 10.Taylor A, Manatunga A, Morton K, et al. Multicenter trial validation of a camera based method to measure Tc-99m mercaptoacetyltriglycine (MAG3) clearance. Radiology. 1997;204:47–54. doi: 10.1148/radiology.204.1.9205222. [DOI] [PubMed] [Google Scholar]
- 11.Itoh K, Nonomura K, Yamashita T, et al. Quantification of renal function with a count-based gamma method using technetium-99m-MAG3 in children. J Nucl Med. 1996;37:71–75. [PubMed] [Google Scholar]
- 12.Schlegel JU, Hamway SA. Individual renal plasma flow determination in 2 minutes. J Urol. 1976;116:282–285. doi: 10.1016/s0022-5347(17)58783-2. [DOI] [PubMed] [Google Scholar]
- 13.Gates GF. Glomerular filtration rate: estimation from fractional renal accumulation of Tc-99m DTPA (stannous) AJR. 1982;138:565–570. doi: 10.2214/ajr.138.3.565. [DOI] [PubMed] [Google Scholar]
- 14.Bland JM, Altman DG. Statistical methods for assessing agreement between two methods of clinical measurement. Lancet. 1986;1:307–310. [PubMed] [Google Scholar]
- 15.Brochner-Mortensen J, Rodbro P. Selection of routine method for determination of glomerular filtration rate in adult patients. Scand J Clin Lab Invest. 1976;36:35, 43. doi: 10.1080/00365517609068016. [DOI] [PubMed] [Google Scholar]
- 16.Klingensmith WC, Briggs DE, Smith WI. Technetium-99m-MAG3 renal studies:normal range and reproducibility of physiologic parameters as a function of age and sex. J Nucl Med. 1994;35:1612–1617. [PubMed] [Google Scholar]
- 17.Piepsz A, Tondeur M, Kinthaert J, et al. Reproducibility of technetium-99m mercaptoacetylglycine clearance. Eur J Nucl Med. 1988;23:195–198. doi: 10.1007/BF01731844. [DOI] [PubMed] [Google Scholar]
- 18.Kotzerke J, Glatz S, Grillenberger K, et al. Reproducibility of a single-sample method for 99Tcm-MAG3 clearance under clinical conditions. Nucl Med Commun. 1997;18:352–357. doi: 10.1097/00006231-199704000-00175. [DOI] [PubMed] [Google Scholar]
- 19.Kanazawa T, Shimizu M, Seto H, et al. Reproducibility of 99Tcm-MAG3 clearance in normal volunteers with the two-sample method: comparison with OIH. Nucl Med Commun. 1998;19:899–903. doi: 10.1097/00006231-199809000-00011. [DOI] [PubMed] [Google Scholar]
- 20.Werner E, Blasl C, Reiners C. Reproducibility of technetium-99m-MAG3 Clearance using the Bubeck method. J Nucl Med. 1998;39:1066–1069. [PubMed] [Google Scholar]


