Abstract
Aims/hypothesis
Autotaxin (ATX) is an adipocyte-secreted lysophospholipase D which expression is substantially up-regulated in obese-diabetic db/db-mice. The aim of the present study was to depict the physiopathological and cellular mechanisms involved in regulation of adipocyte-ATX expression.
Methods
ATX mRNAs were quantified in adipose tissue from db/db mice (obese and highly diabetic Type 2), gold-thioglucose-treated (GTG) mice (highly obese and moderately diabetic Type 2), high fat diet-fed (HFD) mice (obese and moderately diabetic Type 2), streptozotocin-treated (STREPTO) mice (thin and diabetic Type 1), and massively obese humans exhibiting glucose intolerance.
Results
When compared to non-obese controls, ATX expression was significantly increased in db/db mice, but not in GTG-, HFD-, or STREPTO-mice. During db/db-mice development, up-regulation of ATX occurred only 3 weeks after emergence of hyper-insulinemia, and was concomitant to emergence of hyperglycaemia. Adipocytes from db/db-mice exhibited strong impairment in insulin-stimulated glucose uptake when compared with non-obese and HFD-induced obese mice. ATX expression was up-regulated by treatment with TNFα (insulin resistance-promoting cytokine), and down-regulated by rosiglitazone treatment (insulin-sensitizing compound) in 3T3F442A adipocytes. Finally, adipose tissue-ATX expression was significantly up-regulated in patients exhibiting both insulin-resistance and impaired glucose tolerance.
Conclusions/interpretation
The present work demonstrates the existence of a db/db-specific up-regulation of adipocyte-ATX expression which could be related to severe Type 2 diabetes phenotype and adipocyte insulin-resistance, rather than excess adiposity per se. The present work also revealed that Type 2 diabetes in human is also associated with up-regulation of adipocyte-ATX expression.
Keywords: Adipocytes; enzymology; physiology; Animals; Autocrine Motility Factor; genetics; Biological Transport; Deoxyglucose; pharmacokinetics; Diabetes Mellitus, Experimental; enzymology; physiopathology; Diabetes Mellitus, Type 2; enzymology; physiopathology; Gene Expression Regulation; Gene Expression Regulation, Enzymologic; Glycoproteins; genetics; Humans; Insulin Resistance; physiology; Lipectomy; Mice; Mice, Inbred C57BL; Multienzyme Complexes; genetics; Obesity; physiopathology; Phosphodiesterase I; Phosphoric Diester Hydrolases; genetics; Pyrophosphatases
Introduction
In parallel to its implication in regulation of energy balance via its capacity to store excess lipid energy, adipose tissue is known to possess an important secretory function. It secretes several factors (leptin, adiponectin, TNFα, angiotensinogen, eicosanoids, lysophoshatidic acid,….), also called « adipokines » involved in the development of morbid complications of obesity such as cardiovascular diseases, hypertension, diabetes and cancer [1].
Our group has described the existence of a new « adipokine » : autotaxin (ATX) [2]. ATX is a soluble protein of 120 kDa belonging to the ecto-pyrophosphate pyrophosphatase phosphodiesterase (ENPP) family [3]. ATX catalyzes a lysophospholipase D-activity [4, 5, 2] leading to the hydrolysis of lysophosphatidylcholine (LPC) into lysophosphatidic acid (LPA), a bioactive phospholipid known to control several cellular events via activation of specific G-protein coupled receptors [6].
We demonstrated that expression of ATX was substantially up-regulated during adipocyte-differentiation in culture, as well as in adipocytes from obese-diabetic db/db mice when compared to non-obese mice [2]. These observations suggested a possible involvement of ATX in the normal or the pathological development of adipose tissue and/or pathologies associated with obesity.
In the present work, we analyzed ATX expression in adipose tissue from different mouse models exhibiting various degree of obesity and/or diabetes, as well as from massively obese human subjects. We concluded that adipocyte-ATX expression is not directly influenced by excess adiposity but is rather linked to impairment in glucose homeostasis and insulin-resistance of adipocytes.
Material and Methods
Animals
Mice were obtained from Charles River Laboratories (l’Arbresle, France) and were handled in accordance with the principles and guidelines established by the National Institute of Medical Research (INSERM). They were housed conventionally in an animal room with constant temperature (20–22°C), humidity (50–60%) and with a 12:12h light/dark cycle (lights on at 8:00 am). All mice had free access to food and water throughout the experiments. Obese db/db-mice were 5- to 12-weeks old C57B1KS/J db/db females fed daily with a standard rodent chow. Non-obese controls of db/db mice were C57B1KS/J +/+ mice of the same age and were fed with the same diet. Obese gold thioglucose (GTG)-mice were 13-weeks old FVB/n females which have received a single intraperitoneal injection (0.5g/kg) of gold thioglucose (GTG, Sigma, St Louis, MO) at 8-weeks of age and fed with a regular diet. Non-obese controls of GTG-mice were 13 weeks old FVB/n female mice fed with the same diet. Obese high fat diet (HFD)-mice were 13 weeks old C57B16/J females fed daily with a high fat diet (energy contents in % kcals: 20% protein, 35% carbohydrate and 45% fat) from 5-weeks of age. Non-obese controls of HFD-mice were 13 weeks old C57B16/J mice fed daily with a low fat diet (energy contents in % kcal: 20% protein, 70% carbohydrate and 15% fat). Standardized diets were from UAR, France.
For streptozotocin treatment, 8 weeks old C57B16/J mice received 4 daily intraperitoneal injection of 70 mg/kg steptozotocin and were sacrified 4 weeks later.
Sacrifice was performed on non-fasting animal. The blood was collected on heparin and glucose was immediately measured with a glucose meter. Plasma concentration of insulin was determined with an RIA kit (Diagnostics Pasteur, Paris, France). Adipose tissue was dissected out and weighed before separating the adipocytes from the stroma-vascular fraction (see below).
Isolation of adipocytes and stroma-vascular cells of adipose tissue
Adipose tissue was minced and incubated in 5 ml of Dulbecco’s modified Eagle’s medium (DMEM, Gibco, Invitrogen, Paisley, UK) supplemented with 1 mg/ml collagenase and 1% BSA for 30 min at 37 °C under shaking. Digested tissue was filtrated through a 150-μm screen and centrifuged at 900 g for 5 minutes in order to get adipocytes in the floating fraction, and stroma-vascular cells (preadipocytes, endothelial cells and macrophages) in the pellet.
Deoxyglucose transport in isolated adipocytes
Deoxyglucose transport was measured as previously described [7]. Isolated adipocytes were incubated in the presence or not of 100 nM insulin for 45 min at 37 °C in a final volume of 400 μl Then, 2-deoxy-D-[ 3H]-glucose (2-DG, 0.4 μCi) was added at a final concentration of 0.1 mM for 10 min. Assays were stopped with 100 μl of 100 μM cytochalasin B and aliquots of the cell suspension were centrifuged in microtubes containing diisononyl phtalate (density 0.974 g/ml), to separate adipocytes from the buffer and count the intracellular [3H]2-DG.
Human samples
Subcutaneous adipose tissue
Human subcutaneous adipose tissue samples were obtained from patients undergoing abdominal dermolipectomy for plastic surgery. No clinical data from these patients were available.
Intra-abdominal adipose tissue
We have investigated 23 patients before a bariatric surgery. In order to limit any confounding effect, we excluded patients with evidence of chronic or inflammatory diseases. Twenty cm3 of intra-abdominal adipose tissue were obtained perioperatively at the level of the omentum. Tissue samples were immediately frozen in liquid nitrogen.
Blood glucose was measured by the glucose oxidase method (Beckman Instruments Inc, Fullerton, CA). Plasma Insulin was determined by immunoassay (Insulin IMX. Abbott laboratories, Tokyo, Japan). The intra-assay coefficient of variation was 4% and the inter-assay coefficient was 6%. Cross reactivity with proinsulin was 0.05%. HDL-cholesterol was measured after precipitation of apo B-containing lipoproteins using sodium phosphotungstate/magnesium chloride (Boehringer Mannheim, FRG). Total cholesterol and triglycerides were measured with commercial kits (Boehringer, Mannheim, FRG) adapted to a Hitashi 911 analyzer (Japan). LDL-cholesterol was calculated according to Friedewald et al. [8]. Homeostasis model assessment (HOMA) was used to evaluate insulin sensitivity: HOMA = Fasting insulin (mU/ml) × fasting glucose (mM)/22.5.
HbA1c, determined in patients with known diabetes was determined as a percentage of the total haemoglobin following high performance liquid chromatography separation (Diamat, BioRad laboratories, Hercules, CA) (normal range: 4.5–6%).
Some patients were subjected to an oral glucose tolerance test (OGTT): overnight fasted subjects were given 75 g glucose in water solution, and plasma was sampled before intake and 30, 60, 90, and 120 minutes after, for determination of glucose and insulin.
The subjects of your study gave informed consent and investigations were carried out in accordance with the Declaration of Helsinki as revised in 2000 (http://www.wma.net/e/policy/b3.htm).
Cell lines
3T3F442A adipocytes were obtained as previously described [2]. Briefly, confluent 3T3F442A preadipocytes were cultured in a differentiating medium consisting in DMEM supplemented with 10% fetal calf serum plus 50 nM insulin. 3T3F442A adipocytes were used after 7 days culture. COS-7 monkey cells (ATCC) were grown in DMEM supplemented in 10% FCS and transfected with pcDNA3 (Invitrogen) or with pcDNA-mATX-FLAG [2], using DEAE dextran as previously reported [2].
RNA extraction and real time RT-PCR analysis
Total RNAs were extracted from adipose tissue, adipocytes or stroma-vascular cells using the RNeasy mini kit (Qiagen, GmbH, Hilden, Germany). Total RNA (1 μg) were reverse transcribed for 60 min at 37°C using Superscript II reverse transcriptase (Life Technology) in the presence of random hexamers. A minus RT reaction was performed in parallel to ensure the absence of genomic DNA contamination. Real time PCR was performed starting with 25 ng cDNA and 900 nM concentration of both sense and antisense oligonucleotides [mouse ATX: sense: 5′-GACCCTAAAGCCATTATTGCTAA-3′, antisense: 5′-GGGAAGGTGCTGTTTCATGT-3′; human ATX: sense: 5′-GGACCAACATCTCCGGATCTT-3′; antisense: 5′-GGAGGTCCAGCCTCTTGAAG-3′] in a final volume of 25 μl using the SYBR green TaqMan Universel PCR Master Mix (Applied Biosystem). Fluorescence was monitored and analyzed in a GeneAmp 7000 detection system instrument (Applied Biosystems). Analysis of the 18S ribosomal RNA was performed in parallel using the Ribosomal RNA control Taqman Assay Kit (Applied Biosystem) in order to normalize the gene expression. Results are expressed as following: 2(Ct18S-Ctgene) where Ct corresponds to the number of cycles needed to generate a fluorescent signal above a predefined threshold. Oligonucleotide primers were designed using the Primer Express software (Perkin Elmer Life Sciences).
Preparation of conditioned media
Adipose tissue explants were prepared subcutaneous adipose tissue as previously described [9]. Conditioned media were prepared by incubating 7 g of explants in 10 ml of serum-free DMEM for 7 hours at 37°C in a humidified atmosphere containing 7% CO2. Conditioned media from 3T3F442A-adipocytes, and from COS-7-cells were obtained by incubating the cells in 5 ml (for a 10 cm diameter plate) in serum-free DMEM for 7 hours at 37°C in a humidified atmosphere containing 7% CO2. Conditioned media were concentrated (about 50 fold) using an Amicon Ultra 10,000 (Millipore) and the presence of ATX protein was studied by western blot analysis as well as by measuring its lysophospholipase D activity.
Measurement of lysophospholipase D activity
Lysophospholipase D activity of ATX was measured by conversion of radiolabeled LPC into radiolabeled LPA as previously described [2]. A solution of [14C]palmitoyl-lysophosphatidylcholine (NEN, 2035 MBq/mmole) at 0.092 kBq/μl in DMEM supplemente d with 1% free fatty acid BSA was first prepared, and 20 μl of this solution was incubated with 500 μl thawed conditioned medium plus 1 μl of sodium orthovanadate 0.5 mM for 90 min at 37°C. At the end of the incubation period, phospholipids were extracted with 500 μl of 1-butanol, evaporated, spotted on a silica gel 60 TLC glass plate (Merck), and separated using CHC13/MeOH/NH4OH (60/35/8) as migration solvent. The thin layers were autoradiographed overnight at −80°C using a Biomax-MS film (Kodak) in order to localize radiolabelled LPA spots, which were scraped and counted with 3ml of scintillation cocktail.
Western blot analysis
Thirty μg of protein from concentrated conditioned medium were separated on a Gel Nu-PAGE 4–12% (In Vitrogen) and transferred on nitrocellulose membrane. The blot was pre-incubated for 1 hour at room temperature in TBS/Tween 0.05% containing 3% dry-milk, and overnight at 4°C in the same solution supplemented with 0.7 μg/ml ATX-antibody. After washing in PBS/Tween 0.05%, ATX was visualized by enhanced chemioluminescence detection system (ECL, Amersham Biosciences) using an anti rabbit-HRP antibody (SIGMA). ATX-antibody (the supplier is AGRO-BIO, La Ferté Saint Aubin, France) is a rabbit polyclonal antibody directed against the peptide ESCNSSEDESKWVE present in both human- (position 881–894) and mouse- (position 803–816) ATX.
Statistical analysis
Results are means ± SE. Student’s t-test was used to compare two groups of data. Correlations were analyzed using the non-parametric Spearman rank test. P<0.05 was considered significant.
Results
1/ Adipocyte-ATX expression is not up-regulated in mouse models of obesity other than db/db mice
In order to determine whether up-regulation of adipocyte-ATX expression in db/db mice could also occurred in other models of obesity, ATX mRNA levels were measured in adipocytes from GTG- and HFD-mice (see Material and Methods). The obesity of these mice was attested by a significantly higher fat pad weight when compared with their lean counterpart (Figure 1A). Mean body weight were 40, 39 and 29 g for db/db-, GTG-, and HFD-mice respectively. The highest fat pad weight values was found in GTG-mice (Figure 1A) (P<0.05 when compared with db/db-mice; P<0.05 when compared with HFD-mice). Fat pad weight from db/db-mice was not statistically different from that of HFD-mice (Figure 1A). As previously described [2] adipocyte-ATX mRNA levels were increased by about 4 fold in db/db-mice when compared to their lean counterparts (Figure 1B). In contrast no change in adipocyte- ATX mRNA levels were observed in GTG- and HFD-mice when compared to their respective non-obese controls (Figure 1B). Similar absence of ATX up-regulation was observedin adipose tissue from ob/ob mice (data not shown). In the three mouse-models, obesity was associated with a significant increase in plasma concentrations of glucose (Figure 1C) and insulin (Figure 1D). Hyperglycaemia was significantly higher in db/db-mice when compared with GTG-mice (P<0.05) and HFD-mice (P<0.05). Hyperinsulinemia was significantly higher in db/db-mice when compared with GTG-mice (P<0.01) and HFD-mice (P<.01. These data showed that: (i) despite an equivalent adiposity than db/db-mice, GTG- and HFD-mice did not exhibit up-regulation in adipocyte-ATX expression; (ii) db/db mice exhibited more pronounced diabetic symptoms (hyperglycaemia and hyperinsulinemia) than GTG- and HFD-mice. We concluded that the adiposity of db/db mice was not sufficient to regulate adipocyte-ATX. Consequently, up-regulation of adipocyte-ATX expression could rather be linked to the diabetic status of db/db mice.
Figure 1. Expression of adipocyte-ATX in different mouse models of obesity.
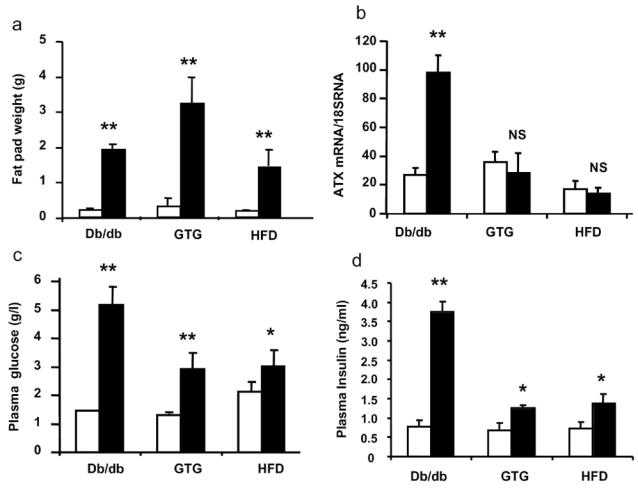
perigonadic fat pad weight (A), adipocyte-ATX mRNA levels (B) plasma concentrations of glucose (C) and plasma concentration of insulin (D) were measured from 12 week old db/db- (n=4), 13 week old high fat diet- (HFD) fed mice (n=3), and 13 week old gold thioglucose- (GTG) treated mice (n=4). Values obtained with these obese mice (black bars) were compared with those obtained with their non-obese counterpart (white bars) respectively: +/+ mice (n=4), low fat diet (LFD)-fed mice (n=3), and untreated mice (n=3). Values are means ± SE. Comparisons between obese and non-obese mice were performed using a Student’s t test: *: P<0.05; **: P<0.01.
2/ ATX is not up-regulated in streptozotocin-induced hyperglycaemic mice
In order to test whether hyperglycaemia per se could influence ATX expression, C57B16/J mice were treated with streptozotocin, a toxin inducing hypoinsulinemia by destructing the pancreatic β-cells. As shown in Figure 2A, streptozotocin treatment led to a strong an significant increase in plasma glucose concentration close to that observed in db/db-mice (see Figure 1B). Streptozotocin treatment was also associated with a significant reduction in fat pad weight (Figure 2B). In contrast, no modification in adipose tissue-ATX mRNA levels was observed (Figure 2C).
Figure 2. Influence of streptozotocin treatment on regulation of adipose tissue-ATX expression.
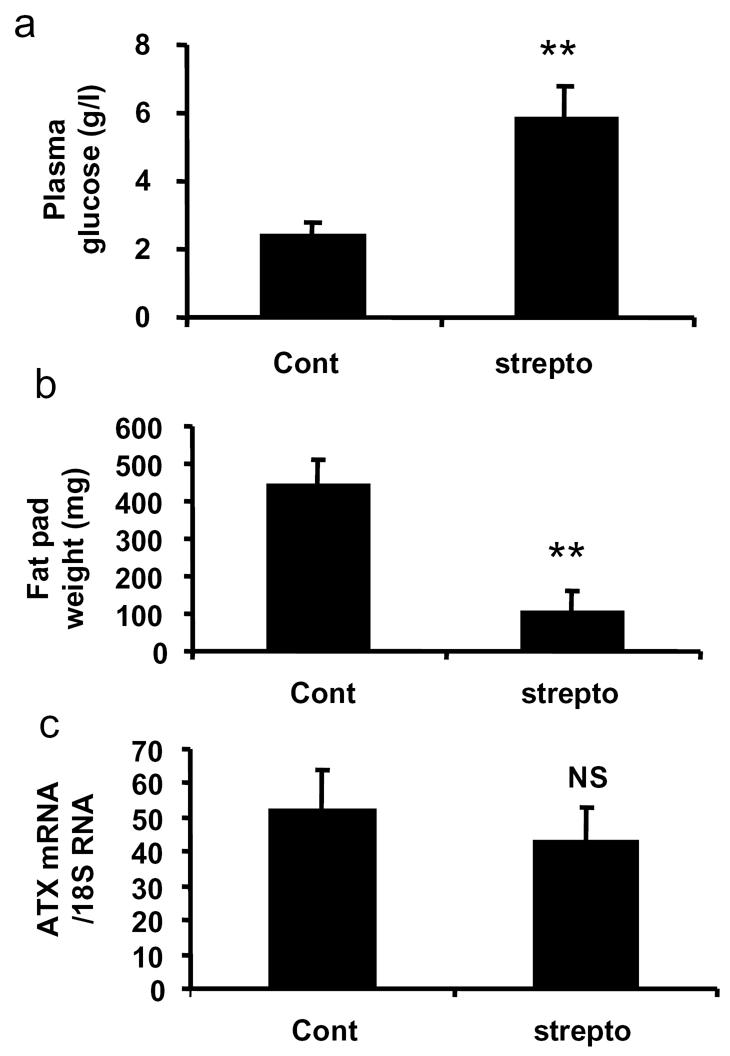
Plasma concentrations of glucose (A), perigonadic fat pad weight (B), and adipose tissue ATX mRNA levels (C) were measured in 12 week C57B16J mice treated (strepto) (n=4) or not (cont) (n=4) with streptozotocin as described in Material and Methods. Values are means ± SE. Comparisons between cont and strepto were performed using a Student’s t test: **: P<0.01.
These results showed that streptozotocin-induced hyperglycaemia had no influence on adipocyte-ATX expression, suggesting that hyperglycaemia per se was not sufficient to explain the up-regulation of adipocyte-ATX expression in db/db mice.
3/ Association between hyperglycaemia and up-regulation of adipocyte-ATX expression during the development of db/db mice
In order to get better insight into the mechanisms involved in up-regulation of adipocyte-ATX expression in db/db mice, adipocyte-ATX mRNA levels, the fat pad weight, and non-fasting plasma concentration of glucose and insulin were followed in 5 to 12 weeks old db/db and control mice (Figure 3). Whereas fat pad weight and insulin concentrations were already significantly higher in 5 weeks old db/db-mice than in control mice of the same age (Figure 3A and B), ATX mRNA levels and glucose concentrations became significantly elevated only at the 8th week (Figure 3C and D).
Figure 3. Expression of adipocyte-ATX during the growth of db/db mice.
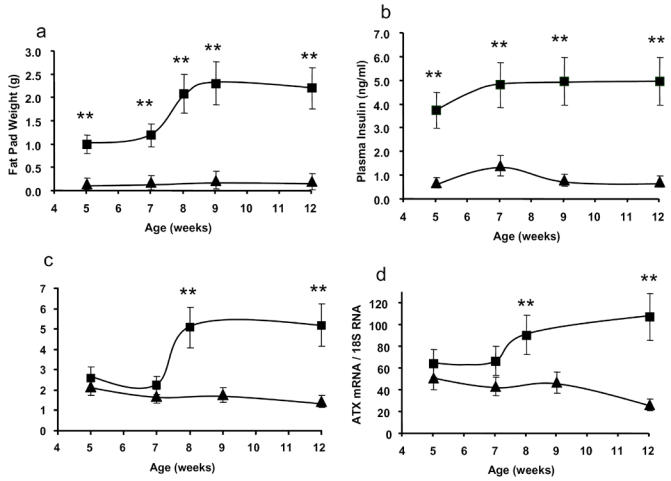
perigonadic fat pad weight (A), plasma concentration of insulin (B), plasma concentration of glucose (C), and adipocyte-ATX mRNA levels (D), were measured in db/db- (squares) and control- (triangles) mice sacrificed at different stage of their development (5 to 12 weeks). Values are means ± SE. Db/db and +/+ mice of the same age (except at age 8 weeks were db/db mice were compared with +/+ mice of 7 weeks) were performed using a Student’s t test: **: P<0.01.
These observations revealed that up-regulation of adipocyte-ATX expression was a rather late event during onset of obesity of db/db-mice, and was more closely associated with emergence hyperglycaemia than with fat-store accretion or hyperinsulinemia.
4/ Up-regulation of ATX in adipose tissue of db/db-mice is restricted to adipocytes
The adipose tissue contains adipocytes and stroma-vascular cells (mainly preadipocytes, endothelial cells, macrophages). ATX was previously found to be expressed in both adipocytes and stroma-vascular cells [2]. Adipocyte expression of ATX was found to be substantially increased in obese db/db mice when compared to adipocyte from non obese mice [2]. In order to determine whether such up-regulation of ATX-expression also occurred in stroma-vascular cells, inguinal (ING) and perigonadic (PG) adipose tissue from control and db/db mice were dissociated with collagenase and adipocytes were separated from the stroma-vascular cells. In control mice, and whatever the fat depot, ATX mRNA levels were not significantly different between adipocytes (Figure 4A) and stroma-vascular cells (Figure 4B). In db/db-mice, whereas adipocyte-ATX mRNA levels were significantly increased when compared with control mice (Figure 4A), no significant modification was observed in stroma-vascular cells in both inguinal and perigonadic fat depot (Figure 4B).
Figure 4. Expression of ATX in adipocytes and stroma-vascular cells from db/db mouse adipose tissues.
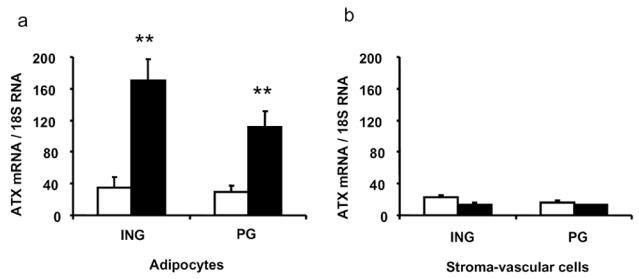
adipocytes and stroma-vascular cells were isolated from inguinal (ING) and perigonadic (PG) adipose tissue from 12 week db/db- (n=4) (black bars) or +/+-mice (n=4) (white bars), and ATX mRNA levels (/18 S RNAx 104) were analyzed by real time RT-PCR. Values are means ± SE. Comparisons between +/+ and db/db were performed using a Student’s t test: **: P<0.01.
These observations revealed that the up-regulation of ATX expression in adipose tissue of db/db-mice was restricted to adipocytes. We concluded to the possible existence of an adipocyte-specific mechanism of regulation of ATX gene expression.
5/ Adipocytes from db/db mice exhibit severe impairment in glucose uptake and insulin-sensitivity
Db/db mice are known to exhibit profound impairment in glucose homeostasis accompanied by a reduction in insulin responses in muscles, liver, adipose tissue [10]. Glucose up-take was measured in adipocytes from obese db/db and HFD-mice and compared with non-obese control mice of the same age. As shown in Figure 5, insulin treatment (100 nM) of adipocytes from non-obese and obese HFD-mice led to a strong increase (about 5 fold) in basal glucose uptake. In contrast, in adipocytes from db/db mice, insulin only led to 2.1 fold increase in basal glucose uptake: this correspond to a 2.4 fold reduction of the insulin response when compared control.
Figure 5. Stimulation of glucose uptake by insulin in adipocytes from db/db-mice adipocytes.
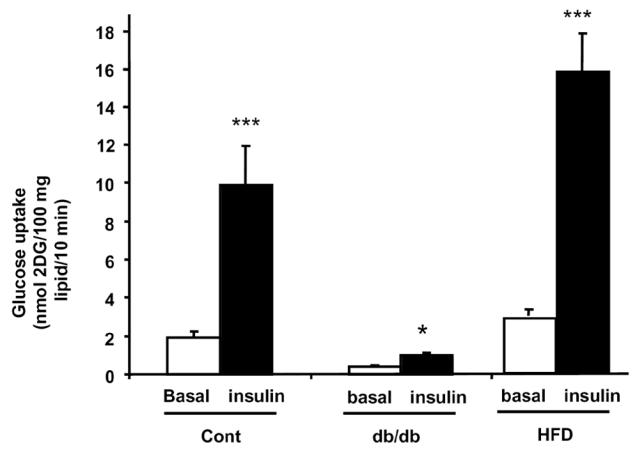
Adipocytes were isolated from non-obese (control) (n=4), db/db mice (n=4), or obese HFD-mice (n=4) and exposed (black bars) or not (white bars) to 100 nM insulin before measuring glucose uptake as described in Material and Methods. Values are means ± SE. Comparison between basal (white bars) and insulin-stimulated (black bars) glucose uptake were performed using a Student’s t test: *: P<0.05; ***: P<0.001.
These results indicated that db/db adipocytes exhibited severe impairment in glucose uptake and insulin-sensitivity.
6/ TNFα and rosiglitazone regulate ATX expression in 3T3F442A adipocytes
In order to test whether ATX expression could be directly dependent on adipocyte-glucose homeostasis and insulin sensitivity, mouse 3T3F442A adipocytes were treated with TNFα (a diabetogenic cytokine known to impair glucose utilization and insulin-sensitivity in adipocytes) or rosiglitazone (a PPARγ agonist known to improve adipocyte glucose utilization and insulin-sensitivity in adipocytes) [11]. When compared to untreated cells, 24h treatment with 10 ng/ml TNFα led to a significant increase (1.5 fold) in ATX mRNA level whereas treatment with 1 μM roziglitazone led to a strong and significant reduction (80 % reduction) in ATX mRNA level (Figure 6). Co-treatment with TNFα and rosiglitazone resulted in a lower reduction of ATX mRNA level than rosiglitazone alone (Figure 6).
Figure 6. Influence of TNFα and roziglitazone on ATX expression in 3T3F442A adipocytes.
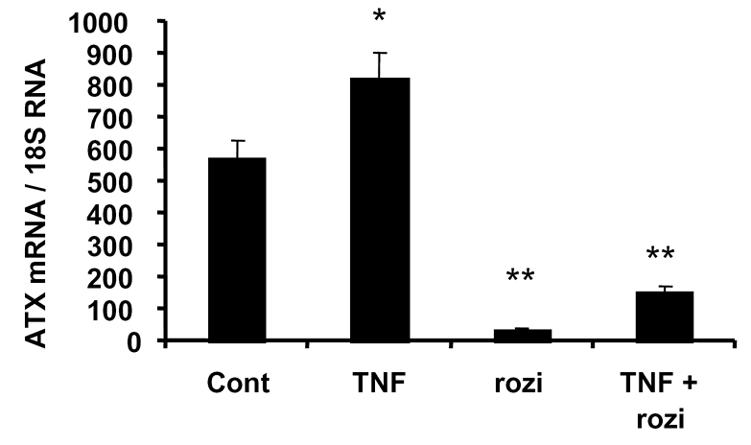
Seven days post-confluent 3T3F442A adipocytes were placed in serum-free DMEM and treated or not (cont) with TNFα (20 ng/ml) (TNF), or roziglitazone (1 μM) (rozi), or both (TNF + rozi). After 24 h treatment ATX mRNA levels were measured. Values are means ± SE of three separate experiments. Comparisons with cont were performed using a Student’s t test: *: P<0.05; **: P<0.01.
These results indicated that factors altering glucose utilization and insulin sensitivity in adipocytes, were also able to regulate adipocyte-ATX expression. These results suggested the possible involvement of adipocyte insulin sensitivity on adipocyte-ATX expression.
7/ Expression and secretion of ATX expression by human adipose tissue
In contrast to mouse adipose tissue [2], the expression and secretion of ATX by human adipose tissue had not yet been investigated. Secretion and expression of ATX were first investigated on fresh subcutaneous abdominal adipose tissue samples obtained from plastic surgery (see Material and Methods). ATX mRNA levels were found to be slightly but significantly higher in adipocytes than in stroma-vascular cells: ATX mRNA/18S RNA: 69 ± 13 for adipocytes (n=10); 35 ± 6 for stroma-vascular cells (n=9); P < 0.03.
The capacity of human adipose tissue to secrete ATX was tested by looking for the presence of the ATX protein and activity in conditioned media from small explants of subcutaneous adipose tissue (see Material and Methods). As a positive control for the presence of ATX, conditioned media prepared from 3T3F442A adipocytes and from cos-7 cells transfected with an expression vector encoding mouse ATX (2) were used. As shown in Figure 7A, incubation of [14C]lysophosphatidylcholine in conditioned media from human adipose tissue led to the formation of [14C]lysophosphatidic acid: this is characteristic of the lysophospholipase D activity of ATX [2]. ATX protein itself was also detected in the conditioned media by western blot analysis using a rabbit polyclonal antibody (see Material and Methods) directed against ATX protein (Figure 7B).
Figure 7. Secretion of ATX by human adipose tissue.
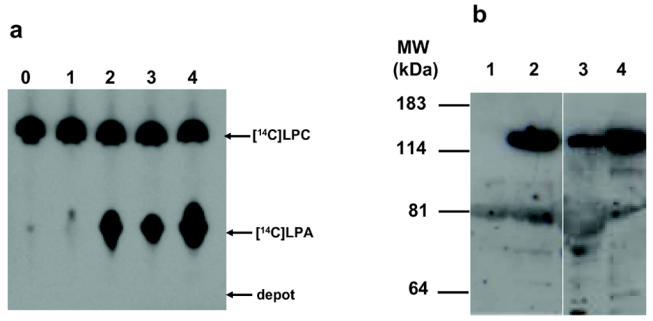
Conditioned media were prepared from cos-7 cells transfected with empty pcDNA vector (1), cos-7 cells transfected with pcDNA-mATX (2), human adipose tissue (3), and 3T3F442A adipocytes (4). Lane 0 correspond to culture medium background. (A) The presence of a lysophospholipase D activity was analysed by the formation of [14C]LPA after incubation of conditioned media with [14C]lysophosphatidylcholine as described in Material and Methods. (B) The presence of ATX protein in conditioned media was visualized by western blot using a polyclonal ATX-antibody as described in Material and Methods. Autoradiograms are representative of at least three separate experiments.
These results showed that human adipose tissue expresses and secretes ATX.
8/ Expression of ATX in adipose tissue from insulin-resistant patients
ATX mRNA levels were quantified in intra-abdominal adipose tissue from 23 women exhibiting massive obesity (mean BMI 48±1) justifying abdominal surgery (gastroplasty) (see Material and Methods). All the patients were hyperinsulinemic (mean plasma insulin concentration 21.7 ± 2 mU/1; expected normal values 5–6 mU/1), and insulin-resistant (mean HOMA values 5.26 ± 0.58; expected normal values 1–1.2).
Since adipose tissue samples were frozen immediately after surgery, isolation of adipocytes could not be performed and ATX expression was analyzed on whole tissue samples from each patient. ATX mRNAs were detected in all samples with ATX mRNA/18S RNA ration values ranging from 12 to 45.
According to the OMS criteria for diabetes diagnosis [12] three groups of patients could be distinguished:11 subjects (NGT group) had no diabetes mellitus (mean fasting glycaemia = 0.97 ± 0.02 mg/ml) and normal glucose tolerance (NGT) (mean glycaemia = 1.2 ± 0.1 mg/ml at the time 120 min of the OGTT); 4 subjects (IGT-group) had no diabetes mellitus (mean fasting glycaemia = 0.97 ± 0.02 mg/ml) but exhibited a statistically significant impairment in glucose tolerance (IGT) (mean glycaemia = 1.4 ± 1 mg/ml at the time 120 min of the OGTT) when compared with NGT-group (P<0.001); 8 subjects (D group) had a Type 2 diabetes mellitus (D) (mean fasting glycaemia = 1.7 ± 0.2 mg/ml and mean HbA1c = 7.4 ± 0.6%) and exhibited an impaired glucose tolerance (mean glycaemia = 2.08 ± 0.04 mg/ml at the time 120 min of the OGTT). Because of its relative glucose-intolerance and its limited number of subjects, the IGT-group was combined with the D-group (IGT-D group). NGT- and IGT-D-subjects exhibited no significant differences in BMI, plasma concentrations of insulin, HOMA values and AUC values of insulinemia (Table 1). IGT-D-group exhibited lower concentrations of plasma triglycerides and HDL than the NGT-group (Table 1).
Table 1.
Clinical parameters of NGT and IGT-D obese women
| NGT | IGT-D | ||||
|---|---|---|---|---|---|
| Clinical parameters | Mean ± SE | (n) | Mean ± SE | (n) | P< |
| Age (years) | 39 ± 4 | (11) | 43 ± 3 | (12) | ns |
| Body weight (kg) | 124 ± 5 | (11) | 124 ± 4 | (12) | ns |
| Body mass index (kg/m) | 47 ± 2 | (11) | 49 ± 2 | (12) | ns |
| Plasma glucose (g/l) | 0.94 ± 0.03 | (11) | 1.44 ± 0.18 | (12) | 0.008 |
| Plasma insulin (mU/l) | 21.3 ± 2.5 | (5) | 22.1 ± 2.8 | (6) | ns |
| HOMA | 5.14 ± 0.68 | (5) | 5.83 ± 1.23 | (6) | ns |
| HbA1c (%) | ND | 7.4 ± 0.6 | (8) | ||
| Plasma triglycerides (mg/dl) | 2.00 ± 0.24 | (11) | 1.17 ± 0.14 | (12) | 0.0049 |
| Plasma cholesterol (mg/dl) | 1.98 ± 0.08 | (11) | 1.84 ± 0.09 | (12) | ns |
| Plasma HDL (mg/dl) | 0.42 ± 0.03 | (8) | 0.50 ± 0.04 | (12) | 0.0368 |
| Plasma LDL (mg/dl) | 1.25 ± 0.07 | (8) | 1.12 ± 0.06 | (12) | ns |
| Oral Glucose Tolerance Test | |||||
| - AUC insulinemia | 15774 ± 2099 | (7) | 12288 ± 2345 | (6) | ns |
| - Glucose after 120 min | 1.2 ± 0.1 | (7) | 1.8 ± 0.1 | (6) | 0,001 |
Comparisons between the two groups were performed using a Student’s t test. ND: non-determined; ns: non significant.
Mean ATX mRNA value was significantly higher in IGT-D than in NGT group (Figure 8). No significant correlation could be established between ATX mRNA level and the different clinical parameters available except with plasma concentration of LDL (P<0.041: r=0.62) and the age of the subjects (P<0.048, r=0.59) in IGT-D group, not in the NGT group.
Figure 8. Expression of ATX in intra-abdominal adipose tissue from NGT and IGT-D obese subjects.
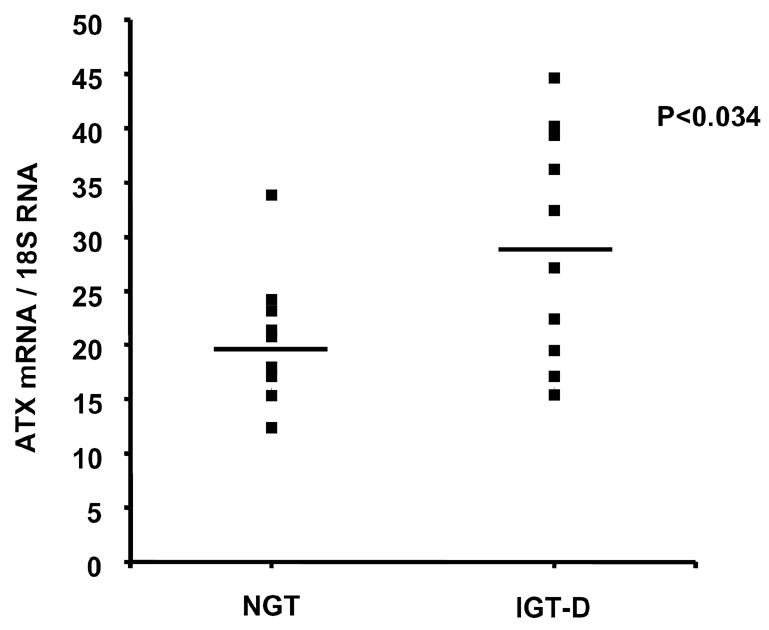
ATX mRNA levels were measured in whole adipose tissue from massively obese patients undergoing gastroplasty, and exhibiting non-diabetic or diabetic phenotypes (see Table 1). The figure represents individual values as well as mean ± SE (horizontal bars). Comparisons between the two groups were performed using a Student’s t test.
These results suggested the existence of a link between alteration in glucose homeostasis and ATX expression in human adipose tissue.
Discussion
We have previously demonstrated that ATX is a lysophospholipase D secreted by adipocytes and is responsible for the synthesis of LPA [2]. We also reported that ATX expression is up-regulated in obese-diabetic db/db mice when compared with non-obese mice [2] suggesting the involvement of adipocyte-ATX in obesity and/or diabetes.
The present study revealed that the up-regulation of adipocyte-ATX expression in db/db mice was not observed in other mice models of obesity (GTG-, HFD-), suggesting the existence of a “db/db-specific” mechanism involved in regulation of adipocyte-ATX expression.
Since GTG- and HFD-mice exhibited equivalent (HFD-mice) or higher (GTG-mice) adiposity than db/db-mice, we conclude that adiposity of db/db mice was not sufficient to explain up-regulation of adipocyte-ATX expression. Same conclusion could be drawn from the analysis of db/db mouse development showing that young db/db-mice (5 weeks of age) already exhibited excess adiposity when compared to control mice, but did not yet exhibit changes in ATX expression.
Obese db/db mice exhibited higher hyperinsulinemia and higher hyperglycaemia than obese GTG- or HFD-mice. Therefore, db/db-mice obviously exhibited strong impairment of glucose homeostasis. Consequently, db/db-specific up-regulation of adipocyte-ATX expression could be linked to the Type 2 diabetes phenotype of db/db mice. However, analysis of db/db mouse development showed that young (5 weeks) db/db mice already exhibit maximal hyperinsulinemia, whereas up-regulation of ATX expression occurred only at the 8th week. In addition, in streptozotocin-treated mice, hyperglycaemia reached a level comparable to that observed in db/db mice but no change in adipocyte-ATX expression was observed. We can therefore conclude that hyperinsulinemia or hyperglycaemia per se are not sufficient to up-regulate ATX expression, suggesting the involvement of an addition regulating factor.
As previously described [2] and confirmed in the present study, ATX was not only expressed in adipocytes, but also in stroma-vascular cells of adipose tissue. However, conversely to adipocytes, ATX-expression was not modified in stroma-vascular cells from db/db mice when compared with control mice. These observations suggest the existence of an adipocyte-specific mechanism involved in the regulation of ATX expression in db/db mouse.
The present work shows that adipocytes from db/db mice exhibited a strong impairment in insulin sensitivity as demonstrated by the reduction in insulin-stimulated glucose uptake when compared with non-obese and HFD-induced obese mice. Since insulin-resistance is known to greatly influence gene expression in adipocytes [11], it is likely that insulin-resistance of db/db adipocytes could play a role in up-regulation of ATX gene expression. This hypothesis was supported by the direct positive effect of TNFα (an insulin-resistance promoting cytokine), and the negative regulatory effect of rosiglitazone (a PPARγ agonist, well known for its ability to improve insulin-sensitivity) of ATX-expression in 3T3F442A adipocytes.
Finally, the present study shows that ATX expression is higher in patients exhibiting a reduced tolerance to glucose or a diabetes mellitus (IGT-D) when compared to patients exhibiting normal glucose tolerance (NGT). This observation suggests that, like in db/db mice, human ATX expression could be influenced by alterations in glucose homeostasis. Human adipose tissue ATX expression was not correlated with BMI, nor plasma glucose, nor plasma insulin, indicating that, like in db/db mice, these parameters are not sufficient to explain up-regulation of ATX expression in IGT-D subjects.
Based upon values of plasma insulin concentration and HOMA values there was no apparent difference in insulin-sensitivity between NGT and IGT-D subjects. This could indicate that, conversely to db/db-mice, insulin-resistance was not responsible for regulation of ATX in human adipose tissue. However, these clinical parameters characterizes only global insulin sensitivity and do not inform about insulin-sensitivity of adipocytes. Complementary experiments will be necessary to evaluate adipocyte insulin-sensitivity in NGT and IGT-D subjects. In parallel, other factors could also be involved in up-regulation of ATX in IGT-D patients. We indeed observed a significant correlation between ATX expression and the age as well as the plasma concentrations of LDL-cholesterol. In addition, IGT-D subjects exhibited lower plasma of triglyceride and HDL-cholesterol. These observations suggest a possible involvement of circulating cholesterol and/or duration of Type 2 diabetes pathology in the regulation of ATX expression. This hypothesis is supported by previous report showing an increase of lysophospholipase D-activity in hypercholesterolemic rabbits [13].
In conclusion, the present work revealed the existence of a db/db-specific up-regulation of adipocyte-ATX expression which is independent from excessive adiposity per se but could rather be linked to severe Type 2 diabetes phenotype and adipocyte insulin-resistance. In parallel, up-regulation of ATX expression in adipose tissue of patients exhibiting Type 2 diabetes, suggest the possible implication of ATXin human pathology.
Abbreviations
- ATX
autotaxin
- BSA
bovine serum albumin
- 2-DG
2-deoxy-glucose
- DMEM
Dulbecco's modified Eagle's medium
- ENPP
ectonucleotide pyrophosphatase phosphodiesterase
- FCS
fetal calf serum
- GTG
goldthioglucose
- HFD
high fat diet
- LPA
lysophosphatidic acid
- Hb
hemoglobin
- HOMA
Homeostasis model assessment
- IGT-D
impaired glucose tolerance-diabetic
- LPC
lysophosphatidylcholine
- NGT
normal glucose-tolerance
- OGTT
oral glucose tolerance test
- PPAR
peroxisome proliferator activating receptor
- RIA
radio immuno assay
- RT-PCR
reverse transcript-polymerase chain reaction
- STREPTO
streptozotocin
- TNF
tumor necrosis factor
References
- 1.Jazet IM, Pijl H, Meinders AE. Adipose tissue as an endocrine organ: impact on insulin resistance. Neth J Med. 2003;61:194–212. [PubMed] [Google Scholar]
- 2.Ferry G, Tellier E, Try A, Grès S, Naime I, Simon M, Rodriguez M, Boucher J, Tack I, Gesta S, Chomarat P, Dieu M, Raes M, Galizzi J, Valet P, Boutin J, Saulnier-Blache JS. Autotaxin is released from adipocytes, catalyses lysophosphatidic acid synthesis, and activates preadipocyte proliferation: up-regulated expression with adipocyte differentiation and obesity. J Biol Chem. 2003;278:18162–18169. doi: 10.1074/jbc.M301158200. [DOI] [PMC free article] [PubMed] [Google Scholar]
- 3.Goding JW, Grobben B, Slegers H. Physiological and pathophysiological functions of the ecto-nucleotide pyrophosphatase/phosphodiesterase family. Biochim Biophys Acta. 2003;1638:1–19. doi: 10.1016/s0925-4439(03)00058-9. [DOI] [PubMed] [Google Scholar]
- 4.Umezu-Goto M, Kishi Y, Taira A, Hama K, Dohmae N, Takio K, Yamori T, Mills GB, Inoue K, Aoki J, Arai H. Autotaxin has lysophospholipase D activity leading to tumor cell growth and motility by lysophosphatidic acid production. J Cell Biol. 2002;158:227–33. doi: 10.1083/jcb.200204026. [DOI] [PMC free article] [PubMed] [Google Scholar]
- 5.Tokumura A, Majima E, Kariya Y, Tominaga K, Kogure K, Yasuda K, Fukuzawa K. Identification of Human Plasma Lysophospholipase D, a Lysophosphatidic Acid-producing Enzyme, as Autotaxin, a Multifunctional Phosphodiesterase. J Biol Chem. 2002;277:39436–42. doi: 10.1074/jbc.M205623200. [DOI] [PubMed] [Google Scholar]
- 6.Luquain C, Sciorra VA, Morris AJ. Lysophosphatidic acid signaling: how a small lipid does big things. Trends Biochem Sci. 2003;28:377–83. doi: 10.1016/S0968-0004(03)00139-7. [DOI] [PubMed] [Google Scholar]
- 7.Morin N, Lizcano JM, Fontana E, Marti L, Smih F, Rouet P, Prevot D, Zorzano A, Unzeta M, Carpene C. Semicarbazide-sensitive amine oxidase substrates stimulate glucose transport and inhibit lipolysis in human adipocytes. J Pharmacol Exp Ther. 2001;297:563–72. [PubMed] [Google Scholar]
- 8.Friedewald WT, Levy RI, Fredrickson DS. Estimation of the concentration of low-density lipoprotein cholesterol in plasma, without use of the preparative ultracentrifuge. Clin Chem. 1972;18:499–502. [PubMed] [Google Scholar]
- 9.Gesta S, Simon M, Rey A, Sibrac D, Girard A, Lafontan M, Valet P, Saulnier-Blache JS. Secretion of a lysophospholipase D activity by adipocytes: involvement in lysophosphatidic acid synthesis. J Lipid Res. 2002;43:904–910. [PMC free article] [PubMed] [Google Scholar]
- 10.Shafrir E. Animal models of non-insulin-dependent diabetes. Diabetes Metab Rev. 1992;8:179–208. doi: 10.1002/dmr.5610080302. [DOI] [PubMed] [Google Scholar]
- 11.Ruan H, Lodish HF. Insulin resistance in adipose tissue: direct and indirect effects of tumor necrosis factor-alpha. Cytokine Growth Factor Rev. 2003;14:447–55. doi: 10.1016/s1359-6101(03)00052-2. [DOI] [PubMed] [Google Scholar]
- 12.Report of the expert commitee on the diagnosis and classification of diabetes mellitus. Diabetes Care. 1997;20:1183–97. doi: 10.2337/diacare.20.7.1183. [DOI] [PubMed] [Google Scholar]
- 13.Tokumura A, Kanaya Y, Kitahara M, Miyake M, Yoshioka Y, Fukuzawa K. Increased formation of lysophosphatidic acids by lysophospholipase D in serum of hypercholesterolemic rabbits. J Lipid Res. 2002;43:307–15. [PubMed] [Google Scholar]


