

Abstract
Previous work has shown that phonetic difficulty affects older, but not younger, speakers who stutter and that older speakers experience more difficulty on content words than function words. The relationship between stuttering rate and a recently-developed index of phonetic complexity (IPC, Jakielski, 1998) was examined in this study separately for function and content words for speakers in 6-11, 11 plus-18 and 18 plus age groups. The hypothesis that stuttering rate on the content words of older speakers, but not younger speakers, would be related to the IPC score was supported. It is argued that the similarity between results using the IPC scores with a previous analysis that looked at late emerging consonants, consonant strings and multiple syllables (also conducted on function and content words separately), validates the former instrument. In further analyses, the factors that are most likely to lead to stuttering in English and their order of importance were established. The order found was consonant by manner, consonant by place, word length and contiguous consonant clusters. As the effects of phonetic difficulty are evident in teenage and adulthood, at least some of the factors may have an acquired influence on stuttering (rather than an innate universal basis, as the theory behind Jakielski's work suggests). This may be established in future work by doing cross-linguistic comparisons to see which factors operate universally. Disfluency on function words in early childhood appears to be responsive to factors other than phonetic complexity.
A number of linguistic factors are known to increase the likelihood that a speaker who stutters will experience difficulty. Early work examined the sentence position, the phone a word starts with, word length and word type (Brown, 1945). Later studies have also looked at the relationship of utterance length, sentence structure, clause structure and phrase structure with stuttering (Logan, 2001; Silverman & Bernstein Ratner, 1997; Yaruss, 1999). Other linguistic factors which have received less attention include word frequency (Hubbard & Prins, 1994) and word stress (Wingate, 2002).
The role of phonetic factors as determinants of stuttering has also been investigated. Throneburg, Yairi and Paden (1994) used a scheme for the characterization of the phonetic difficulty of speech material. They classified words spoken by pre-school children who stutter into different categories according to whether they contained (1) developmentally Late Emerging Consonants (LEC; Sander, 1972) which are /r,l,s,z,ʤ,v,ʧ,h,θ,ð,ʃ,ʒ/, (2) Consonant strings (CS) and (3) whether the word contained Multiple-syllables (MS). Factors 1) and 2) could occupy any position within the word. None of the three factors occurred significantly more often in stuttered words than non-stuttered words. Howell and Au-Yeung (1995) confirmed this finding in a wider age range of children who stutter (2 to 12 year olds). In addition, Howell, Au-Yeung and Sackin (2000) reanalyzed their earlier data separately for function and content words, extended the age range out to adults who stutter and looked at effects of CS and LEC at different positions in words. Function words are pronouns, articles, prepositions, conjunctions and auxiliary verbs and content words are nouns, main verbs, adverbs, and adjectives (Hartmann & Stork, 1972; Quirk, Greenbaum, Leech & Svartvik, 1985). No effects of phonetic difficulty were found for any age group for function words. Content words that had LEC and CS in initial position in a word had a higher probability of being stuttered for children aged between 12 and 18 and adult speakers who stutter, but not in children younger than 12.
A more comprehensive scheme was developed by Jakielski (1998) who termed it the Index of Phonetic Complexity (IPC). IPC is based on MacNeilage and Davis's (1990) perspective about children's language development that has been used for analysis of stuttered speech (Weiss & Jakielski, 2001). The findings of MacNeilage and Davis (1990) indicate that motor constraints influence early speech development in predictable ways (the factors in the IPC metric are summarized in Table 1 which identifies what values of each factor mark a word as being difficult). They observed regularities in the features of babbling that could be characterized on consonants and vowels and, the vowels that occur frequently (are easy to produce), were mainly monophthongal and diphthongal (factor 4), the last syllable tended to be open (factor 5) and the “words” were comparatively short (factor 6). Note that vowel by class (factor 4) distinguishes monophthongs and diphthongs from rhotic vowels and speakers of British English rarely use rhotic forms.
Table 1.
IPC scoring scheme.
| Factor | No Score | One point each |
|---|---|---|
| 1. Consonant by Place | Labials, coronals, glottals | Dorsals |
| 2. Consonant by Manner | Stops, nasals, glides | Fricatives, affricates, liquids |
| 3. Singleton Consonants by Place |
Reduplicated | Variegated |
| 4. Vowel by Class | Monophthongs, diphthongs |
Rhotics |
| 5. Word shape | Ends with a vowel | Ends with a consonant |
| 6. Word Length (Syllables) |
Monosyllables, disyllables | >=3 syllables |
| 7. Contiguous Consonants | No Clusters | Consonant Clusters |
| 8. Cluster by Place | Homorganic | Heterorganic |
Jakielski's (1998) thesis provided detailed support for the consonant properties in the IPC list based on phonetic analyses of the clusters young children produce. Dorsal place of articulation was used less frequently in young children than older ones (1). Cluster token segments commonly included stops nasals and glides (2). Singleton consonants (rather than clusters) were more frequently reproduced and in young children these were more frequently reduplicated with variegated consonants produced increasingly often as they got older (3). As children got older, they also tended to move from producing singletons to clusters (7) and clusters progressed from homorganic to heterorganic places (8).
To obtain a difficulty score for a word using IPC, each word is assessed with respect to the eight separate factors in Table 1. Every occurrence of each of the factors scores one point in a word when it is marked as difficult, otherwise that factor scores zero. A composite score for the word is then obtained by summing the points over all the constituent factors. Weiss and Jakielski (2001) analyzed structured and unstructured speech samples from 13 children who stuttered aged between 6 and 11 years according to this scheme. They conducted a number of analyses, none of which showed any relation between IPC and stuttering rate.
The IPC scheme includes all three phonetic factors originally used by Throneburg et al. (1994) and subsequently by Howell and Au-Yeung (1995). The consonant by manner factor in IPC (factor 2) is the same as the LEC factor except that /h/ and /f/ are added. The IPC contiguous consonant factor (factor 7) is identical to the CS factor. The IPC word length factor (factor 6) differs only slightly from MS. MS distinguishes between one and more than one syllable while IPC word length distinguishes between words with three or more syllables and those with just one or two syllables. As the CS/LEC/MS scheme is known to have a relationship to stuttering (Howell et al., 2000), similar effects would be expected when the IPC scheme is used with content words.
The IPC scheme has extra parameters and, for this reason, may provide a better specification than the CS/LEC/MS scheme. While Weiss and Jakielski's (2001) study failed to find a relationship between IPC and stuttering rate, a number of issues remain to be investigated. First, the IPC factors occur at lower rates on function, than on content words (this is documented in the study below). The relationship between IPC and stuttering rate is examined separately on function and content words. Second, the relationship between IPC and stuttering rate needs to be examined across age groups as Howell et al. (2000) reported influences of CS/LEC/MS from teenage on (Weiss & Jakielski, 2001 examined children less than 11 years). Bloodstein and Gantwerk (1967) Bloodstein and Grossman (1981) and Howell, Au-Yeung and Sackin (1999) reported that the frequency with which stuttering occurs on function versus content words changes with age (speakers from teenage on stutter more on content words whereas the reverse holds before teenage). This underlines the importance of examining lexical class and speakers' age together.
There are shortcomings in the IPC scheme when applied to predicting stuttering (see discussion). Foremost amongst these are 1) whether the extra factors in IPC have a relationship with stuttering, and 2) the factors are not tuned to take account of the known fact that onset properties are the focus of stuttering (Howell et al., 2000).
In this study, Jakielski's (1998) scheme was used in its original form to determine whether the extra factors improve prediction and to establish whether the scheme needs developing to look at word-onset influences. Vowel by class was retained as a factor even though, as noted, it occurs rarely in fluent speaker's of United Kingdom English. This was noted to occur (though infrequently) in a number of the speakers. It may be due to a low level of phonological disorder in these subjects which affected vowel pronunciation.
Method
Participants
Forty two participants were diagnosed as showing signs of stuttering by a speech pathologist in a clinic in the United Kingdom. None of these speakers had phonological problems that affected syllable structure. They had not received therapy for at least two years and none reported having had therapy intended to reduce disfluency on particular sounds. They were then independently diagnosed by a second speech pathologist as a person who stutters. All speakers have speech samples of over 100 words and have over 3% words stuttered in their speech samples. The participants were divided into three age groups. There were sixteen children in Group 1 (G1) aged between 6 and 11 (mean age 8.0 years, SD of 1.0), sixteen teenagers aged between 11+ and 18 (Group 2, G2, mean age 13.1 years, SD of 2.4) and ten adults aged 18 plus (Group 3, G3, mean age 26.9 years, SD of 6.2). Children less than six years of age were dropped from the youngest group (though they were included in Howell et al., 2000) to make the age groups more comparable with those of Weiss and Jakielski, 2001). The division at age eleven separates children who stutter predominantly on function words from those who shift to content words (Howell et al., 1999). A one-way ANOVA showed that there were no significant differences in stuttering rate between the three age groups. The mean stuttering rate for G1 is 11.02% (SD 8.11%), for G2 is 18.88% (SD 14.83%), and for G3 is 11.49% (SD 10.74%).
Number of words in each sample for each participant, disfluency rate, gender and age of individual participants are given in Table 2. The number of words stuttered in the sample is also given. The ratio of function words stuttered to the content words stuttered was obtained for each participant.
Table 2.
Details of speakers (numbered in column 1, Y1 stands for the youngest speaker in the child group G1, T1 for the youngest teenager in G2 and A1 for the youngest adult in G3 etc.), age (given in column 2 in years;months), gender (column 3), number of words in speech sample (column 4), percentage stuttering rate in the sample (column 5), and number of content words that are stuttered (column 6).
| Speaker | Age | Gen | Number of words |
Stuttering rate (%) | Number of words stuttered |
|---|---|---|---|---|---|
| Y1 | 6;9 | M | 324 | 15.12 | 49 |
| Y2 | 6;0 | M | 990 | 8.28 | 82 |
| Y3 | 9;6 | F | 267 | 6.73 | 18 |
| Y4 | 7;3 | M | 686 | 5.39 | 37 |
| Y5 | 8;0 | M | 755 | 3.18 | 7 |
| Y6 | 8;11 | F | 206 | 3.40 | 7 |
| Y7 | 9;0 | M | 656 | 6.25 | 41 |
| Y8 | 7;0 | M | 345 | 10.72 | 37 |
| Y9 | 8;9 | M | 431 | 5.10 | 22 |
| Y10 | 7;0 | M | 406 | 33.25 | 135 |
| Y11 | 8;0 | M | 251 | 22.71 | 57 |
| Y12 | 9;3 | M | 133 | 5.26 | 7 |
| Y13 | 8;0 | F | 342 | 9.36 | 32 |
| Y14 | 8;0 | F | 614 | 8.63 | 53 |
| Y15 | 8;0 | M | 221 | 17.65 | 39 |
| Y16 | 8;0 | M | 222 | 15.32 | 34 |
| Mean 11.02% | |||||
| SD 8.11% | |||||
| T1 | 11;3 | M | 1438 | 3.96 | 57 |
| T2 | 10;6 | M | 459 | 33.33 | 153 |
| T3 | 11;3 | M | 1251 | 11.59 | 145 |
| T4 | 12;0 | M | 617 | 3.79 | 23 |
| T5 | 11;0 | M | 300 | 17.50 | 52 |
| T6 | 11;1 | F | 448 | 26.66 | 120 |
| T7 | 12;1 | M | 966 | 17.18 | 166 |
| T8 | 10;3 | M | 337 | 21.96 | 74 |
| T9 | 11;3 | M | 374 | 27.01 | 101 |
| T10 | 16;8 | M | 440 | 4.32 | 19 |
| T11 | 14;5 | M | 448 | 8.71 | 39 |
| T12 | 13;11 | F | 163 | 41.72 | 68 |
| T13 | 14;2 | M | 102 | 6.58 | 7 |
| T14 | 17;1 | M | 158 | 18.35 | 29 |
| T15 | 15;7 | M | 445 | 4.94 | 22 |
| T16 | 16;11 | M | 158 | 54.43 | 86 |
| Mean 18.88% | |||||
| SD 14.83% | |||||
| A1 | 26;0 | M | 4488 | 13.86 | 622 |
| A2 | 25;0 | M | 2670 | 7.87 | 210 |
| A3 | 25;0 | M | 1706 | 5.16 | 88 |
| A4 | 28;0 | M | 976 | 10.14 | 99 |
| A5 | 35;0 | M | 924 | 15.37 | 142 |
| A6 | 24;0 | M | 3120 | 4.17 | 130 |
| A7 | 20;0 | M | 1728 | 9.43 | 163 |
| A8 | 40;0 | M | 1080 | 22.04 | 238 |
| A9 | 21;0 | M | 1481 | 11.34 | 168 |
| A10 | 25;0 | M | 723 | 15.49 | 112 |
| Mean 11.49% | |||||
| SD 10.74% | |||||
Recording and Transcription
The spontaneous speech recordings were made in a relaxed atmosphere and familiar topics for conversation were suggested to the participants. The kind of speech is termed “casual” in terms of Labov's (1978) stylistic continuum in linguistics. There was, then, comparability in the style of speech across age groups. The recordings were transcribed using a broad phonetic transcription in fluent regions and a narrow system in the region of stutterings. Stuttering types include segment, part-word, word and phrase repetitions, segmental and syllabic prolongations. Word type, function or content word, was marked on each word. A second transcriber re-transcribed eight recordings selected at random to obtain inter-judge reliability measures. 98% agreement on content/function word was obtained giving a kappa coefficient of .96 which is much higher than chance (Fleiss, 1971); 96% agreement on inter-judge fluency judgment was obtained on all words giving a kappa coefficient of .92. The IPC scores for the two transcribers were calculated for individual factors and also for the total IPC score. The percentage of agreement is high: Factor 1 (97.7%), Factor 2 (92.3%), Factor 3 (99.5%), factor 4 (99.0%), factor 5 (94.9%), factor 6 (98.0%), factor 7 (93.2%), factor 8 (97.2%) and for the eight factors IPC score (84.1%).
Results
Percentage of words having each of the IPC factors and distribution of words according to IPC scores
Some descriptive properties associated with the IPC factors are given in this section. First, mean percentages of words (over subjects) and standard deviation (in parentheses) that contained each of the eight IPC factors are given in Table 3. Results are shown separately for content and function words as well as over all words. The data are also given separately for each age group (indicated in the left-hand column). Inspection of the table suggests that there are marked differences in occurrence between a) IPC factors and b) function and content words, but c) there are comparatively small differences between age groups.
Table 3.
Mean percentage of words (over subjects) and standard deviation (in parentheses) that contained each of the eight IPC factors. Results are shown separately for content and function words as well as over all words. The data are shown separately for each age group (indicated in the left-hand column).
| English | |||||||||
|---|---|---|---|---|---|---|---|---|---|
| Age | Word | Factor1 | Factor2 | Factor3 | Factor4 | Factor5 | Factor6 | Factor7 | Factor8 |
| G1 | Content | 25.50% (5.50%) |
65.09% (6.61%) |
3.04% (1.62%) |
0.46% (0.78%) |
68.45% (8.30%) |
4.92% (1.50%) |
30.48% (6.37%) |
16.40% (4.30%) |
| Function | 4.89% (4.07%) |
40.74% (10.32%) |
0.72% (0.86%) |
0.56% (0.74%) |
56.07% (4.70%) |
0.71% (0.90%) |
14.41% (5.85%) |
1.37% (1.18%) |
|
| All words | 15.04% (3.03%) |
52.60% (5.55%) |
1.88% (1.09%) |
0.51% (0.49%) |
62.07% (4.55%) |
2.78% (0.84%) |
22.01% (4.29%) |
8.59% (1.95%) |
|
| G2 | Content | 31.30% (5.42%) |
66.59% (7.78%) |
4.74% (2.27%) |
0.25% (0.64%) |
72.44% (8.69%) |
7.76% (3.12%) |
31.74% (7.45%) |
17.00% (4.72%) |
| Function | 2.98% (2.11%) |
40.95% (8.15%) |
0.46% (0.63%) |
0.52% (1.17%) |
56.91% (6.74%) |
0.50% (0.99%) |
15.53% (4.54%) |
0.99% (0.84%) |
|
| All words | 16.35% (3.52%) |
53.20% (5.13%) |
2.45% (1.04%) |
0.42% (0.76%) |
64.22% (5.23%) |
3.97% (1.64%) |
23.07% (4.62%) |
8.54% (2.48%) |
|
| G3 | Content | 27.14% (3.44%) |
73.00% (4.97%) |
4.48% (1.58%) |
1.08% (0.51%) |
70.20% (3.48%) |
12.62% (4.15%) |
34.53% (3.89%) |
16.41% (2.81%) |
| Function | 3.40% (0.84%) |
41.90% (3.57%) |
0.53% (0.42%) |
1.28% (0.71%) |
55.86% (3.88%) |
0.72% (0.38%) |
8.29% (2.64%) |
1.90% (1.31%) |
|
| All words | 14.01% (1.21%) |
55.93% (3.24%) |
2.30% (0.68%) |
1.20% (0.54%) |
62.31% (2.70%) |
6.11% (1.98%) |
20.06% (2.69%) |
8.40% (1.73%) |
|
| All | Content | 28.10% (5.59%) |
67.54% (7.32%) |
4.03% (2.01%) |
0.53% (0.73%) |
70.39% (7.65%) |
7.84% (4.13%) |
31.92% (6.42%) |
16.63% (4.14%) |
| Function | 3.81% (2.93%) |
41.10% (8.14%) |
0.58% (0.64%) |
0.72% (0.96%) |
56.34% (5.31%) |
0.63% (0.84%) |
13.38% (5.49%) |
1.35% (1.13%) |
|
| All words | 15.29% (3.01%) |
53.62% (5.00%) |
2.20% (1.00%) |
0.64% (0.68%) |
62.94% (4.50%) |
4.03% (1.94%) |
21.95% (4.18%) |
8.52% (2.08%) |
|
For each participant, the IPC score of every word was obtained. A count of the number of words with each IPC score was then obtained and used to produce a frequency distribution over different IPC scores. The data were broken down next by word type (function/content) and mean IPC value obtained. A repeated-measures analysis of variance was conducted with factors word type and age group using mean IPC value as the dependent variable. The interaction between word type and age group was significant (F2, 39 = 6.029, p < .005). This effect arose because the IPC values of content words (but not function words) increased across age groups.
Validation of IPC scheme on Howell et al. (2000) data by replicating Weiss and Jakielski
Weiss and Jakielski's (2001) analysis was conducted on these data. The IPC score summed over all eight factors was calculated for each word of each participant. Words were then grouped into stuttered and non-stuttered classes and mean IPC value of each class obtained. Related t-tests were carried out for each age group. The difference between IPC scores on stuttered and non-stuttered words was not significant for the group with comparable ages to Weiss and Jakielski (G1, ages 6-11), n = 16, t = 0.53, p = .604. The same analysis on G2 yielded a significant difference (n = 16, t = 2.28, p = .038), and approached significance for G3 (n = 10, t = 1.94, p = .085). Individual scores are given in Table 4 for G1-3.
Table 4.
IPC score for all words.
| Age | Fluent | Stuttered | Age | Fluent | Stuttered | Age | Fluent | Stuttered |
|---|---|---|---|---|---|---|---|---|
| Y1 | 1.71 | 2.06* | T1 | 1.93 | 1.82 | A1 | 2.14 | 1.83 |
| Y2 | 2.15 | 2.73* | T2 | 1.75 | 2.16* | A2 | 1.81 | 1.58 |
| Y3 | 1.90 | 1.54 | T3 | 2.02 | 1.57 | A3 | 2.14 | 2.15* |
| Y4 | 1.83 | 2.32* | T4 | 1.88 | 2.47* | A4 | 1.94 | 2.25* |
| Y5 | 1.70 | 1.36 | T5 | 1.44 | 2.15* | A5 | 1.94 | 2.82* |
| Y6 | 2.06 | 1.82 | T6 | 1.47 | 2.43* | A6 | 1.78 | 1.86* |
| Y7 | 1.94 | 2.12* | T7 | 1.85 | 1.58 | A7 | 1.75 | 3.05* |
| Y8 | 1.71 | 1.29 | T8 | 1.95 | 1.84 | A8 | 1.85 | 2.85* |
| Y9 | 2.09 | 2.03 | T9 | 2.25 | 2.51* | A9 | 1.86 | 2.17* |
| Y10 | 1.99 | 2.35* | T10 | 2.18 | 2.03 | A10 | 1.96 | 1.97* |
| Y11 | 1.37 | 0.86 | T11 | 1.99 | 2.20* | |||
| Y12 | 1.42 | 1.38 | T12 | 1.84 | 3.55* | |||
| Y13 | 1.70 | 1.57 | T13 | 2.00 | 1.82 | |||
| Y14 | 1.85 | 2.38* | T14 | 1.88 | 2.07* | |||
| Y15 | 1.63 | 2.19* | T15 | 1.58 | 2.15* | |||
| Y16 | 1.50 | 1.36 | T16 | 1.77 | 2.47* |
(denotes higher IPC score for stuttered than fluent words)
In the introduction, content words were reasoned to be phonetically more complex than function words and this led to the conclusion that the two word classes should be analyzed separately. Related t-tests confirmed the difference in complexity as content words overall had higher average IPC scores than function words for each age group (G1, n = 16, t = 12.13, p < .001; G2, n = 16, t = 15.56, p < .001; G3, n = 10, t = 21.28, p < .001).
Given the difference in complexity of word types and the potentially different determinants of stuttering on these word types, the IPC values of stuttered and non-stuttered words were next analyzed separately for function and content words. Stuttered content words had higher IPC values for G2 (n = 16, t = 3.10, p = .007) and for G3 (n = 10, t = 4.99, p = .001) than fluent content words. No significant difference occurred for G1. The IPC values of stuttered and non-stuttered function words did not differ significantly for any of the three age groups.
Establishing what factors are operative in English
In the following set of analyses, all IPC factors were included. An IPC score for each word was obtained as the sum across the eight IPC factors. Analyses were done separately for age group (3) and word class as function or content (2) giving six analyses. The steps performed on the data of each subject were as follows:
The words were sorted into different categories using their IPC score.
Stuttering rate was calculated by obtaining the number of stuttered words in each IPC score-category and dividing by the total number of words in the same category.
Difference in stuttering rate over IPC scores was determined by analysis of covariance (ANCOVA). These were carried out with the stuttering rate for each category as the dependent variable, the IPC score as the independent variable and the stuttering rate for the individual speaker as the covariate (this was used as covariate to take out differences between participants in stuttering rate). The analysis was intended to establish where stuttering rate differed between IPC-score categories. Pearson product-moment correlations of stuttering rate over IPC-score categories were also obtained. Each analysis was done separately on content and function words and for each age group.
Examination of the data after steps a) and b) showed that there were too few words for analysis for words with numerically high IPC scores, especially for the younger speakers. For G1 and G2, five IPC-score categories were used for words with IPC scores 0, 1, 2 and 3 and those over three (3+). Eight categories were used in G3 for words with IPC scores 0 through to 6 and an extra category of scores over six (6+). The ANCOVA showed stuttering rate differed significantly over IPC categories for G2, F(4, 63) = 7.64, p = .000, and for G3, F(7,71) = 3.31, p = .004 but not for G1. Post-hoc Tukey tests (alpha = .05) for G2 showed that the stuttering rates for IPC score 3+ was significantly higher than those for IPC score 2 and 0 and that IPC score of 3 was significantly higher than that for IPC score 0. Pearson's r = .9172, p = .028 over all IPC scores for G2. For G3, post-hoc Tukey tests (alpha = .05) showed that the stuttering rate for IPC scores 6 and 6+ were significantly higher than those of IPC score 0. Pearson's r = .9721, p < .001 over all IPC scores for this age group. The mean adjusted stuttering rates for content words for each individual age group, are plotted in Figure 1. These findings indicate a positive relationship between stuttering rate and IPC score for content words.
Figure 1.
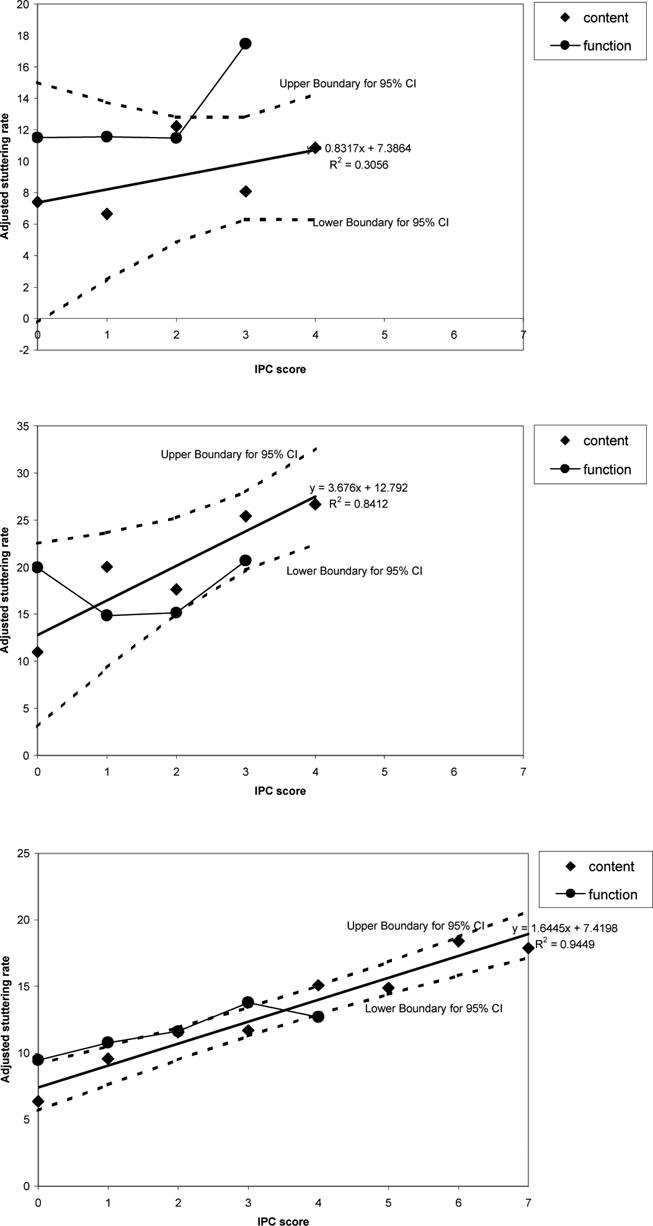
Adjusted stuttering rate (ordinate) versus IPC score (abscissa) for the eight-factor IPC analysis for each separate age group (G1, top, G2, middle, G3 bottom). Content (diamonds) and function (circle) words are indicated separately. The straight line is fitted to the content words and the upper and lower bounds around this line are indicated by the dashed line. The function word points are connected by a solid line.
In the analyses on the function words, four categories (IPC score 0, 1, 2 and 3+) were used for G1 and G2 and five IPC categories for G3 (IPC scores 0, 1, 2, 3 and 4+). Stuttering rate did not differ significantly over IPC categories for any of the three age groups.
Steps a)-c) were next conducted with one factor dropped from the calculation of the IPC-score in turn only for the content words (as in all remaining analyses) and the ANCOVA inspected to see how significance between pairs with different IPC values was affected. The fitting procedure is iterative and all iterations were ranked to establish which factor when removed had the greatest impact (reduced relationship between modified IPC and stuttering rate). The statistical parameter is used as an index of fit, not as repeats of a statistical test with the attendant problem of spurious significance arising. The logic behind the procedure is that if an IPC factor is important within the IPC scheme, the removal of it will affect the number of pairs that are significant. On the other hand, if a factor is redundant, the removal of it will not affect the predictive power of the scheme and if it works against the IPC-stuttering rate relation, may actually improve the number of significant differences between IPC pairs. Removing each of the eight IPC factors from G1 did not change any of the pairs across IPC categories to significance so the procedure was not applied further with this group.
Factors 1 (consonant by place), 2 (consonant by manner), 6 (word length) and 7 (consonant cluster) decreased the number of significant pairs (as indicated in the previous paragraph) for G2 and led to loss of significant effects in G3, indicating that these factors are important for predicting differences in stuttering rate across IPC-scores. Note that the last three of these factors are the ones that correspond roughly with LEC, MS and CS in Throneburg et al.'s (1994) scheme (see the introduction). Factors 3 (singleton consonant by place) and 4 (vowel by class) did not affect the statistical parameter and 5 (word shape) and 8 (cluster by place) increased the number of significant pairs. These indicate that 3 and 4 are redundant for English, and 5 and 8 hinder the predictive power of the IPC scheme (again note that this may be specific to English).
Steps a)-c) were conducted again using factors 1, 2, 6 and 7 along with one of these factors dropped in turn. The results were examined in the same manner as above to see how the fit was affected. The procedure was conducted this time for rank ordering of the four factors, not whether to include the factor or not as earlier. The procedure for establishing which is most important is that its removal should lead to the biggest reductions in significance and so on. The order of importance of the selected factors is 2, 1, 6 and 7 (consonant by manner, consonant by place, word length and consonant cluster).
The relation between stuttering rate and IPC-score was examined for the four factors (2, 1, 6 and 7) isolated in the same manner as done initially for all eight factors to see what this procedure did to the fit. Significance in ANCOVAs was obtained for G2 and G3. For G3, (F(5,53) = 3.55, p = .008). Post-hoc Tukey tests (alpha = .05) showed that words with IPC score 0 and 1 attracted significantly less stuttering than words with IPC scores of 5. For G2, (F(4,68) = 8.58, p = .000), post-hoc Tukey tests (alpha = .05) showed that words with IPC score 1 attracted significantly less stuttering than words with IPC score 3 and 3+ and words with IPC score 0 were stuttered significantly less than words with IPC score 2, 3 and 3+. In order to account for the differences in stuttering rate across subjects, the overall stuttering rate for each participant was taken out as a covariate. For G2, the Pearson product moment correlation coefficient between mean adjusted stuttering rate and the IPC score was r = .9667, p = .007. For G3, the same correlation coefficient was r = .9566, p = .003. The correlations have improved relative to when all factors were included for G2 and G3.
The relation between mean adjusted stuttering rate and IPC score for both content and function words are plotted in Figure 2 in the same manner as Figure 1 using IPC factors 1 (place), 2 (manner), 6 (word length) and 7 (consonant cluster) alone for all age groups (including G1). The 95% confidence limits are shown and confirm that the same relation may hold across function and content words, as found in the initial analysis (in G1 function words still tend to have a different relation to content words as found above).
Figure 2.
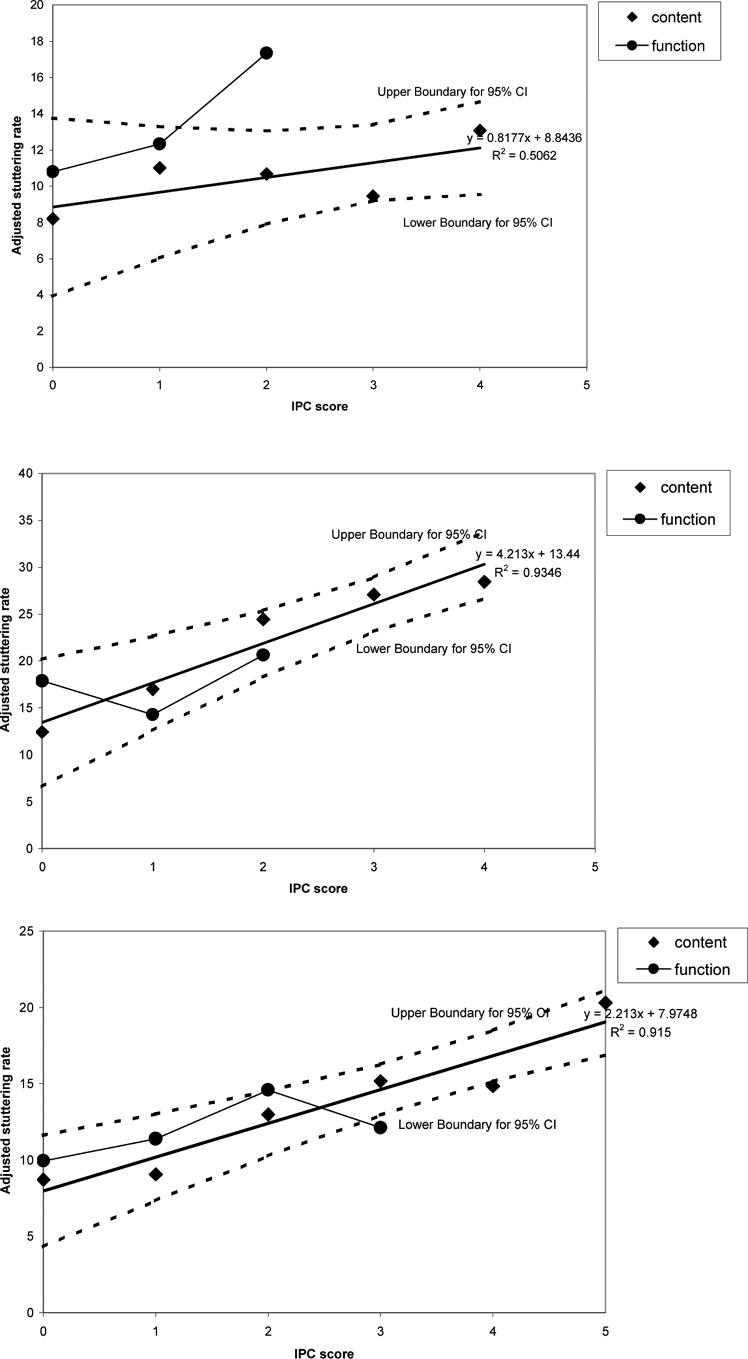
Adjusted stuttering rate (ordinate) versus IPC score (abscissa) for the four-factor IPC analysis for each separate age group (G1, top, G2, middle, G3 bottom). Content (diamonds) and function (circle) words are indicated separately. The straight line is fitted to the content words and the upper and lower bounds around this line are indicated by the dashed line. The function word points are connected by a solid line.
DISCUSSION
The main intention of this study was to see whether the results from the IPC technique correspond with previous findings about phonetic difficulty and stuttering. The IPC scores show that English function words are phonetically less complex than content words. The IPC scores for all stuttered words were not higher than those for fluent words for the young children who stutter. Since, as previously noted, IPC scores of function words were lower than content words, the fact that young speakers who stutter experience difficulty predominantly on function words explains why Weiss and Jakielski (2001) found no effect of IPC on stuttering rate for speakers in this age range. The IPC scores for all stuttered words was higher than fluent words for teenage speakers in G2 and approached significance (p=0.085) for adult speakers in G3. This relation between stuttering rate and IPC score was clarified further when function and content words were analyzed separately (see Table 4 and 5). The IPC scores on stuttered content words spoken by speakers in G2 and G3 were higher than their scores for fluent content words. No significant differences were found between fluent and stuttered function words for any of the three age groups.
Given the finding that stuttered content words had higher IPC scores than fluent content words for G2 and G3, further analysis showed that the higher the IPC score on a content word, the greater the chance the content word will be produced disfluently. In summary, these analyses validate the IPC scheme 1). By replicating Weiss and Jakielski's (2001) finding on young speakers who stutter. 2). By giving similar results to another phonetic scheme (Throneburg et al., 1994) previously employed on these data (Howell et al., 2000).
The second issue was to introduce an analysis that allows the order of importance of the IPC factors that lead to stuttering for English to be established. This was done by systematically omitting one factor at a time and examining how the reduced IPC scheme was affected by dropping that factor. Applying the same procedure with these factors alone allowed them to be put in relative order, which was 2 (consonant by manner), 1 (consonant by place), 6 (word length) and 7 (contiguous consonants). Three of the factors in the IPC scheme (7, 2 and 6) are broadly similar to CS, LEC and MS used by Throneburg et al. (1994) and these all appear in the set of core features along with the extra one, consonant by place. Consonant manner factor outweighed place, word length and contiguous consonants. This may suggest that manner is a good predictor of developmental aspects of motoric difficulty as suggested by Sander's (1972) work.
The Jakielski (1998) IPC metric was developed for assessing early phonetic development and the factors were rooted in babbling that would be expected to have universal characteristics (MacNeilage & Davis, 1990). The finding that this subset of IPC factors operate on content words in leading to stuttering in adulthood does not preclude either a universal role brought about by the language used in early development nor difficulty acquired by long use of a particular language. The universal role could operate through life but be disguised, in the case of speakers who stutter, by using function word repetition to avoid the disfluencies in early life. Alternatively, some or all of the factors could be an acquired influence and factors that do not operate in English (3, 4, 5 and 8 singleton consonant by place, vowel by class, word shape and cluster by place) might operate in other languages.
As the influence of phonetic difficulty has been found in adults, some modification of the IPC scheme away from its babbling origin would be appropriate when there are other improved metrics available for use with speakers of this age. This applies to factors 3 (singleton consonants by place) and 8 (cluster by place) both of which, as defined by Jakielski (1998) are rare in British English. Factor 3 (singleton consonants by place) concerns whether or not when consonants occur across syllable boundaries within a word (…VC-CV…), they have different places of articulation. Though the elimination analysis showed that this factor was not important, the scheme could be adapted to include more detailed transitions at boundaries involving consonant clusters on either side of the boundary (e.g. …VCC-CV, VC-CCV and VCC-CCV). This would give a better basis for investigating the cross-syllable boundary effect appropriate for older speakers. Factor 8 (consonant cluster by place) was also found not to be important but might be improved by using recent observations about development of consonant clusters in young children. McLeod, van Doorn and Reed (2001) reviewed the literature on consonant cluster development and found that there was a trend for clusters with stops such as /pl/ and /kw/ to be acquired before clusters with fricatives such as /st/. Both /pl/ and /kw/ are heterorganic while /st/ is homorganic. Consequently, factor 8, in contrast to the trend suggested in development, predicts that /st/ should be easier than /pl/ and /kw/. Smit (1993) gives a more detailed order of cluster acquisition based on data from Templin (1957) and Smit, Hand, Freilinger, Bernthal and Bird (1990). The order is: (1) stop+/w/, (2) C+/l/ clusters except /sl/, (3) C+/r/ clusters except /πr/, (4) /s/+C clusters, (5) /sl/ and /πr/, (6) /skw/ and finally (7) other three-element clusters. According to the IPC scheme a complex cluster such as /str/ is easy as it is homorganic (all three consonants are coronals) and this string is considered easier than /pl/ and /kw/. This suggests that the “consonant cluster by place” factor needs further development to index difficulty of consonant clusters, particularly for adult speakers.
More general improvements may also be required for application of IPC to stuttering: The current method for combining the eight factors within the IPC scheme proposed by Weiss and Jakielski (2001) assumes equal weighting for all the eight factors. When the factor-elimination process is applied, this gives an “all or nothing” approach. In reality, different factors have different degrees of importance. When the phonetic metrics have been refined, the different coding schemes (CS/LEC/MS and refined IPC metrics) need to be systematically compared, their scale properties and empirical interrelations analysed and some criteria for the preference of one over the other schema determined. Also, examination of some of the IPC factors (e.g. contiguous consonants) could be made when they are in onset position as Howell et al. (2000) did with the IPC scheme.
To summarize, the IPC scores proposed by Weiss and Jakielski (2001) can potentially be used to partly predict stuttering occurrence that arises out of planning difficulty in older speakers who stutter but not for young speakers. The current study makes a first step on assessing how the individual factors contribute to planning difficulty. Tests were conducted by assuming each factor contributes equally or does not contribute at all while, in practice, each factor may have different degrees of importance or loading in predicting stuttering occurrence. More work is needed to identify the different weightings the individual factors may have. Some of the factors need to be updated to take into account the level of phonetic difficulty revealed by research in language development with the intention of establishing how they could be applied to older speakers who have acquired language.
Acknowledgement
This work was supported by the Wellcome Trust and NIH R01 03810.
References
- Bloodstein O, Gantwerk BF. Grammatical function in relation to stuttering in young children. Journal of Speech and Hearing Research. 1967;10:786–789. doi: 10.1044/jshr.1004.786. [DOI] [PubMed] [Google Scholar]
- Bloodstein O, Grossman M. Early stutterings: Some aspects of their form and distribution. Journal of Speech and Hearing Research. 1981;24:298–302. [PubMed] [Google Scholar]
- Brown SF. The loci of stutterings in the speech sequence. Journal of Speech Disorders. 1945;10:181–192. [Google Scholar]
- Fleiss JL. Measuring nominal scale agreement among many raters. Psychological Bulletin. 1971;76:378–382. [Google Scholar]
- Hartmann RRK, Stork FC. Dictionary of language and linguistics. London: Applied Science Publishers; 1972. [Google Scholar]
- Howell P, Au-Yeung J. The association between stuttering, Brown factors, and phonological categories in child stutterers ranging in age between 2 and 12 years. Journal of Fluency Dosorders. 1995;20:331–344. [Google Scholar]
- Howell P, Au-Yeung J, Sackin S. Exchange of stuttering from function words to content words with age. Journal of Speech, Language and Hearing Research. 1999;42:345–354. doi: 10.1044/jslhr.4202.345. [DOI] [PMC free article] [PubMed] [Google Scholar]
- Howell P, Au-Yeung J, Sackin S. Internal structure of content words leading to lifespan differences in phonological difficulty in stuttering. Journal of Fluency Disorders. 2000;25:1–20. doi: 10.1016/s0094-730x(99)00025-x. [DOI] [PubMed] [Google Scholar]
- Hubbard CP, Prins D. Word familiarity, syllabic stress pattern, and stuttering. Journal of Speech and Hearing Research. 1994;37:564–571. doi: 10.1044/jshr.3703.564. [DOI] [PubMed] [Google Scholar]
- Jakielski KJ. Motor organization in the acquisition of consonant clusters. University of Texas at Austin: Ann Arbor Michigan; 1998. UMI Dissertation services. PhD thesis. [Google Scholar]
- Labov W. Sociolinguistic patterns. Oxford: Blackwell; 1978. [Google Scholar]
- Logan KJ. The effect of syntactic complexity upon the speech fluency of adolescents and adults who stutter. Journal of Fluency Disorders. 2001;26:85–106. [Google Scholar]
- MacNeilage P, Davis B. Acquisition of speech production: Frames, then content. In: Jeannorod M, editor. Attention and performance XIII: Motor representation and control. Hillsdale: Lawrence Erlbaum; 1990. [Google Scholar]
- McLeod S, van Doorn J, Reed VA. Normal acquisition of consonant clusters. American Journal of Speech-Language Pathology. 2001;10:99–110. [Google Scholar]
- Quirk R, Greenbaum S, Leech G, Svartvik J. A comprehensive grammar of the English language. London: Longman; 1985. [Google Scholar]
- Sander EK. When are speech sounds learned? Journal of Speech and Hearing Disorders. 1972;37:55–63. doi: 10.1044/jshd.3701.55. [DOI] [PubMed] [Google Scholar]
- Silverman S, Bernstein Ratner N. Syntactic complexity, fluency, and accuracy of sentence imitation in adolescents. Journal of Speech, Language, and Hearing Research. 1997;40:95–106. doi: 10.1044/jslhr.4001.95. [DOI] [PubMed] [Google Scholar]
- Smit AB. Phonologic error distributions in the Iowa-Nebraska Articulation Norms Project: Word-initial consonant clusters. Journal of Speech and Hearing Research. 1993;36:931–947. doi: 10.1044/jshr.3605.931. [DOI] [PubMed] [Google Scholar]
- Smit AB, Hand L, Frellinger JJ, Bernthal JE, Bird A. The Iowa Articulation Norms Project and its Nebraska replication. Journal of Speech and Hearing Disorders. 1990;55:779–798. doi: 10.1044/jshd.5504.779. [DOI] [PubMed] [Google Scholar]
- Templin MC. Certain language skills in children. Minneapolis: University of Minnesota, The Institute of Child Welfare; 1957. (Monograph Series No.26). [Google Scholar]
- Throneburg NR, Yairi E, Paden EP. The relation between phonological difficulty and the occurrence of disfluencies in the early stage of stuttering. Journal of Speech and Hearing Research. 1994;37:504–509. doi: 10.1044/jshr.3703.504. [DOI] [PubMed] [Google Scholar]
- Weiss AL, Jakielski KJ. Phonetic coMplexity measurement and prediction of children's disfluencies: A preliminary study. In: Maassen B, Hulstijn W, Kent R, Peters HFM, van Lieshout PHMM, editors. The 4th Nijmegen Conferences on Speech Motor Control and Stuttering; Nijmegen: Uitgeverij Vantilt; 2001. [Google Scholar]
- Wingate ME. Foundations of stuttering. San Diego CA: Academic Press; 2002. [Google Scholar]
- Yaruss JS. Utterance length, syntactic complexity, and childhood stuttering. Journal of Speech, Language and Hearing Research. 1999;42:329–344. doi: 10.1044/jslhr.4202.329. [DOI] [PubMed] [Google Scholar]