

Abstract
Arterial injury resulting from the interaction of contrast agent (CA) with ultrasound (US) was studied in rabbit auricular arteries and assessed by histopathologic evaluation and s-thrombomodulin concentrations. Three sites on each artery were exposed (2.8 MHz, 5-min exposure duration, 10-Hz pulse repetition frequency, 1.4-μs pulse duration) using one of three in situ peak rarefactional pressures (0.85, 3.9 or 9.5 MPa). Saline, saline/CA, and saline/US infusion groups (n = 28) did not have histopathologic damage. The saline/CA/US infusion group (n = 10) at exposure conditions below the FDA mechanical index limit of 1.9 did not have histopathologic damage, whereas the saline/CA/US infusion group (n = 9) at exposure conditions above the FDA limit did have damage (5 of 9 arteries). Lesions were characteristic of acute coagulative necrosis. Mean s-thrombomodulin concentrations, a marker for endothelial cell injury, were highest in rabbits exposed to US at 0.85 and 3.9 MPa, suggesting that vascular injury may be physiological and not accompanied by irreversible cellular injury.
Keywords: Animal model, Auricular arteries, Contrast agent, Endothelial cells, Microbubbles, Pathology, Pulsed ultrasound, Rabbit, Thrombomodulin, Ultrasound
INTRODUCTION
Introduction and literature
The American Heart Association reports that coronary heart disease is the single largest killer of Americans and that atherosclerosis is the single largest cause of coronary heart disease (American Heart Association 2005). Atherosclerotic coronary arterial obstruction can cause reduction or obstruction of coronary blood flow, leading to myocardial ischemia and infarction (Schoen 2005). Surviving this disease is dependent on early detection, diagnosis and treatment; thus, an estimated 1.2 million coronary angioplasties and 0.5 million bypass procedures were performed in 2002 in the USA and, in 2005, the direct and indirect costs of coronary heart disease were estimated at $142.1 billion (American Heart Association 2005). Thus, the medical and biomedical engineering communities have recognized that one factor that can contribute to reducing the death rate attributable to coronary heart disease is early detection and diagnosis (Asanuma et al. 2004; Bruce et al. 2004; Chen et al. 2004; Dawson et al. 2003; Takeuchi et al. 2004; Yip et al. 2003; Zhuang et al. 2004). To this end, microbubble ultrasound (US) echogenic contrast imaging agents (CAs) were approved by the US Food and Drug Administration (FDA) for use in cardiology in the USA health care market (Al-Mansour et al. 2000; Clark and Dittrich 2000; Cohen et al. 1998; Malhotra et al. 2000; Mulvagh et al. 2000).
Although not currently approved by the FDA for other applications, the ultimate benefit of microbubble US CAs to the patient may lie in their use by physicians as a means of noninvasive assessment of coronary heart disease. By specifically imaging coronary artery and microvascular (capillary) blood flow, myocardial structure, function and perfusion can be assessed and the presence and/or severity of coronary artery occlusion (stenosis) and the severity and extent of myocardial degeneration and replacement fibrosis after myocardial infarction determined. Microbubble US CAs are valuable diagnostic tools for physicians, but their use must be considered in the context of risk-benefit assessment for each patient. The medical significance of and long-term potential benefits from the use of CAs for diagnostic imaging are clear; however, concerns related to their “safe use” have been raised because of reports of CA-induced vascular injury.
Over the last 7 years, a variety of clinical and experimental studies have demonstrated an assortment of structural (vascular alterations) and functional (arrhythmogenesis) changes in the cardiovascular system resulting from the interactions of US with CAs in the vascular system. These vascular alterations included changes in permeability (i.e., leakage of Evans blue dye) and integrity (i.e., petechial hemorrhages), focal endothelial cell and myocyte loss and necrosis, inflammation and replacement fibrosis (Hwang et al. 2005; Li et al. 2004; Miller and Gies 1998, 2000; Miller et al. 2004, 2005; Miller and Quddus 2000; Skyba et al. 1998). Arrhythmogenic changes included premature ventricular contractions in healthy adult human beings during triggered second-harmonic imaging of a CA for myocardial perfusion (van Der Wouw et al. 2000); supraventricular tachycardia or nonsustained ventricular tachycardia in patients at risk for syncope, supraventricular tachycardia or ventricular tachycardia after IV administration of per-fluorocarbon-exposed sonicated dextrose albumin microbubbles (PESDA), exposure to therapeutic transthoracic low-frequency US (Chapman et al. 2005) and cardiac arrhythmogenesis in a rat model (Zachary et al. 2002). Cavitation has been suggested as the likely mechanism for microbubble-induced premature cardiac contractions (Dalecki et al. 2005).
The results from these studies have been used as indirect evidence to suggest that the interaction of US with CAs in the vascular system causes endothelial cell dysfunction and injury; however, the character and extent of the injury to the vascular endothelium has not been fully described. A lack of a clear understanding of the short- and long-term vascular bioeffects induced by the interaction of US with CAs could impact the regulatory process and impede the introduction of new microbubble US CAs into the health care market for needed medical benefit.
Currently, the medical significance and pathogenesis of such phenomena as applied to CA use in human beings are not clearly understood and, although no serious concerns were raised in the American Institute for Ultrasound in Medicine consensus statements (AIUM 2000a, 2000b, 2000c), it was advised that CA exposure conditions that minimize the potential for bioeffect occurrence should be used. However, the consensus statements did not provide guidelines as to what US exposure conditions would minimize the potential for bioeffect occurrence.
The purpose of this study was to: 1. characterize the histopathologic lesions and relative changes in s-thrombomodulin concentrations, a marker for endothelial cell injury, from rabbit auricular arteries (a medium-sized muscular artery model for the coronary artery) after the interaction of pulsed US with CA, and 2. provide, through the cytomorphologic characteristics of the lesions, insight into the mechanism of vascular injury associated with this interaction.
MATERIALS AND METHODS
Animals
The experimental protocol was approved by the Institutional Animal Care and Use Committee, University of Illinois, Urbana-Champaign and satisfied all University and United States National Institutes of Health rules for the humane use of laboratory animals. Rabbits were selected as the experimental animal because the anatomic and histologic structures of the auricular artery were reasonable models for the human coronary artery and provided a readily accessible superficial site for insonation of the artery.
New Zealand White rabbits (Myrtle’s Rabbitry, Thompson Station, TN, USA) were weighed (4.5 ± 0.6 kg, n = 47) and anesthetized with ketamine hydrochloride (50.0 mg/kg) and xylazine (10.0 mg/kg) administered subcutaneously. Anesthetized rabbits were placed in right lateral recumbency. Respiratory rates and peripheral vascular perfusion (ear skin color and mucous membrane color) were monitored visually. Experiments were conducted in a room maintained at 22 °C. To minimize body heat loss to adjacent tabletop, rabbits were placed on a thick insulating paper barrier.
The skin over the dorsal surface of the right auricular artery was exposed by removing hair with an electric clipper, followed by a depilatory agent (Nair®, Carter-Wallace, Inc., New York, NY, USA) to maximize sound transmission (Fig. 1a). Three black dots were placed on the skin (6, 7, and 8 cm from the tip of the ear) next to the right auricular artery to guide the positioning of the ultrasonic beam of the transducer (Fig. 1a, c). At each black dot, the auricular artery was exposed to pulsed US for 5 min, each exposure under the same conditions and infusion rate of CA (Table 1). A stand-off tank was positioned in contact with the depilated skin using mineral oil as a coupling agent (Fig. 1a, b). A transducer holder was visually centered on the auricular artery lateral to a black dot and the transducer was placed in the holder in the stand-off tank that contained highly degassed water at 30 °C (Fig. 1a, b). The ultrasonic beam axis was approximately perpendicular to the artery with the focal region of the beam within the lumen of the artery. An IV 23-gauge butterfly catheter was inserted into the lateral auricular vein of the left ear. This catheter was used to infuse CA continuously into the systemic circulation (Fig. 1c).
Fig. 1.
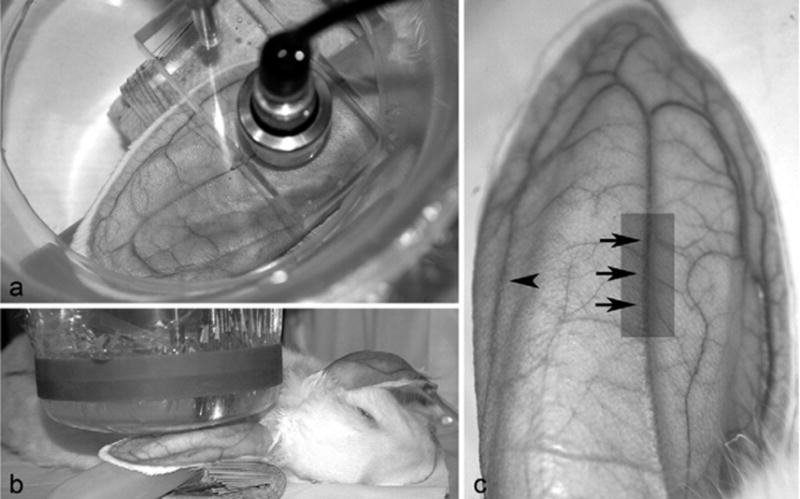
(a) After depilation, rabbit in right lateral recumbency; focused 19-mm diameter lithium niobate ultrasonic transducer aligned perpendicular to the artery. Transducer holder visually centered on auricular artery. (b) The ear supported by a fluid-filled balloon and stand-off vessel containing highly degassed water (30 °C) with membrane in direct contact with skin surface over the artery. A small quantity of mineral oil was used to ensure complete contact between membrane and skin. (c) Three black dots on the skin at the positions marked by the tips of arrows. A transducer holder (see Fig. 1a) was visually centered on the auricular artery lateral to each black dot and the transducer placed in the holder in the stand-off tank. At the arrowhead, but on the opposite ear (left), an IV 23-gauge catheter inserted into the left lateral auricular vein. After fixation of the entire ear, area highlighted by the gray rectangle was cut free from the ear and used for histopathologic evaluation.
Table 1.
Experimental design
| Number of rabbits in each treatment group
|
||||
|---|---|---|---|---|
| Peak rarefactional pressure | Saline alone | Saline with CA | Saline with US exposure | Saline with CA and US exposure |
| 0.23 MPa (MI = 0.11)* | 5 | 5 | NA | NA |
| 0.85 MPa (MI = 0.40) | NA | NA | 5 | 5 |
| 3.9 MPa (MI = 1.8) | NA | NA | 5 | 5 |
| 9.5 MPa (MI = 4.4)† | NA | NA | 8 | 9 |
NA = not applicable; MI = mechanical index.
Sham (negative) control for which exposure duration is approximately 30 s during the transducer alignment procedure. Following alignment, the ear was exposed without the US turned on.
Positive control.
During the alignment procedure, the low-power pulse-echo capability of the exposure system (RAM5000, Ritec, Inc., Warwick, RI, USA), displayed on a digital oscilloscope (LeCroy Model 9354CTM, Chestnut Ridge, NY, USA), was used to adjust the calibrated focal region center of the transducer on the auricular artery (the focal region length, the −6-dB pulse-echo depth of focus, was 2.7 mm; the full thickness of the ear was 2.1 ± 0.3 mm). The pulse repetition frequency (PRF) was 10 Hz. The US exposure levels reported for the sham (negative control) resulted from this alignment procedure, which took about 30 s to accomplish.
After insonation, rabbits were allowed to fully recover from anesthesia and then were returned to the animal housing unit. After 24 h, the rabbits were reanesthetized with ketamine hydrochloride and xylazine and 1.0-mL volume of serum was collected by arteriopuncture of the left auricular artery. Serum was stored at −20 °C until analyzed for s-thrombomodulin. Serum samples, satisfactory for s-thrombomodulin analysis, were obtained from nearly every rabbit used in this study; as a result, rabbit numbers listed in the tables do not always agree. Each rabbit was then euthanized with CO2. Immediately after euthanasia, the insonated ears were removed and fixed by immersion in 10% neutral-buffered formalin (pH 7.2) for histopathologic evaluation. The 24-h interval between US exposure and fixation of the ear was based on the need to provide a reasonable time for inflammation and thrombosis (Kumar et al. 2005) to occur in vivo in the auricular artery after the interaction of US and CA.
Experimental design
The experimental design is outlined in Table 1. All rabbits were randomly assigned to a group and were subjected to the same anesthesia and preparatory conditions. Rabbits that were infused with saline alone or CA and saline (both groups were not exposed to US) had their ears depilated and prepared the same as all other rabbits exposed to US. In addition, the ear from these rabbits (not exposed to US) was positioned under the stand-off vessel filled with highly degassed water that contained the transducer holder and transducer. The transducer was not turned on, but the “treatment” period was 30 min, an exposure duration identical to that of rabbits exposed to US.
Exposimetry
US exposure conditions and transducer calibration procedures used in this study were described previously (O’Brien et al. 2001a, 2001b; Zachary et al. 2001a, 2001b). In summary, a focused 19-mm diameter, lithium niobate ultrasonic transducer (Valpey Fisher, Hopkinton, MA, USA) was used to expose each auricular artery. The transducer was characterized and calibrated in degassed water (22 °C) according to established procedures (Zachary et al. 2001b; Raum and O’Brien 1997). The pulse-echo characterization procedure yielded a center frequency of 2.8 MHz, a fractional band width of 8%, a focal length of 20 mm, a −6-dB focal beam width of 470 μm, and a −6-dB depth of focus of 2.7 mm. The calibration procedure used a calibrated polyvinylidene difluoride (PVDF) hydrophone (Marconi Model Y-34-6543, Chelmsford, UK) and yielded an in vitro peak rarefactional pressure, an in vitro peak compressional pressure and a mechanical index (MI). The pulse duration was 1.4 μs. The 10-Hz PRF was used to allow some CA to infuse back into the US exposed region should the US exposure level exceed the CA collapse threshold. At a frequency of 2.8 MHz, the rupture pressure threshold for an isolated Optison™ microsphere is around 0.9 MPa (Ammi et al. 2006), a peak rarefactional pressure near the lowest pressure levels used herein.
The reported exposure conditions (Table 1) are those of the in vitro values because the loss of the propagated ultrasonic wave in tissue (between the ear surface and the vessel) is estimated to be less than 0.3 dB (i.e., negligible). This estimate assumes an attenuation coefficient of 3 dB/cm at 2.8 MHz (assumed to be similar to the attenuation coefficient of the chest wall (Teotico et al. 2001), along with the measured tissue thickness between the skin surface and the vessel wall (0.7 ± 0.2 mm).
Contrast agent
Optison™ (Amersham Health [GE Healthcare], Princeton, NJ, USA), a commercially available injectable microbubble US echogenic CA that consists of hollow microspheres of heat-denatured human albumin filled with perflutren, was used in this study. Optison™ was infused into the left lateral auricular vein of each rabbit during the 30 min “treatment” period to ensure that the exposure site in the right auricular artery was continuously refreshed with CA after interaction with US during exposure. Then, 3 mL of CA were added to a 100-mL bag of normal saline and gently mixed until adequately suspended. This gentle mixing was repeated every 2 min to maintain suspension of the CA in the saline. A variable drip line (15 drops/mL) was placed between the saline bag and the butterfly catheter (23-gauge). A drip rate of 1 drop per s was used, resulting in an infusion rate of approximately 4.0 mL/min. The mixture was maintained at room temperature during the 30-min infusion period.
Our approach was based on an infusion procedure described for use in human beings by Labovitz and Bierig (2003) from GE Healthcare. Other clinical studies that used a continuous infusion technique include Shimoni et al. (2002, 2003); Aggeli et al. (2002); Otani et al. (2004), and Dubart et al. (2004). Also, Miller et al. (1999) and Seidel et al. (2002) used an infusion technique similar to ours (Optison™ diluted in a NaCl bag); one of the authors of Miller et al. (1999) was the lead author of Podell et al. (1999), a paper that questioned the stability of Optison™ when added to (diluted in) normal saline. Also, in a recent study (Ammi et al. 2006) that quantified rupture thresholds of Optison™ in degassed water, the threshold results were consistent with numerical simulations using existing models for microbubble dynamics that considered the process of shell rupture, inertial cavitation and acoustic emissions; the Optison™ micro-bubbles were observed to remain intact throughout each of the approximately 1-h experimental durations via optical microscopy.
Pathologic evaluation
Insonated ears were fixed for a minimum of 5 days. Arteries were not fixed by vascular perfusion to minimize the loss of leukocytes adherent to the injured endothelium. The auricular artery was trimmed from the ear (see Fig. 1c), placed in a processing cassette, embedded in paraffin, interval (step) sectioned in a longitudinal plane parallel and 90° to the long axis of the artery at 3-μm thickness, mounted on glass slides and stained with hematoxylin and eosin (H&E) for routine microscopic evaluation. Step sections were taken at an interval of approximately 15 to 25 μm until sectioning was completed through the entire diameter of the artery. The Fraser–Lendrum method for fibrin was used to determine if fibrin was present in lesions (Luna 1992).
The entire auricular artery in each step section was evaluated for changes affecting endothelial cells (tunica intima), the internal elastic lamina and myocytes of the tunica media. In addition, the presence of leukocytes adherent to or associated with the endothelium or myocytes of the auricular artery was also noted. These changes included endothelial cell swelling and/or separation of endothelial cell junctions, necrosis of the endothelial cells of the tunica intima, necrosis of the internal elastic lamina and/or myocytes of the tunica media and the movement of adherent leukocytes into the tunica intima and media.
A score was assigned to each insonated auricular artery based on an evaluation of all step sections. A score of 0 indicated there were no abnormal changes in any structures in the auricular artery. A score of 1 indicated there were reactive changes in the endothelial cells that included cell swelling and/or alterations of spacing between cells. A score of 2 indicated there was damage to the auricular artery characterized by: 1. endothelial cell swelling and/or alterations of spacing between cells, 2. adhesion of leukocytes to the injured endothelium, and 3. degeneration and necrosis of endothelial cells and the underlying internal elastic lamina and myocytes of the tunica media.
The rabbit auricular artery is a medium-sized muscular artery and was used as a model for the coronary artery so that injury to vascular endothelium caused by the interaction of CA with US could be assessed. Although smaller in vessel and luminal diameters than human coronary arteries, the histomorphology of rabbit auricular arteries was similar to that of human coronary arteries. The right auricular artery vessel and luminal diameters were measured microscopically (n = 12) and were 405 ± 45 μm and 168 ± 21 μm in diameter, respectively. Because these arteries were fixed and processed, their luminal diameters would be expected to be smaller. In a supplementary experiment, an in vivo US B-mode image of a rabbit auricular artery performed at 40 and 65 MHz demonstrated that the artery measured between 500 to 700 μm in luminal diameter.
Rabbit s-thrombomodulin ELISA
Thrombomodulin is a recognized biomarker of endothelial injury. It is a cell surface glycoprotein that is primarily expressed in endothelial cells and, along with protein C, plays a role in counteracting thrombin-mediated coagulation after endothelial cell injury (Ejiri et al. 2001; Van de Wouwer et al. 2004). The thrombomodulin-thrombin complex activates protein C, which possesses anticoagulant properties (Van de Wouwer and Conway 2004). In addition to being membrane-bound, thrombomodulin also exists in soluble plasma form (s-thrombomodulin) and is a sensitive and specific indicator of endothelial cell damage (Boehme et al. 2002). After injury to endothelial cells, elevations of s-thrombomodulin are rapid and proportional to the extent of injury. Loss of membrane-bound thrombomodulin into the soluble pool is thought to be caused by mechanical disruption, neutrophil-derived proteases and by rhomboids, a family of intramembranous proteases (Lohi et al. 2004). Quantification of s-thrombomodulin has been previously used to measure endothelial damage from a variety of causes, including hypertension, atherosclerosis, percutaneous transluminal coronary angioplasty and vasculitis (Boffa and Karmochkine 1998; Chao et al. 2004; Dohi et al. 2003; Gando et al. 2004, 2005; Hjerkinn et al. 2005; Sakamaki et al. 2003).
A double-sandwich enzyme-linked immunoabsorbent assay (ELISA)1 for canine von Willebrand factor was modified to measure rabbit s-thrombomodulin (Benson et al. 1991, 1992). Immulon® 4 HBX high-binding microtiter plates (Thermo Labsystems, Franklin, MA, USA) were coated, at 1/500 dilution, with the IgG fraction of a mouse monoclonal antibody to human thrombomodulin that cross reacts with rabbit thrombomodulin (clone PBS-01, ab6980, Abcam Inc, Cambridge, MA, USA). A 1/1000 dilution of the purified IgG fraction of goat antirabbit thrombomodulin (product #236, American Diagnostica, Inc., Stamford, CT, USA) was used as the sandwich antibody. The detector antibody (horseradish peroxidase conjugated–swine antigoat IgG, AC13404, Biosource International, Camarillo, CA, USA) was preadsorbed with rabbit IgG (Sigma, St. Louis, MO, USA) to remove cross-reactivity to rabbit immunoglobulin and then diluted 1/4000 for use.
Purified rabbit thrombomodulin (1.9 mg/mL, RTM-2020, Haematologic Technologies Inc., Essex Junction, VT, USA) was used as the calibration standard. Rabbit thrombomodulin standards ranging from 2.5 to 100 ng/mL were prepared in ELISA dilution buffer. Serum samples were diluted 1:3 in the same buffer, 200 μL added to each well and reacted with capture antibody for 2 h at room temperature. Wells were washed 3 times with phosphate-buffered saline (PBS)-polysorbates (Tween) between all additions. The reaction times for the sandwich and detector antibodies were 1 and 0.5 h, respectively, at room temperature.
Standards and serum samples were assayed in triplicate and results reported as the mean of three determinations. Absorbance values were measured at 492 nm using an EL312 Microplate Reader (Bio-Tek Instruments Inc., Winooski, VT, USA) and data transformation and curve fitting (log-log, quadratic curve fit) were performed using provided software (KinetiCalc™ EIA Application Software version 2.12, Bio-Tek Instruments). The assay had a dynamic range of 2.5 to 100 ng/mL rabbit thrombomodulin with a lower limit of detection of 0.5 ng/mL. When untreated rabbit serum was spiked with purified rabbit thrombomodulin, recovery ranged from 82 to 98%.
RESULTS
Pathologic evaluation
The results from all rabbit treatment groups are shown in Table 2 and Figs. 2 to 4. Of all the rabbits in the negative control and experimental groups, only 5 of 9 rabbits in the highest experimental pressure group (high-pressure positive control group, 9.5 MPa) had histopathologic lesions that allowed them to be scored as damaged auricular arteries. A high-pressure positive control group was included in this study to ensure that auricular arteries could be histopathologically damaged and the cytomorphology of the lesions could be characterized and serve as the basis for assessing lesions in the experimental groups. Histopathologic lesions occurred within the focus of the transducer’s beam (beam width of 470 μm; depth of focus of 2.7 mm), with both the endothelial surface closest to and farthest away from the transducer being damaged. In 3 of the 5 damaged arteries, the most severe injury was on the side farthest away from the transducer.
Table 2.
Experimental results
| Number of rabbits with damaged auricular arteries
|
||||
|---|---|---|---|---|
| Peak rarefactional pressure (MI) | Saline alone | CA alone in saline | US alone with saline | CA in saline with US exposure |
| 0.23 MPa (0.11)* | 0 of 5 | 0 of 5 | NA | NA |
| 0.85 MPa (0.40) | NA | NA | 0 of 5 | 0 of 5 |
| 3.9 MPa (1.8) | NA | NA | 0 of 5 | 0 of 5 |
| 9.5 MPa (4.4)† | NA | NA | 0 of 8‡ | 5 of 9 |
NA = not applicable; MI = mechanical index.
Sham (negative) control for which exposure duration is approximately 30 s during the transducer alignment procedure. Following alignment, the ear was exposed without the US turned on.
Positive control.
One rabbit had leukocytes with cytomorphological features consistent with those seen in adherent leukocytes; however, they were not directly associated with a damaged artery.
Fig. 2.

Rabbit auricular arteries scored no change: (a) Normal endothelium, tunica intima, internal elastic lamina, and tunica media; (b) scored reactive change. Note swelling of endothelial cells (arrow). (c) Reactive change of endothelium with widening of the space between contiguous endothelial cells (arrow). (d) Auricular arteries scored damaged: Leukocyte adhesion (arrow). Note absence of endothelium, tunica intima and internal elastic lamina in the area where leukocytes are adhering. (e) Endothelium and tunica intima are a granular pink homogenous layer likely indicative of acute coagulative necrosis (arrow). Note the absence of this coagulated tissue layer on either side of areas marked by arrow. Internal elastic lamina is also pink and homogeneous, likely indicative of acute coagulative necrosis (arrowhead). Also note adherent leukocytes. (f) Necrotic tunica intima has lifted off of the internal elastic lamina (arrow). Note necrosis (swelling and nuclear pyknosis) of endothelial cells in tunica intima left of detached segment. Also note adherent leukocytes. (g) Tunica intima is absent and myocytes of the subjacent tunica media are necrotic (swelling and nuclear pyknosis) (arrow) and infiltrated by leukocytes (arrowhead). Similar myocyte lesions are present in (d), (e) and (f). All, H&E stain, scale bar = 50 μm.
Fig. 4.
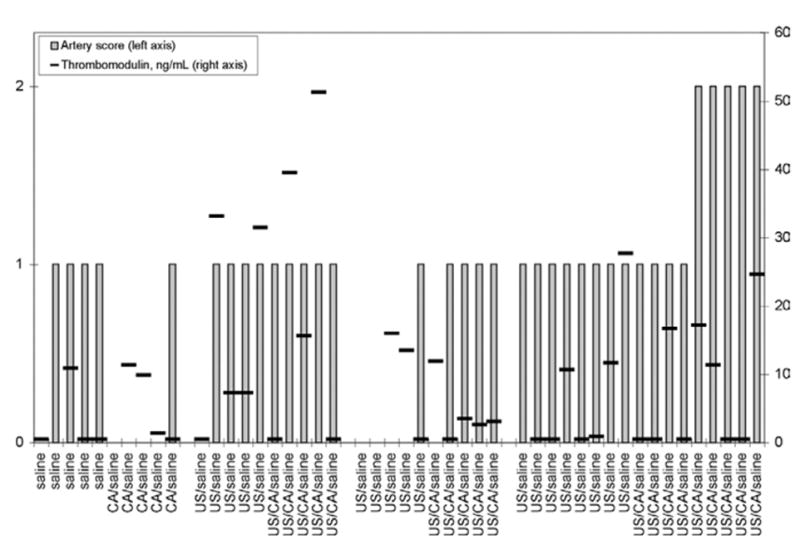
Exposure conditions and s-thrombomodulin concentrations in all rabbits. (Performed by Dr. J. L. Catalfamo at Comparative Coagulation Laboratory, Animal Health Diagnostic Center, Cornell University, Ithaca, NY.) Artery scores: 0 = no abnormal changes in any structures in auricular artery; 1 = reactive changes in endothelial cells, including cell swelling and/or alterations of spacing between cells; 2 = damage to auricular artery characterized by endothelial cell swelling and/or alterations of spacing between cells, adhesion of leukocytes to injured endothelium and degeneration and necrosis of endothelial cells and underlying internal elastic lamina and myocytes of the tunica media.
An auricular artery scored as normal in this study is illustrated in Fig. 2a. The cytomorphological characteristics of damaged auricular arteries included alterations of spacing between cells (Figs. 2b, c); endothelial cell detachment from the basement membrane (Fig. 2c); cytoplasmic swelling and nuclear pyknosis, karyorrhexis and hyalinization and dissolution affecting individual and clusters of endothelial cells (Fig. 2d to g); acute coagulative necrosis of the tunica intima (Fig. 2e, f); acute coagulative necrosis of the internal elastic lamina (Fig. 2e); detachment and loss of both the tunica intima and internal elastic lamina (Fig. 2f); adhesion of leukocytes to damaged endothelium, tunica intima, internal elastic lamina and tunica media (Fig. 2d to g); cytoplasmic swelling and nuclear pyknosis, karyorrhexis, hyalinization and dissolution of myocytes subjacent to damaged tunica intima (Fig. 2e to g); acute coagulative necrosis of myocytes in the tunica media (Fig. 2d to g); and emigration of leukocytes into the damaged tunica media (Fig. 2g). The Fraser–Lendrum method for fibrin was applied to the lesion in Fig. 2e and no fibrin was demonstrated (Luna 1992). Fibrin was demonstrated in the positive control section included with the procedure.
Rabbits infused with saline alone (i.e., negative control group), infused with saline and CA and not exposed to pulsed US (i.e., negative control group), or infused with saline alone and exposed to pulsed US (i.e., positive control group) did not have damaged auricular arteries. In addition, 5 of 5, 5 of 5 and 4 of 9 rabbits infused with saline and CA and exposed to pulsed US at 0.85 MPa, 3.9 MPa and at 9.5 MPa, respectively (i.e., treatment groups) did not have damaged auricular arteries. However, some rabbits in these negative control and experimental groups had reactive changes in the endothelial cells that included cell swelling and/or widening of the space between contiguous endothelial cells (Fig. 2c, d). The remaining rabbits in these groups had no change in the cytomorphological appearance of their endothelium, tunica intima, internal elastic lamina or tunica media (see Fig. 2a). All control rabbits (i.e., saline and US) in the high-pressure positive control group had reactive changes.
Rabbit s-thrombomodulin concentrations
The mean concentrations of s-thrombomodulin from all rabbits used in the study are shown in Table 3 and Fig. 4. The s-thrombomodulin concentrations did not correlate with lesion scores; in fact, the highest mean concentration of s-thrombomodulin occurred in rabbits exposed to US at 0.85 MPa, with 4 of 10 in the 0.85-MPa group having s-thrombomodulin concentrations greater than 30 ng/mL. These rabbits had auricular artery lesions scored as reactive changes in the endothelial cells (see Figs. 3 and 4).
Table 3.
Experimental results
| Mean ± SEM* of s-thrombomodulin concentrations (ng/mL) in each treatment group (n of animals)
|
||||
|---|---|---|---|---|
| Peak rarefactional pressure (MI) | Saline alone | CA alone in saline | US alone with saline | CA in saline with US exposure |
| 0.23 MPa (0.11)* | 3.1 ± 2.6 (4) | 5.8 ± 2.8 (4) | NA | NA |
| 0.85 MPa (0.40) | NA | NA | 16 ± 6.8 (5) | 22 ± 10 (5) |
| 3.9 MPa (1.8) | NA | NA | 10 ± 4.8 (3) | 4.3 ± 2.0 (5) |
| 9.5 MPa (4.4)† | NA | NA | 7.5 ± 3.9 (7) | 8.0 ± 3.2 (9) |
NA = not applicable; MI = mechanical index.
Sham (negative) control for which exposure duration is approximately 30 s during the transducer alignment procedure. Following alignment, the ear was exposed without the US turned on.
Positive control
Fig. 3.
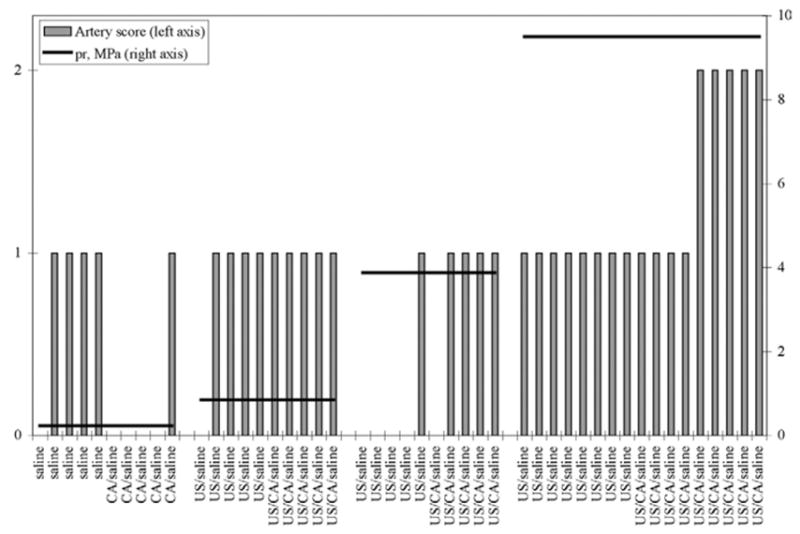
Exposure conditions and lesions in all rabbits. Artery scores: 0 = no abnormal changes in any structures in auricular artery; 1 = reactive changes in endothelial cells (including cell swelling and/or alterations of spacing between cells); 2 = damage to auricular artery characterized by endothelial cell swelling and/or alterations of spacing between cells; adhesion of leukocytes to injured endothelium and degeneration and necrosis of endothelial cells and underlying internal elastic lamina and myocytes of the tunica media.
DISCUSSION AND SUMMARY
In this study, we have demonstrated three important observational findings. First, the interaction of CA with US at exposure conditions below the FDA MI limit of 1.9 did not cause histopathologic damage of the auricular artery in vivo; however, this interaction can cause histopathologic damage using exposure conditions higher than the FDA limit.
Second, the arterial lesions observed in this study are characteristic of acute coagulative necrosis (necrotic cells) (Kumar et al. 2005) and include: 1. cytoplasmic lesions, such as increased eosinophilia, homogeneous appearance, vacuolation and membrane distortions and alterations, and 2. nuclear lesions such as pyknosis, karyorrhexis and dissolution. These necrotic cells likely result from denaturation of intracellular proteins and nuclear and cytoplasmic chromatin. Circulating leukocytes (neutrophils) are attracted and adhere to the areas of injury (leukocyte adhesion cascade), as shown in Fig. 2d to g.
Acute coagulative necrosis may be caused by many initiating events; however, in the context of the interaction of US with CAs, physical effects such as trauma and extreme alterations in temperature seem the most likely causes of cell injury (Kumar et al. 2005). Shear stress (Church et al. 2006; Miller et al. 2006; AIUM 2000a, 2000b, 2000c) or thermal phenomena (Church et al. 2006; Dalecki 2004; AIUM 2000a, 2000b, 2000c) are the most likely physical forms of injury that could produce the lesions seen in this study. Several in vitro studies have shown that shear stress from bubble oscillation can injure or cause sonoporation of monolayer cells (Miller 1998; Miller and Dou 2004a, 2004b); theoretical studies suggest similar phenomena may occur (Wu 2002). Heat and microjets arising from the collapse of microbubbles (inertial cavitation) are a second group of phenomena (Church et al. 2006; Dalecki 2004; AIUM 2000a, 2000b, 2000c) that potentially could induce lesions in vascular endothelium consistent with acute coagulative necrosis.
The interaction of US with CA likely leads to violent oscillation and/or collapse of CA and, in vivo, the hypothetical formation of shear stress forces or thermal changes (heat or microjets), denaturation and coagulation of cell membrane and cytoplasmic proteins and cell necrosis. For damage to occur, these interactions must take place in the interface (nanometer scale) between the luminal endothelial cell membrane and CA in laminar arterial blood flow. Although shear stress phenomena have been studied in greater detail and may be more relevant to some in respect to the mechanism of injury (Miller 1998; Miller and Dou 2004a, 2004b; Wu 2002), it has been shown that single-bubble cavitation results in plasma formation and temperature elevation (≈4300 to 5000 °K) of a degree sufficient to induce thermal injury (Didenko et al. 1999; Suslick 2004). In vivo, such bubble collapse could potentially result in the formation of microjets (AIUM 2000a, 2000b, 2000c) of superheated gas (thermal injury) that would result in denaturation and coagulation of cell membrane and cytoplasmic proteins consistent with acute coagulative cell necrosis. Although unlikely, based on the cytomorphology of the lesion, an apoptotic mechanism of cell injury could also be considered (Kumar et al. 2005).
Third, the mean s-thrombomodulin concentrations appeared to parallel reversible and irreversible injury of endothelial cells by US alone or US and CA interactions. Rabbits with elevated thrombomodulin concentrations were those rabbits whose lesions were most consistent with reversible cell injury characterized by plasma membrane and nuclear alterations (Kumar et al. 2005). Rabbits whose arteries had acute coagulative necrosis (irreversible cell injury) did not have elevated s-thrombomodulin concentrations. Cells with reversible cell injury are functioning cells; thus, they are likely still capable of synthesizing and releasing s-thrombomodulin after injury. Cells with irreversible cell injury are dead cells and no longer function; thus, they are incapable of synthesizing and releasing s-thrombomodulin after injury. Because cells with acute coagulative necrosis have irreversible cell injury (Kumar et al. 2005), they detach from the vascular surface and are swept away by vascular flow to be removed by the monocyte-macrophage system.
The presence of s-thrombomodulin in plasma can follow perterbation of vascular endothelial cells from a variety of stimuli (Takano et al. 1990). Stimuli such as experimental manipulation, CA, US alone and CA with US can likely serve as stimuli for the synthesis and release of s-thrombomodulin; however, these stimuli cause reversible cell injury that, with time, is repaired and there is a gradual return to normal function with decreasing concentrations of s-thrombomodulin in the plasma. Thus, endothelial cells scored as reactive were physically present and were responding functionally to injury and releasing s-thrombomodulin into the circulation for the entire 24-h period posttreatment. Exogenous experimental variables were controlled in this study by ensuring that all rabbits were subjected to the exact same experimental conditions and manipulations. Therefore, at 24 h postultrasound exposure, cells with reversible injury are capable of synthesizing and releasing thrombomodulin detectable by ELISA assay. Cells with irreversible injury are dead, nonfunctional, likely within phagocytic cells, and are incapable of synthesizing and releasing thrombomodulin detectable by ELISA assay.
The results from this study are an early step in developing a better understanding of the bioeffects of the interactions of US with CA on the vascular system, especially as these effects relate to the assessment of coronary artery stenosis and myocardial perfusion. Studies need to be conducted to establish the short- and long-term bioeffects of CA on vascular endothelium, especially if such agents are to be used in assessing coronary artery stenosis and myocardial perfusion. Short-term studies should focus on the risk associated with imaging coronary arteries in patients with unstable atheromatous plaques. Long-term studies should address the potential for atheromatous plaques to develop in myocytes of the tunica media damaged by the interaction of CA and pulsed US. The generation of these data will allow for a more clear understanding of the safety issues surrounding the use of CA in patients at risk.
Acknowledgments
The authors thank the Bioacoustics Research Laboratory and the staff of the Histopathology Laboratory, College of Veterinary Medicine, University of Illinois for technical contributions. This study was supported, in part, by the NIH (grant EB02641m formerly HL58218) awarded to W. D. O’Brien, Jr. and J. F. Zachary.
Footnotes
Performed by Dr. J. L. Catalfamo at the Comparative Coagulation Laboratory, Animal Health Diagnostic Center, Cornell University, Ithaca, NY.
References
- Aggeli CJ, Shimoni S, Nagueh SF, Zoghbi WA. Quantitative parameters of myocardial perfusion with contrast echocardiography in human beings: Influence of triggering mode. J Am Soc Echocardiogr. 2002;15(12):1432–1439. doi: 10.1067/mje.2002.127453. [DOI] [PubMed] [Google Scholar]
- AIUM (American Institute of Ultrasound in Medicine) Section 4–Bioeffects in tissues with gas bodies. Review. J Ultrasound Med. 2000a;19(2):97–108. 154–68. doi: 10.7863/jum.2000.19.2.97. [DOI] [PMC free article] [PubMed] [Google Scholar]
- AIUM (American Institute of Ultrasound in Medicine. Section 6–Mechanical bioeffects in the presence of gas-carrier ultrasound contrast agents. Review. J Ultrasound Med. 2000b;19(2):120–142. 154–168. doi: 10.7863/jum.2000.19.2.120. [DOI] [PMC free article] [PubMed] [Google Scholar]
- AIUM (American Institute of Ultrasound in Medicine) Section 7–Discussion of the mechanical index and other exposure parameters. Review. J Ultrasound Med. 2000c;19(2):143–148. 154–168. doi: 10.7863/jum.2000.19.2.143. [DOI] [PMC free article] [PubMed] [Google Scholar]
- Al-Mansour HA, Mulvagh SL, Pumper GM, Klarich KW, Foley DA. Usefulness of harmonic imaging for left ventricular opacification and endocardial border delineation by optison. Am J Cardiol. 2000;85(6):795–799. A10. doi: 10.1016/s0002-9149(99)00868-1. [DOI] [PubMed] [Google Scholar]
- American Heart Association. Heart disease and stroke statistics, 2005 update. Dallas, TX: American Heart Association; 2005. [Google Scholar]
- Ammi AY, Cleveland RO, Mamou J, et al. Ultrasonic contrast agent shell rupture detected by inertial cavitation and rebound signals. IEEE Trans Ultrason Ferroelec Freq Control. 2006;53(1):126–136. doi: 10.1109/tuffc.2006.1588398. [DOI] [PMC free article] [PubMed] [Google Scholar]
- Asanuma T, Fujihara T, Otani K, et al. Noninvasive vessel-selective perfusion imaging with intravenous myocardial contrast echocardiography. J Am Soc Echocardiogr. 2004;17(6):654–658. doi: 10.1016/j.echo.2004.03.011. [DOI] [PubMed] [Google Scholar]
- Benson RE, Catalfamo JL, Brooks M, Dodds WJ. A sensitive immunoassay for von Willebrand factor. J Immunoassay. 1991;12(3):371–390. doi: 10.1080/01971529108055078. [DOI] [PubMed] [Google Scholar]
- Benson RE, Catalfamo JL, Dodds WJ. A multispecies enzyme-linked immunosorbent assay for von Willebrand’s factor. J Lab Clin Med. 1992;119(4):420–427. [PubMed] [Google Scholar]
- Boehme MW, Galle P, Stremmel W. Kinetics of thrombomodulin release and endothelial cell injury by neutrophil-derived proteases and oxygen radicals. Immunology. 2002;107(3):340–349. doi: 10.1046/j.1365-2567.2002.01469.x. [DOI] [PMC free article] [PubMed] [Google Scholar]
- Boffa MC, Karmochkine M. Thrombomodulin: An overview and potential implications in vascular disorders. Lupus. 1998;7(Suppl 2):S120–S125. doi: 10.1177/096120339800700227. [DOI] [PubMed] [Google Scholar]
- Bruce M, Averkiou M, Tiemann K, et al. Vascular flow and perfusion imaging with ultrasound contrast agents. Ultrasound Med Biol. 2004;30(6):735–743. doi: 10.1016/j.ultrasmedbio.2004.03.016. [DOI] [PubMed] [Google Scholar]
- Chao TH, Li YH, Tsai WC, et al. Elevation of the soluble thrombomodulin levels is associated with inflammation after percutaneous coronary interventions. Clin Cardiol. 2004;27(7):407–410. doi: 10.1002/clc.4960270708. [DOI] [PMC free article] [PubMed] [Google Scholar]
- Chapman S, Windle J, Xie F, McGrain A, Porter TR. Incidence of cardiac arrhythmias with therapeutic versus diagnostic ultrasound and intravenous microbubbles. J Ultrasound Med. 2005;24(8):1099–1107. doi: 10.7863/jum.2005.24.8.1099. [DOI] [PubMed] [Google Scholar]
- Chen LX, Wang XF, Nanda NC, et al. Real-time three-dimensional myocardial contrast echocardiography in assessment of myocardial perfusion defects. Chin Med J (Engl) 2004;117(3):337–341. [PubMed] [Google Scholar]
- Church CC, Carstensen EL, Nyborg WL, et al. The risk of exposure to diagnostic ultrasound in postnatal subjects—Nonthermal mechanisms. J Ultrasound Med. 2007 doi: 10.7863/jum.2008.27.4.565. (in press) [DOI] [PubMed] [Google Scholar]
- Clark LN, Dittrich HC. Cardiac imaging using Optison. Am J Cardiol. 2000;86:14G–18G. doi: 10.1016/s0002-9149(00)00984-x. [DOI] [PubMed] [Google Scholar]
- Cohen JL, Cheirif J, Segar DS, Gillam LD, Gottdiener JS, Hausnerova E, Bruns DE. Improved left ventricular endocardial border delineation and opacification with OPTISON (FS069), a new echocardiographic contrast agent. Results of a phase III Multicenter Trial. J Am Coll Cardiol. 1998;32:746–752. doi: 10.1016/s0735-1097(98)00311-8. [DOI] [PubMed] [Google Scholar]
- Dalecki D. Mechanical bioeffects of ultrasound. Ann Rev Biomed Eng. 2004;6:229–248. doi: 10.1146/annurev.bioeng.6.040803.140126. [DOI] [PubMed] [Google Scholar]
- Dalecki D, Rota C, Raeman CH, Child SZ. Premature cardiac contractions produced by ultrasound and microbubble contrast agents in mice. Acoust Res Lett Online (ARLO) 2005;6(3):221–226. [Google Scholar]
- Dawson D, Rinkevich D, Belcik T, et al. Measurement of myocardial blood flow velocity reserve with myocardial contrast echocardiography in patients with suspected coronary artery disease: Comparison with quantitative gated technetium 99m sestamibi single photon emission computed tomography. J Am Soc Echocardiogr. 2003;16(11):1171–1177. doi: 10.1067/S0894-7317(03)00646-1. [DOI] [PubMed] [Google Scholar]
- Didenko YT, McNamara WB, III, Suslick KS. Hot spot conditions during cavitation in water. J Am Chem Soc. 1999;121(24):5817–5818. [Google Scholar]
- Dohi Y, Ohashi M, Sugiyama M, et al. Circulating thrombomodulin levels are related to latent progression of atherosclerosis in hypertensive patients. Hypertens Res. 2003;26(6):479–483. doi: 10.1291/hypres.26.479. [DOI] [PubMed] [Google Scholar]
- Dubart AE, Carvalho da Silva KG, Jr, Korosoglou G, et al. Real-time myocardial contrast echocardiography for the detection of stress-induced myocardial ischemia. Comparison with 99mTc-sestamibi single photon emission computed tomography. Z Kardiol. 2004;93(11):890–896. doi: 10.1007/s00392-004-0144-7. [DOI] [PubMed] [Google Scholar]
- Ejiri S, Eguchi Y, Kishida A, et al. Cellular distribution of thrombomodulin as an early marker for warm ischemic liver injury in porcine liver transplantation: Protective effect of prostaglandin I2 analogue and tauroursodeoxycholic acid. Transplantation. 2001;27; 71(6):721–726. doi: 10.1097/00007890-200103270-00006. [DOI] [PubMed] [Google Scholar]
- Gando S, Kameue T, Matsuda N, et al. Serial changes in neutrophil-endothelial activation markers during the course of sepsis associated with disseminated intravascular coagulation. Thromb Res. 2005;116(2):91–100. doi: 10.1016/j.thromres.2004.09.022. [DOI] [PubMed] [Google Scholar]
- Gando S, Kameue T, Matsuda N, et al. Systemic inflammation and disseminated intravascular coagulation in early stage of ALI and ARDS: Role of neutrophil and endothelial activation. Inflammation. 2004;28(4):237–244. doi: 10.1023/b:ifla.0000049049.81688.fe. [DOI] [PubMed] [Google Scholar]
- Hjerkinn EM, Seljeflot I, Sandvik L, Hjermann I, Arnesen H. Markers of endothelial cell activation in elderly men at high risk for coronary heart disease. Scand J Clin Lab Invest. 2005;65(3):201–209. doi: 10.1080/00365510510013613. [DOI] [PubMed] [Google Scholar]
- Hwang JH, Brayman AA, Reidy MA, et al. Vascular effects induced by combined 1-MHz ultrasound and microbubble contrast agent treatments in vivo. Ultrasound Med Biol. 2005;31(4):553–564. doi: 10.1016/j.ultrasmedbio.2004.12.014. [DOI] [PubMed] [Google Scholar]
- Kumar V, Abba AK, Fausto N. Cellular adaptations, cell injury, and cell death. In: Kumar V, Abba AK, Fausto N, editors. Robbins and Cotran pathologic basis of disease. 7. Philadelphia, PA: Elsevier-Saunders; 2005. pp. 11–31. [Google Scholar]
- Labovitz AJ, Bierig M. Tips for the technical director, sonographer, and nurse. Optison ContrastEcho Newslett (GE Healthcare) 2003;1(3):2. [Google Scholar]
- Li P, Armstrong WF, Miller DL. Impact of myocardial contrast echocardiography on vascular permeability: Comparison of three different contrast agents. Ultrasound Med Biol. 2004;30(1):83–91. doi: 10.1016/j.ultrasmedbio.2003.09.004. [DOI] [PubMed] [Google Scholar]
- Lohi O, Urban S, Freeman M. Diverse substrate recognition mechanisms for rhomboids; thrombomodulin is cleaved by mammalian rhomboids. Curr Biol. 2004;14(3):236–241. doi: 10.1016/j.cub.2004.01.025. [DOI] [PubMed] [Google Scholar]
- Luna LG. Histopathologic methods and color atlas of special stains and tissue artifacts. Downers Grove, IL: American Histolabs, Inc., Johnson Printers; 1992. Fraser–Lendrum method; pp. 410–411. [Google Scholar]
- Malhotra V, Nwogu J, Bondmass MD, et al. Is the technically limited echocardiographic study an endangered species? Endocardial border definition with native tissue harmonic imaging and Optison contrast: A review of 200 cases. J Am Soc Echocardiogr. 2000;13:771–773. doi: 10.1067/mje.2000.106078. [DOI] [PubMed] [Google Scholar]
- Miller DL. Frequency relationships for ultrasonic activation of free microbubbles, encapsulated microbubbles, and gas-filled micro-pores. J Acoust Soc Am. 1998;104:2498–2505. doi: 10.1121/1.423755. [DOI] [PubMed] [Google Scholar]
- Miller DL, Dou C. Membrane damage thresholds for pulsed or continuous ultrasound in phagocytic cells loaded with contrast agent as bodies. Ultrasound Med Biol. 2004a;30:405–411. doi: 10.1016/j.ultrasmedbio.2003.11.013. [DOI] [PubMed] [Google Scholar]
- Miller DL, Dou C. Membrane damage thresholds for 1- to 10-MHz pulsed ultrasound exposure of phagocytic cells loaded with contrast agent gas bodies in vitro. Ultrasound Med Biol. 2004b;30:973–977. doi: 10.1016/j.ultrasmedbio.2004.05.010. [DOI] [PubMed] [Google Scholar]
- Miller DL, Gies RA. Gas-body-based contrast agent enhances vascular bioeffects of 1.09 MHz ultrasound on mouse intestine. Ultrasound Med Biol. 1998;24(8):1201–1208. doi: 10.1016/s0301-5629(98)00063-5. [DOI] [PubMed] [Google Scholar]
- Miller DL, Gies RA. The influence of ultrasound frequency and gas-body composition on the contrast agent-mediated enhancement of vascular bioeffects in mouse intestine. Ultrasound Med Biol. 2000;26(2):307–313. doi: 10.1016/s0301-5629(99)00138-6. [DOI] [PubMed] [Google Scholar]
- Miller DL, Quddus J. Diagnostic ultrasound activation of contrast agent gas bodies induces capillary rupture in mice. Proc Natl Acad Sci USA. 2000;97(18):10179–10184. doi: 10.1073/pnas.180294397. [DOI] [PMC free article] [PubMed] [Google Scholar]
- Miller DL, Averkiou MA, Brayman AA, et al. Bioeffects considerations for diagnostic ultrasound contrast agents. J Ultrasound Med. 2007 doi: 10.7863/jum.2008.27.4.611. (in press) [DOI] [PubMed] [Google Scholar]
- Miller DL, Li P, Armstrong WF. The effect of time and of vasoactive drugs on capillary leakage induced during myocardial contrast echocardiography. Echocardiography. 2004;21(2):125–132. doi: 10.1111/j.0742-2822.2004.03062.x. [DOI] [PubMed] [Google Scholar]
- Miller DL, Li P, Gordon D, Armstrong WF. Histological characterization of microlesions induced by myocardial contrast echocardiography. Echocardiography. 2005;22(1):25–34. doi: 10.1111/j.0742-2822.2005.03184.x. [DOI] [PubMed] [Google Scholar]
- Miller JJ, Tiemann K, Podell S, Doerr Stevens JK, Kuvelas T, Greener Y, Killiam AL, Goenechea J, Dittrich HC, Becker H. In vitro, animal, and human characterization of OPTISON infusions for myocardial contrast echocardiography. J Am Soc Echocardiogr. 1999;12(12):1027–1034. doi: 10.1016/s0894-7317(99)70098-2. [DOI] [PubMed] [Google Scholar]
- Mulvagh SL, DeMaria AN, Feinstein SB, et al. Contrast echocardiography: Current and future applications. Review J Am Soc Echocardiogr. 2000;13(4):331–342. doi: 10.1067/mje.2000.105462. [DOI] [PubMed] [Google Scholar]
- O’Brien WD, Jr, Frizzell LA, Schaeffer DJ, Zachary JF. Superthreshold behavior of ultrasound-induced lung hemorrhage in adult mice and rats: Role of pulse repetition frequency and exposure duration. Ultrasound Med Biol. 2001a;27(2):267–277. doi: 10.1016/s0301-5629(00)00342-2. [DOI] [PubMed] [Google Scholar]
- O’Brien WD, Jr, Simpson DG, Frizzell LA, Zachary JF. Superthreshold behavior and threshold estimation of ultrasound-induced lung hemorrhage in adult rats: Role of beamwidth. IEEE Trans Ultrason Ferroelec Freq Control. 2001b;48(6):1695–1705. doi: 10.1109/58.971723. [DOI] [PubMed] [Google Scholar]
- Otani K, Toshida T, Iwata A, et al. Adenosine triphosphate stress myocardial contrast echocardiography detects coronary artery stenosis with greater sensitivity than wall-motion abnormality measurements. J Am Soc Echocardiogr. 2004;17(12):1275–1280. doi: 10.1016/j.echo.2004.08.016. [DOI] [PubMed] [Google Scholar]
- Podell S, Burrascano C, Gaal M, Golec B, Maniquis J, Mehlhaff P. Physical and biochemical stability of Optison, an injectable ultrasound contrast agent. Biotechnol Appl Biochem. 1999;30(Pt 3):213–223. [PubMed] [Google Scholar]
- Raum K, O’Brien WD., Jr Pulse-echo field distribution measurement technique of high-frequency ultrasound sources. IEEE Trans Ultrason Ferroelec Freq Control. 1997;44:810–815. [Google Scholar]
- Sakamaki F, Kyotani S, Nagaya N, et al. Increase in thrombomodulin concentrations after pulmonary thromboendarterectomy in chronic thromboembolic pulmonary hypertension. Chest. 2003;124(4):1305–1311. doi: 10.1378/chest.124.4.1305. [DOI] [PubMed] [Google Scholar]
- Schoen FJ. The heart. In: Kumar V, Abba AK, Fausto N, editors. Robbins and Cotran pathologic basis of disease. 7. Philadelphia: Elsevier-Saunders; 2005. pp. 571–586. [Google Scholar]
- Seidel G, Meyer K, Metzler V, et al. Human cerebral perfusion analysis with ultrasound contrast agent constant infusion: A pilot study on healthy volunteers. Ultrasound Med Biol. 2002;28(2):183–189. doi: 10.1016/s0301-5629(01)00501-4. [DOI] [PubMed] [Google Scholar]
- Shimoni S, Frangogiannis NG, Aggeli CJ, et al. Microvascular structural correlates of myocardial contrast echocardiography in patients with coronary artery disease and left ventricular dysfunction: Implications for the assessment of myocardial hibernation. Circulation. 2002;106(8):950–956. doi: 10.1161/01.cir.0000026395.19594.43. [DOI] [PubMed] [Google Scholar]
- Shimoni S, Frangogiannis NG, Aggeli CJ, et al. Identification of hibernating myocardium with quantitative intravenous myocardial contrast echocardiography: Comparison with dobutamine echocardiography and thallium-201 scintigraphy. Circulation. 2003;107(4):538–544. doi: 10.1161/01.cir.0000047211.53448.12. [DOI] [PubMed] [Google Scholar]
- Skyba DM, Price RJ, Linka AZ, Skalak TC, Kaul S. Direct in vivo visualization of intravascular destruction of microbubbles by ultrasound and its local effects on tissue. Circulation. 1998;98(4):290–293. doi: 10.1161/01.cir.98.4.290. [DOI] [PubMed] [Google Scholar]
- Suslick KS. Sonoluminescence and Sonochemistry. In: Meyers Robert., editor. Encyclopedia of Physical Science and Technology. 3. Vol. 17. Academic Press: San Diego; 2004. pp. 363–376. [Google Scholar]
- Takeuchi M, Ogawa K, Wake R, et al. Measurement of coronary flow velocity reserve in the posterior descending coronary artery by contrast-enhanced transthoracic Doppler echocardiography. J Am Soc Echocardiogr. 2004;17(1):21–27. doi: 10.1016/j.echo.2003.09.001. [DOI] [PubMed] [Google Scholar]
- Takano S, Kimura S, Ohdama S, Aoki N. Plasma thrombomodulin in health and diseases. Blood. 1990;76(10):2024–2029. [PubMed] [Google Scholar]
- Teotico GA, Miller RJ, Frizzell LA, Zachary JF, O’Brien WD., Jr Attenuation coefficient estimates of mouse and rat chest wall. IEEE Trans Ultrason Ferroelec Freq Control. 2001;48(2):593–601. doi: 10.1109/58.911742. [DOI] [PubMed] [Google Scholar]
- Van de Wouwer M, Conway EM. Novel functions of thrombomodulin in inflammation. Crit Care Med. 2004;32(Suppl 5):S254–S261. doi: 10.1097/01.ccm.0000128036.64448.9e. [DOI] [PubMed] [Google Scholar]
- Van de Wouwer M, Collen D, Conway EM. Thrombomodulin-protein C-EPCR system: Integrated to regulate coagulation and inflammation. Arterioscler Thromb Vasc Biol. 2004;24(8):1374–1383. doi: 10.1161/01.ATV.0000134298.25489.92. [DOI] [PubMed] [Google Scholar]
- van Der Wouw PA, Brauns AC, Bailey SE, Powers JE, Wilde AA. Premature ventricular contractions during triggered imaging with ultrasound contrast. J Am Soc Echocardiogr. 2000;13(4):288–294. doi: 10.1067/mje.2000.103865. [DOI] [PubMed] [Google Scholar]
- Wu J. Theoretical study on shear stress generated by microstreaming surrounding contrast agents attached to living cells. Ultrasound Med Biol. 2002;28:125–129. doi: 10.1016/s0301-5629(01)00497-5. [DOI] [PubMed] [Google Scholar]
- Yip GW, Chandrasekaran K, Miller TD, et al. Feasibility of continuous venous infusion of SonoVue for qualitative assessment of reversible coronary perfusion defects in stress myocardial contrast echocardiography. Int J Cardiovasc Imaging. 2003;19(6):473–481. doi: 10.1023/b:caim.0000004263.46151.9d. [DOI] [PubMed] [Google Scholar]
- Zachary JF, Hartleben SA, Frizzell LA, O’Brien WD., Jr Arrhythmias in rat hearts exposed to pulsed ultrasound after intravenous injection of contrast agent. J Ultrasound Med. 2002;21(12):1347–1356. 1343–1345. doi: 10.7863/jum.2002.21.12.1347. [DOI] [PubMed] [Google Scholar]
- Zachary JF, Frizzell LA, Norrell KS, Blue JP, Miller RJ, O’Brien WD., Jr Temporal and spatial evaluation of lesion reparative responses following superthreshold exposure of rat lung to pulsed ultrasound. Ultrasound Med Biol. 2001a;27(6):829–839. doi: 10.1016/s0301-5629(01)00375-1. [DOI] [PubMed] [Google Scholar]
- Zachary JF, Semsprott JM, Frizzell LA, Simpson DG, O’Brien WD., Jr Superthreshold behavior and threshold estimation of ultrasound-induced lung hemorrhage in mice and rats. IEEE Trans Ultrason Ferroelec Freq Control. 2001b;48(2):581–592. doi: 10.1109/58.911741. [DOI] [PubMed] [Google Scholar]
- Zhuang L, Wang XF, Xie MX, et al. Experimental study of quantitative assessment of left ventricular mass with contrast enhanced real-time three-dimensional echocardiography. J Cardiol. 2004;43(1):23–29. [PubMed] [Google Scholar]