

Abstract
Objectives
The determination of eloquent cortex is essential when planning neurosurgical approaches to brain lesions. This study examined the abilities of medical personnel of various backgrounds to predict the location of functional cortex using anatomical information provided by MR imaging.
Patients and Methods
Neurosurgeons, neuroscientists, neuroradiologists, medical students and MR technologists viewed anatomical MR images acquired from patients with brain tumors and healthy controls. These five groups of raters were then asked to locate the Primary Motor Hand, Supplementary Motor and Primary Auditory Areas and their predictions were compared to fMRI data acquired from the same subjects.
Results
The overall the mean distance from the center of the fMRI activation was 2.38 cm. The neuroscientists performed the best and MR technologists performed the worst (mean distance from center of 1.83 cm and 3.04 cm respectively, p < 0.05). The difference between patients and controls was not significant. The mean distance by ROI was Primary Motor Hand 2.03 cm, Auditory Area 2.06 cm and Supplementary Motor Area 3.18 cm (p < 0.05). Raters also performed best in the medial-lateral direction, compared to superior-inferior and anterior-posterior directions (mean distances from center 0.42, 1.04 and 1.81 cm, respectively). Finally, the approximate minimum fields of view necessary to capture the entire fMRI activations using the raters’ predictions ranged from 5 to 15 cm, or 3 to 12 cm larger than the fMRI activations.
Conclusion
Medical personnel of various training perform poorly when using only anatomical information to predict the location of functional areas of cortex.
Keywords: Neurosurgery, preoperative, Brain mapping, BOLD
Introduction
Neuroscientists and clinicians have historically used knowledge gained from patients with brain lesions and intraoperative electrocortical stimulation (ECS) and more recently functional magnetic resonance imaging (fMRI) to describe anatomically the functional areas of the brain. Neurosurgeons have used this information in planning surgical procedures to predict which brain areas are likely to harbor eloquent or essential cortex.
Functional MRI is being used increasingly for applications such as surgical planning [1–13]. Typically, susceptibility-weighted echo-planar imaging (EPI) is used to rapidly acquire a time series of whole-brain images while the patient performs specific tasks designed to activate relevant cortical areas. Susceptibility-weighted EPI is sensitive to changes in the blood oxygenation that accompany neuronal activation, thus, the blood oxygenation level dependent (BOLD) signal detected by EPI is taken as a marker for activation.
BOLD fMRI has proven to be extremely effective for mapping brain function, however, it is generally limited by low spatial resolution. For example, a typical voxel size in fMRI is 4x4x6 mm. Higher spatial resolution can be obtained but at a cost of signal-to-noise ratio (SNR), which is decreased in proportion to the reduction in voxel size. Furthermore, if full-brain coverage is maintained, acquisition time per image volume must be increased, which reduces the total number of image acquisitions for a fixed experiment time and thus further decreases SNR and sensitivity.
Spatial resolution can be increased without increasing acquisition time if a reduced volume is sampled. It follows that, if it is acceptable to reduce the portion of the brain covered, high-resolution fMRI studies could benefit from a higher SNR and sensitivity than would otherwise be possible by maintaining whole-brain coverage. This might be particularly beneficial for applications such as surgical planning where there are specific regions-of-interest (e.g. the tissue surrounding brain lesions).
When performing high-resolution, reduced-volume fMRI acquisitions, the question is naturally raised as to how accurately one can target the region to be imaged. Without prior knowledge of the specific individual’s functional anatomy, a general knowledge of functional anatomy must be used. Ideally, an expert in functional neuroanatomy will be present at the time of the fMRI scan. However, it is unlikely that such an expert will always be available to perform the task of targeting the regions-of-interest. In general, the task of prescribing the scan locations will be performed by a MRI technologist or research assistant.
When confronted with this scenario, several questions arise: How do clinicians, scientists, technologists and research assistants compare in their ability to predict areas of functional cortex? Are there areas of functional anatomy that are easier to identify than others? How accurate are the predictions in the brains of healthy subjects? Can accurate predictions be made when the anatomy is distorted, such as in patients with brain tumors? Is performance similar in all planes? To our knowledge, no studies have been performed to directly address these problems. We were therefore motivated to study such predictions as compared to fMRI results in an attempt to answer these questions.
We hypothesized that medical personnel, regardless of experience or expertise, would perform poorly when asked to predict the location of functional areas of the brain. To test this, we asked 20 raters of varying backgrounds to predict the locations of the fMRI activations using only high-resolution anatomical MR images. The MR images were from both normal control subjects and brain tumor patients for whom functional MRI studies had been previously performed. Thus, we were able to compare the accuracy of the raters’ predictions of the locations of activation with the results of the fMRI data analysis.
Materials and Methods
Functional MRI data
All fMRI data used in this study were obtained in previous fMRI experiments from two different groups: (1) healthy normal controls and (2) brain tumor patients. All experiments were performed using a 1.5 Tesla clinical MR scanner (GE Medical Systems) and were conducted in accordance with the ethical guidelines set forth by the local IRB. The first group consisted of right-handed volunteers (age 27–51 years) without any neurological/psychiatric abnormalities who were scanned during nine repeated sessions over approximately a two-year period. Test-retest data from these sessions has been published elsewhere [14–16]. The second group consisted of three tumor patients drawn from a larger pool of patients who had agreed to have pre-operative functional mapping exams. Information about tumor location, primary diagnosis and brief medical history for the patients is given in Table I. Results from this study have also been published in a previous report [13].
Table 1.
Brain Tumor Patients Characteristics
| Tumor Case | Age/Sex | Tumor Location | Diagnosis | History and Neurological findings |
|---|---|---|---|---|
| 1 | 39/M | Left PrCG | Oligodendroglioma WHO II/IV | Recurrent generalized seizures |
| 2 | 59/M | Right parieto-occipital lobe | Metastastic melanoma | No neurological deficits |
| 3 | 46/F | Bilateral occipital lobe | Oligodendroglioma WHO II/IV | Recurrent tumor, no neurological deficits |
From the normal control group, fMRI data was used from two different types of tasks – one for mapping of the hand motor area, and the other for mapping the auditory and language-related functional area. The task paradigm used for the mapping of hand motor area was sequential finger tapping of the right hand, paced at 1Hz by auditory cues. For auditory language task, 80 2-syllable nouns were selected from the Toronto Noun Pool [17] with common usage (frequency rating greater than 6) and randomly matched to make 40 pairs of nouns. The word pairs were presented through a headset at the rate of one pair every three seconds. Subjects were instructed to tap their index finger of the right hand when the pair contained a repeated pair of nouns.
The timing and presentation of auditory cues was controlled by Presentation software (Neurobehavioral Systems, CA). Four task blocks, each 30-seconds in duration, were interleaved with five 30-second control blocks. A total of 108 image sets were obtained over the period of the nine blocks. Each image set consisted of 24 6-mm axial Echo-planar (EP) image slices covering the whole brain (TR/TE=2500/50msec, 64x64 acquisition matrix).
For the brain tumor patients a different fMRI acquisition protocol was used. For each fMRI run, EPI data were acquired from 22 axial slices (thickness 4 mm) covering a 8.8cm slab that was positioned depending on whether the goal was motor or language mapping. Parameters of the EPI sequence were TR/TE=2000/50 msec, FA=90°, FOV=24 cm and matrix=64x64. The voxel size was 3.75 x 3.75 x 4 mm3.
Depending on the tumor location in the individual patients, primarily two different types of tasks were selected to map eloquent motor and language areas for the patient group. For patients in whom the tumor was in an area where eloquent motor areas could be affected by surgery, hand-clenching tasks were performed. These tasks involved clenching the right and left hand separately and together. The clenching was paced at 1Hz frequency using the same approach as with the healthy control subjects. For mapping the language areas, a semantic language task (semantic determination of concrete versus abstract nouns [18] was performed. The auditory cues/stimuli were delivered using the MR-compatible headset. In all fMRI runs, five task periods of 30 seconds duration were interleaved with six 30-second rest periods.
All fMRI data sets were processed without spatial normalization. We used in-house software to spatially register the functional data to the high-resolution anatomical images [14]. The mis-registration between EPI and anatomical reference images was adjusted by aligning the EP images to a T2*-weighted image set acquired using a standard gradient-echo sequence [13]. Pixel-by-pixel paired t-test scores were calculated across the time course of the MR signal and converted to their corresponding p-values. We used a p-value < 10−6 to determine the activation pattern. The activations mapped in this way were used as “ground truth” to determine the accuracy of the raters in predicting the location of functional activation for the various ROIs. In the normal control group, we averaged the p-values across the nine separate sessions, thus, in this group we had a very high confidence in the “truth” of the activation patterns.
Regions of Interest
Five ROI’s were initially chosen for this study: (1) Bilateral primary hand motor area, (2) bilateral supplementary motor area, (3) Left Broca’s area, (4) Left Wernicke’s Area, (5) bilateral primary auditory area. The spatial boundaries of the target functional area was marked and recorded in the S-I, M-L, and A-P directions. We adopted the following anatomical guidelines to define the function. These areas are elaborated below:
(1) Primary Motor Area: The posterior half of the precentral gyrus (BA 4) including premotor areas (posterior part of BA 6) in the anterior wall of the precentral gyrus [19]. (2) Supplementary motor area: medial frontal gyri (the medial part of BA 6 and part of BA 8) where it was limited inferiorly by the cingulate sulcus, posteriorly by a line extending from the upper most aspect of the precentral sulcus to the cingulate sulcus (para-central sulcus), and anteriorly by the first ascending branch of the cingulate sulcus [19]. (3) Broca's area: the opercular and triangular sections of the inferior frontal gyrus [20]. (4) Wernicke’s Area: the left temporal lobe, posterior to the primary auditory complex [21, 22]. (5) Primary and secondary auditory area: anterior and posterior transverse temporal gyri [16].
Data was collected for each of these 5 ROI’s. The language ROI’s (i.e. Broca’s and Wernicke’s areas) were not included in the final data analysis for reasons delineated below (see Statistical Analysis).
Rater Groups
Raters were recruited from each of the following groups: neurosurgeons, neuroscientists experienced in fMRI research, neuroradiologists, medical students and MRI technologists. Four volunteers from each of the five groups were asked to participate, for a total of 20 raters. The neurosurgeon group was comprised of 1 attending neurosurgeon (on faculty for 2 years), 1 3rd year neurosurgery resident and 2 4th year neurosurgery residents. The neuroscientist group was comprised of a neuropsychiatrist, a neurologist, a neurosurgeon, a graduate student and a neurologist, each of whom had several years of extensive experience with fMRI research. The neuroradiologists were all attending neuroradiologists, all of whom had been certified in neuroradiology for a minimum of 7 years. The medical students were all in their second year of medical school at the time of the study, and had all completed their neuroanatomy and pathophysiology of the nervous system courses. The MR technologists were comprised of 4 full-time radiology technologists who primarily performed MR imaging.
Scoring Method
The anatomical MR images from each of the healthy subjects and brain tumor patients were loaded into a 3-plane viewer created in MATLAB (Mathworks, Inc. Natick, MA). This viewer allowed the raters to simultaneously view a subject’s brain in the sagittal, coronal and axial planes. A set of crosshairs which corresponded to a 3D coordinate system also appeared in each plane. The crosshairs synchronized the images such that a rater would see the same anatomical point in all three planes at all times. The 3D coordinates of the current location of the crosshairs were displayed in a separate display box in the viewer.
Raters could navigate through the images using the mouse to reposition the crosshairs, or by typing in new coordinates into the coordinate display box. Raters were allowed to practice with the viewer until they were comfortable navigating through the images. Raters were also provided with a manual that described the 3D viewer and contained instructions for how to use it. The manual also contained one to two paragraphs for each of the five ROI’s which described in anatomic terms the generally accepted locations of these functional areas. For each ROI the manual also contained color sketches, gross photographs and MR images. The information was obtained from neuroscience textbooks and atlases.
Once raters were comfortable with both the 3-plane viewer and the manual, they were asked to locate the center of the five functional areas of cortex (ROI’s) using the crosshairs. The 3D coordinates were then recorded for each response (Figures 1 and 2).
Figure 1.
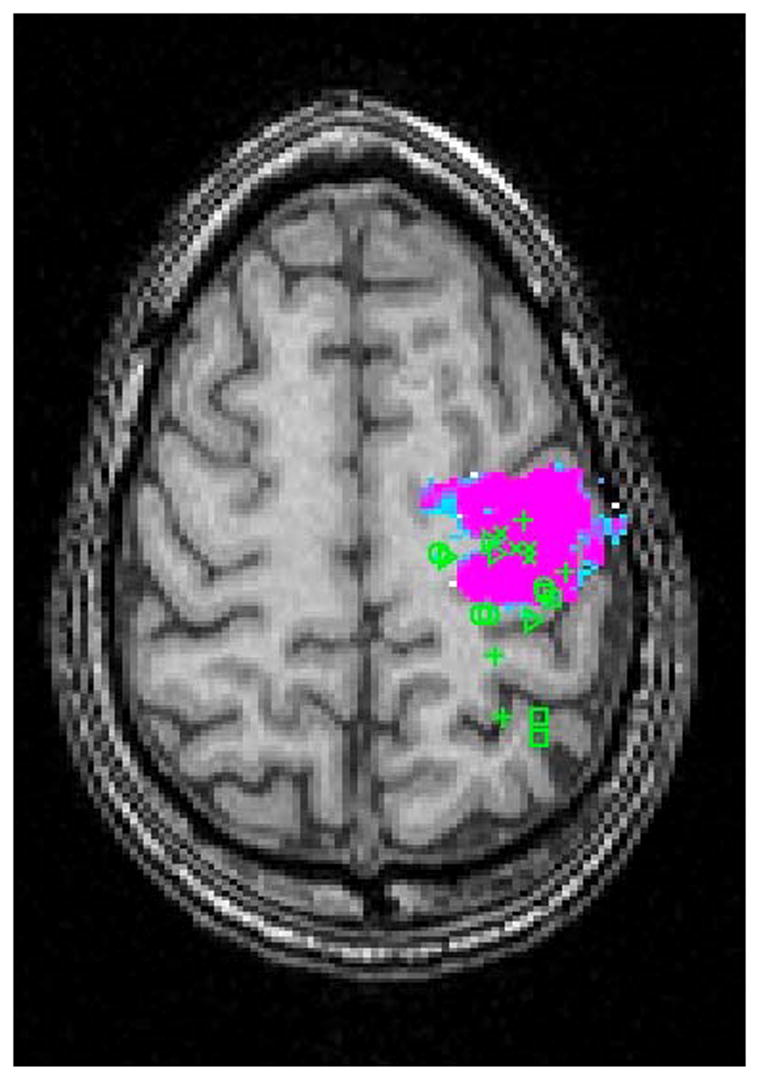
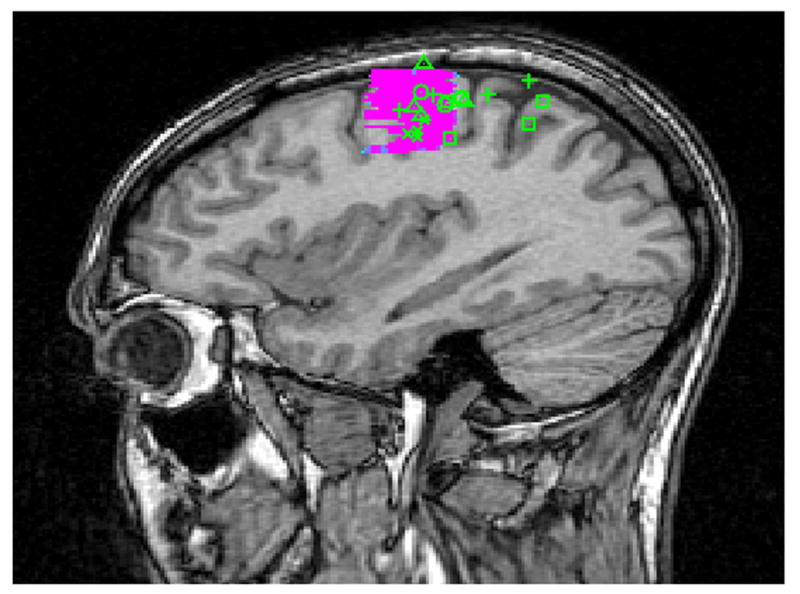
Raters Predictions Mapped on fMRI Activation of the Primary Motor Area in a Normal Subject in (A) Axial and (B) Sagittal Planes. ( + Neurosurgeons; △ Neuroscientists; X Neuroradiologists; □ MR technologists; ○ Medical Students)
Figure 2.
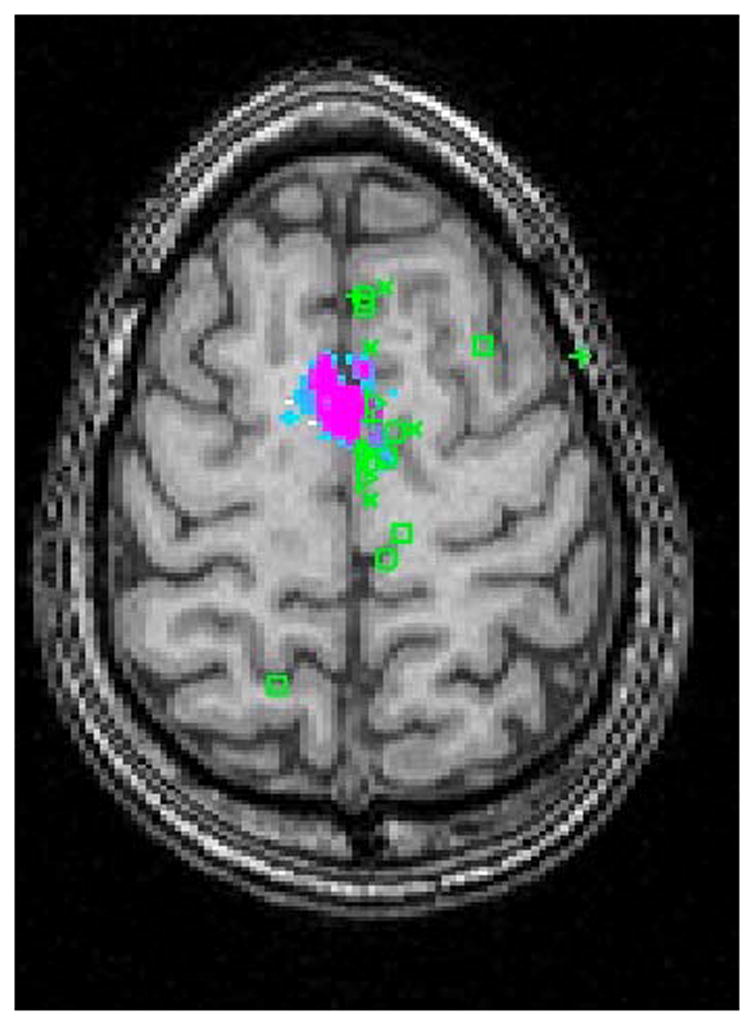
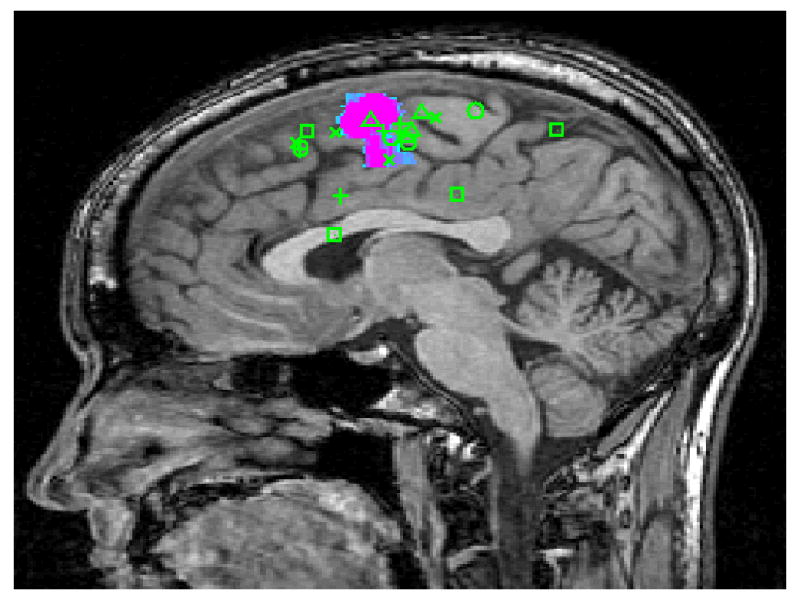
Raters Predictions Mapped on fMRI Activation of the Supplementary Motor Area in a Normal Subject in (A) Axial and (B) Sagittal Planes. ( + Neurosurgeons; △ Neuroscientists; X Neuroradiologists; □ MR technologists; ○ Medical Students)
Field of View Analysis
To evaluate the practical implications of the raters’ predictions, we performed an analysis to estimate the size of potential fields of view necessary to include the entire fMRI activations for each of the ROI’s. The raters’ 3D prediction coordinates were used as the center of the field of view. In each of the 3 planes, FOV’s were generated using the raters’ coordinates with progressively larger FOV sizes. Using the 3D plane viewer coordinate system the fMRI activation boundaries were compared to the hypothetical FOV limits. For each of these FOV sizes, the percentage of entire fMRI activations captured by these hypothetical FOV’s was calculated for each ROI and the rater categories. For each percentage calculation, individual predictions were included only if the fMRI activation size was less than the hypothetical FOV size.
Statistical Analysis
Summary statistics including the means, standard deviations (SDs), ranges, and 95% confidence interval of the means of the absolute distances from the center of the fMRI activations were reported. An analysis of variance (ANOVA) was used to compare the performances across all rater groups, with p-values derived from the F-tests. Within each rater group, we further perform an ANOVA to compare the individual raters within each of the groups. Stratified analyses were conducted by healthy volunteers vs. brain tumor cases.
During preliminary analyses, it was apparent that all of the rater groups had the worst performance in the language areas (i.e. Wernicke’s and Broca’s areas). However, when the predictions were compared to the traditionally described locations of the language ROI’s, the raters appeared to have made reasonably accurate predictions. The underlying explanation for the poor performance appeared to be that the fMRI activations acquired during the language tasks were in anatomical locations adjacent to the expected anatomical locations. Given the difficulty of selectively activating Broca’s and Wernicke’s areas during language tasks and the inability to verify which language areas were actually being utilized by the subjects during the tasks, these data points were excluded from the final results. In addition, we combined the left and right regions to form the primary motor area, supplementary motor area and primary auditory ROIs due to limited sample size. Stratified by ROI, we compared the performances between different rater groups for each of these ROIs.
Both database construction and statistical analyses were conducted in Microsoft Excel 2000 (www.microsoft.com).
Results
Between Rater Group Comparison
The rater groups were compared using absolute distance from the center of fMRI activation as a measure of accurate performance. The mean absolute distance from the center of activation by group is as follows: Neuroscientists 1.83 cm, Neuroradiologists 1.97 cm, Neurosurgeons 2.41 cm, Medical Students 2.65 cm and MR Technologists 3.04 cm. The differences between the groups were significant (p <0.05). This was true whether all subjects were combined or if they were stratified by subject category (tumor or healthy) and by ROI (primary motor area, supplementary motor area or auditory area. (Tables 2 and 3).
Table 2.
Between Rater Group Summary Statistics of Absolute Distance from center of fMRI activation
| Rater Group | Mean ± SD (cm) | |||
|---|---|---|---|---|
| Healthy Subjects | Tumor Subjects | All Subjects | ||
| 1 | Neuroscientists | 1.91 ± 1.19 | 1.73* ± 0.56 | 1.83* ± 0.94 |
| 2 | Neuroradiologists | 1.87* ± 1.05 | 2.09 ± 0.72 | 1.97 ± 0.90 |
| 3 | Neurosurgeons | 2.42 ± 0.89 | 2.41 ± 0.91 | 2.41 ± 0.89 |
| 4 | Medical Students | 2.99† ± 1.41 | 2.27 ± 0.85 | 2.65 ± 1.22 |
| 5 | MR Technologists | 2.77 ± 1.21 | 3.33† ± 1.20 | 3.04† ± 1.22 |
| P value | 0.008 | <0.001 | <0.001 | |
| All Raters | 2.39 ± 1.23 | 2.37 ± 1.01 | 2.38 ± 1.12 | |
Best performance
Worst performance
Table 3.
Between Rater Group Statistics of Individual ROI’s
| Rater Group | Mean ± SD (cm) | ||||||
|---|---|---|---|---|---|---|---|
| Primary Motor Area | Supplementary Motor Area | Primary Auditory Area | |||||
| Healthy Subjects | Tumor Subjects | Healthy Subjects | Tumor Subjects | Healthy Subjects | Tumor Subjects | ||
| 1 | Neuroscientists | 1.80 ± 0.34 | 2.02 ± 0.23 | 2.46* ± 2.13 | 1.89* ± 0.73 | 1.70 ± 0.83 | 1.29* ± 0.31 |
| 2 | Neuroradiologists | 1.16* ± 0.42 | 1.56* ± 0.41 | 3.15 ± 1.13 | 2.90 ± 0.40 | 1.59* ± 0.64 | 1.80 ± 0.48 |
| 3 | Neurosurgeons | 1.76 ± 0.80 | 1.94 ± 0.46 | 3.57 ± 0.70 | 3.42 ± 0.61 | 2.17 ± 0.35 | 1.85 ± 0.59 |
| 4 | Medical Students | 2.57† ± 1.34 | 2.51† ± 1.18 | 3.46 ± 2.06 | 2.40 ± 0.72 | 2.96† ± 1.30 | 1.89 ± 0.53 |
| 5 | MR Technologists | 2.45 ± 0.97 | 2.47 ± 0.97 | 4.42† ± 0.44 | 4.35† ± 0.37 | 2.09 ± 0.43 | 3.18† ± 1.18 |
| P value | 0.12 | 0.25 | 0.05 | < 0.001 | < 0.001 | < 0.001 | |
| All Raters | 1.95 ± 0.94 | 2.10 ± 0.78 | 3.41 ± 1.50 | 2.99 ± 1.04 | 2.10± 0.88 | 2.00 ± 0.90 | |
Best performance
Worst performance
Within Group Comparison
The differences in rater performance within groups were statistically significant for the Neuroscientists, Neuroradiologists, Medical Students and MR technologists when the raters were predicting locations of activation in the tumor subjects (p values ≤ 0.05; Table 4). The difference in performance was not statistically significant in the Neuroscientists, Neuroradiologists, Neurosurgeons and MR technologists for predictions made for the healthy subjects. The mean absolute distance for the individual raters is illustrated in Figure 3.
Table 4.
Within Rater Group Summary Statistics of Distance of All ROIs, along with p-values based on ANOVA
| Rater Group | Range of minimum – maximum (cm) | ||||
|---|---|---|---|---|---|
| Healthy Subjects | p-value | Tumor Subjects | p-value | ||
| 1 | Neuroscientists | 1.60 – 2.44 | 0.3 | 1.46 – 2.37 | 0.016 |
| 2 | Neuroradiologists | 1.68 – 1.97 | 0.94 | 1.20 – 3.51 | <0.001 |
| 3 | Neurosurgeons | 2.20 – 2.77 | 0.64 | 1.83 – 3.01 | 0.14 |
| 4 | Medical Students | 1.43 – 5.55 | < 0.001 | 1.18 – 3.81 | <0.001 |
| 5 | MR Technologists | 2.54 – 3.10 | 0.69 | 2.43 – 4.36 | 0.05 |
Figure 3.
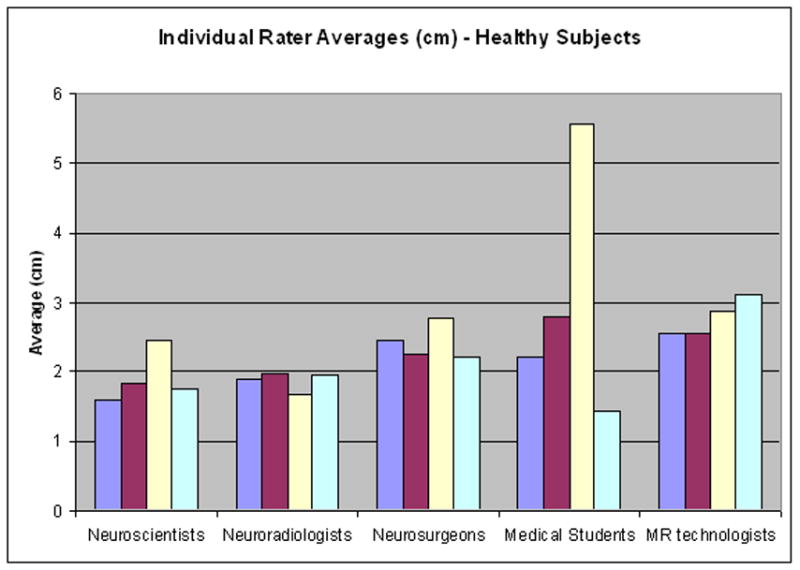
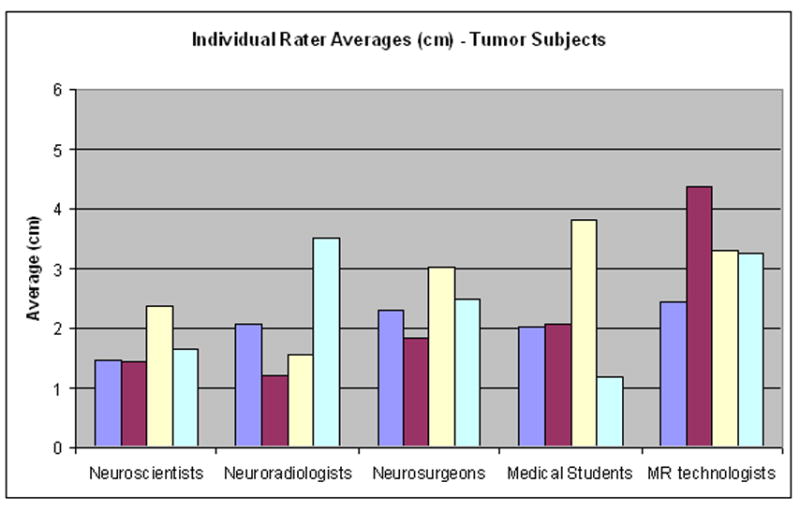
Within group comparison. The mean distance for each individual rater within the groups for both (A) healthy and (B) tumor subjects. Each colored bar represents the average for an individual rater within a group.
Comparison between Healthy Volunteers and Brain Tumor Cases
There were no statistically significant differences in the healthy subjects versus tumor subjects when performance in prediction of functional cortex as measured by absolute distance from center of fMRI activation (p values > 0.05). This is true for each group of raters (see Table 2).
Stratification by ROIs
The differences in performance by group were statistically significant for the Supplementary Motor Area and Primary Auditory Area, but not for the Primary Motor Area. For all of the ROI’s the Neuroscientist and Neuroradiologist groups had the smallest mean absolute distances in both the healthy and tumor subjects (Table 3). The Medical Students and the MR technologists had the largest mean absolute distances for all ROI’s. The mean distance by ROI is as follows: Primary Motor Hand 2.03 cm, Auditory Area 2.06 cm and Supplementary Motor Area 3.18 cm. (Table 5).
Table 5.
Summary Statistics Stratified by Region of Interest
| Region of Interest | Healthy Mean (cm) (95% Confidence Intervals ) | Tumor Mean (cm) (95% Confidence Intervals ) | All Subjects Mean (cm) (95% Confidence Intervals) | |
|---|---|---|---|---|
| 1 | Primary Motor Hand | 1.95 (1.59–2.31) | 2.10 (1.78–2.42) | 2.03 (1.79–2.27) |
| 2 | Auditory Area | 2.10 (1.81–2.40) | 2.00 (1.75–2.26) | 2.06 (1.84–2.29) |
| 3 | Supplementary Motor Area | 3.41 (2.91–3.86) | 2.99 (2.67–3.32) | 3.18 (2.91–3.45) |
Comparison of Planes
The differences in performance were also statistically significant when comparing distance from center in each of the 3 planes (Table 6). The mean distance from center was the smallest in the medial-lateral plane, and the largest in the anterior-posterior plane, for both healthy and tumor subjects. The mean distance by planes for healthy subjects is as follows: Medial-Lateral 0.42 cm, Superior-Inferior 1.04 cm, Anterior-Posterior 1.81 cm. The mean distance by planes for the tumor subjects is as follows: Medial Lateral 0.60 cm, Superior-Inferior 1.13 cm and Anterior-Posterior 1.55 cm.
Table 6.
Summary of Statistics of Plane Comparison
| Plane | Mean ± SD (cm) | ||
|---|---|---|---|
| Healthy Subjects | Tumor Subjects | ||
| 1 | Medial-Lateral | 0.42 ± 0.24 | 0.60 ± 0.56 |
| 2 | Superior-Inferior | 1.04 ± 0.69 | 1.13 ± 0.60 |
| 3 | Anterior-Posterior | 1.81 ± 1.18 | 1.55 ± 0.81 |
Minimum Field of View Analysis
The minimum field of view necessary for capturing the entire fMRI activation was highest for the anterior-posterior direction. This was true for both healthy and tumor subjects for all raters and all ROI’s, with the exception of the Primary Motor Area. The smallest FOV necessary was in the neuroradiologist group. On average, a neuroradiologist would need a FOV of 3.75 x 9 cm (in the M-L and S-I directions) in order to capture an fMRI activation 95% of the time in a healthy subject. For the same fMRI activation, a MR technologist would require a FOV of 5.6 x 12 cm. In tumor subjects, a neuroradiologist would need a 3.75 x 7.5 cm FOV, while a MR technologist would need a 9.38 x 10.5 cm FOV. Table 7 lists the remainder of the FOV sizes at which 95% of the fMRI activation was included when using raters’ predictions as the center of the FOV. Figures 1, 2 and 4 illustrate sample data for the FOV analysis.
Table 7.
Field of View (FOV) at which greater than 95% of fMRI activation Included Using Raters Predictions as Center of FOV
| Rater Group | FOV (cm) | ||||||
|---|---|---|---|---|---|---|---|
| Medial-Lateral | Superior-Inferior | Anterior-Posterior | |||||
| Healthy Subjects | Tumor Subjects | Healthy Subjects | Tumor Subjects | Healthy Subjects | Tumor Subjects | ||
| 1 | Neuroscientists | 4.69 | 4.69 | 12 | 10.5 | 13.5 | 12 |
| 2 | Neuroradiologists | 3.75 | 3.75 | 9 | 7.5 | > 15 | 15 |
| 3 | Neurosurgeons | 4.69 | 5.63 | 10.5 | 9 | > 15 | 15 |
| 4 | Medical Students | 4.69 | 4.69 | > 15 | 12 | > 15 | 13.5 |
| 5 | MR Technologists | 5.63 | 9.38 | 12 | 10.5 | > 15 | 15 |
| ROI | |||||||
| 1 | Primary Motor Area (FOV) | 5.63 | 5.63 | 12 | 10.5 | 10.5 | 9 |
| Average size of fMRI activation | 2.19 | 1.52 | 5.85 | 4.32 | 3.84 | 2.79 | |
| 2 | Supplementary Motor Area (FOV) | 3.75 | 5.63 | 12 | 9 | 12 | 15 |
| Average size of fMRI activation | 0.68 | 0.47 | 4.74 | 2.19 | 4.83 | 1.41 | |
| 3 | Primary Auditory Area (FOV) | 4.69 | 4.69 | 9 | 9 | 15 | 15 |
| Average size of fMRI activation | 1.68 | 1.58 | 2.55 | 2.28 | 6.71 | 7.05 | |
Figure 4.
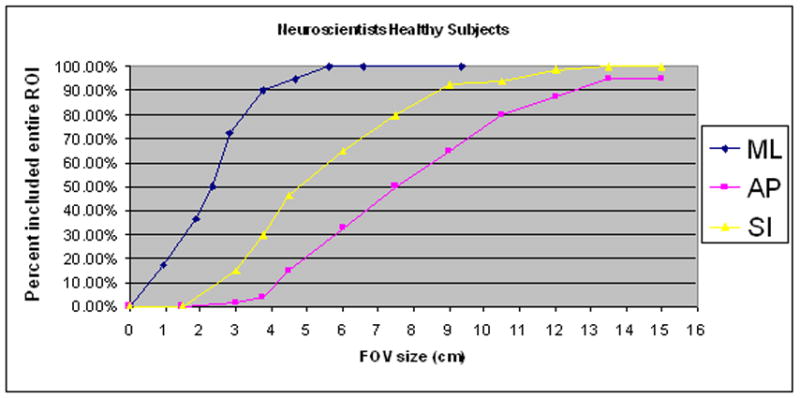
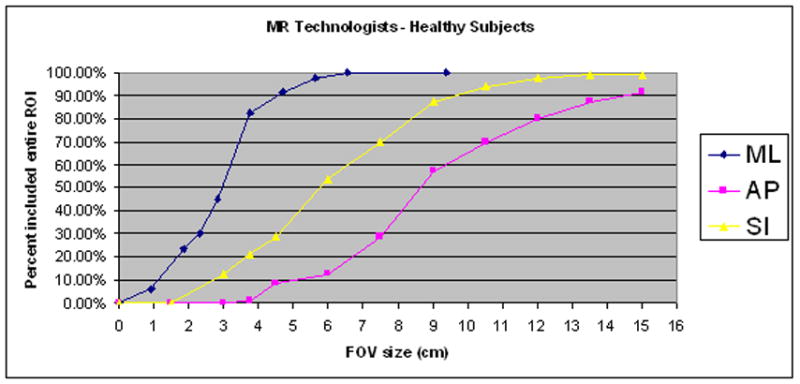
Sample illustrations of percentage of ROI’s included at designated Field of View (FOV) ranges using Rater’s predictions as the center of the FOV. (A) Neuroscientist group in healthy subjects (B) MR Technologists in healthy subjects.
Discussion
In this study we aimed to investigate how well a specific functional region-of-interest can be predicted without prior knowledge of an individual subject’s functional anatomy. In particular, we evaluated how well different groups who are the most likely to perform fMRI examinations are able to make these predictions. The primary finding is that, in general, regardless of the experimenter’s degree of experience, the location of specific eloquent areas cannot be predicted with a high degree of accuracy based on anatomical information alone. As seen in Table 2, the distance between the predicted center of activation and the actual detected center of activation was more than 3 cm for some raters (in the medical student and MR technologist groups) and it was just under 2 cm for the best performing raters (neuroscientists and neuroradiologists).
These results have direct practical implications for an fMRI experiment in which one wishes to target a specific region-of-activation with a reduced-volume acquisition. To insure that the entire region-of-activation is included in the reduced scan volume, the extent of the field-of-view (FOV) parameters should be set at the expected size of the activation plus at least twice the average targeting error of the experimenter. For even the most experienced and accurate experimenters, then, the FOV should be 4 to 5 centimeters larger than the actual activation region. In the case that the experimenter is less expert in identifying functional anatomy, e.g. is a research assistant or technologist who scored poorly in our evaluation, the FOV parameters would need to be set as much as 10 cm more than the expected size of the region-of-activation. These results strongly suggest that, based on anatomical images and a general knowledge of functional neuroanatomy, one can only expect to safely capture regions-of-activation with reduced-volume activations with very crude tuning of the FOV parameters. For example, reducing a FOV by a factor of 2 or greater has a significant chance of causing one to miss portions of the region of activation. Figure 4 graphically demonstrates this point. Figures 4A and 4B are plots (for each direction independently) of the percentage of activated regions that would be fully covered if a reduced FOV were prescribed by a Neuroscientist or a MR technologist. To generate data points for a specific FOV setting, we recorded, for each ROI and each subject dataset, whether or not the activated region would be fully covered if a FOV of the given size were centered at the location predicted by the technologists. In the AP direction (y), only when the FOV was set at 12cm would the technologists succeed 80% of the time in fully capturing the activated region. The neuroscientists would be slightly more successful, but would still require an FOV set to 10.5 cm to acquire the entire fMRI activation at the same rate. Though results vary depending on rater group and on ROI, we found that the minimum FOV was usually at least 10cm in one of the three directions (i.e. about one half of the typical FOV for neuroimaging).
The finding of this report that the location of eloquent areas cannot be predicted accurately based only on anatomical information tends to argue for the use of a scout fMRI scan [25] or a multi-staged approach [26] when performing reduced FOV fMRI acquisitions. The basic idea of these approaches is to acquire whole-brain fMRI data at low resolution in an initial mapping stage prior to targeting a region-of-interest at high resolution. These approaches eliminate the guesswork, permitting reduced FOV parameters to be set optimally for the targeted region. There is, however, the possibility that the scout scan fails to detect the activation and there is some overhead associated with the additional scans. The use of real-time processing would be helpful in this context, therefore, in order to insure that the scout scan continues until activation is seen and that the acquisition is only as long as necessary for localization.
When used for surgical planning purposes (as mentioned above), high spatial resolution is desirable in order to ensure that the boundaries of eloquent cortex are clearly defined in order to prevent compromising eloquent tissue during tumor resection. Studies have shown that brain tumors can directly border on or be deeply involved with functional brain tissue [27–29]. However, most current fMRI protocols used for surgical planning have spatial resolution parameters that are inadequate for unambiguous localization of cortical activations near tumors and other relevant anatomy [13]. A recent study from our group found uncertainty regarding activations significant enough to influence surgical decisions even with a spatial resolution of 3.75 × 3.75 × 4 mm3, which is higher than that used in many fMRI data acquisitions [13]. At typical resolutions used in fMRI, activations often appear to extend into white matter and CSF and to cross sulcal gaps. We found that isotropic spatial resolution on the order of 2 × 2 × 2 mm3 was the minimum required to unambiguously locating activation in the cortex. As stated in the introduction, to practically achieve this level of spatial resolution while minimizing the loss of sensitivity in detecting activation, the volume covered during scanning must be decreased [13, 30]. The efficiency of the reduced-volume acquisition is improved by accurate targeting, such as with a scout scan.
It might be argued that, for surgical planning prior to tumor resection, one is only interested in mapping activation in the vicinity of a tumor, thus, it is not that important to predict activation location a priori. However, in the event that no activation is located in the area around the tumor, one is left not knowing if activation is located elsewhere or the experiment simply failed to detect the activation within the targeted region. We would argue that in all cases the fMRI experiment should be designed to fully map the full extent of the eloquent area. This study shows that, if a reduced brain volume is to be sampled, FOV parameters must be set very conservatively if targeting of the activation is based only on knowledge of functional anatomy. Although the presence of an “expert” will improve targeting accuracy, we would still argue for prudence in setting the FOV. In general, if a reduced-volume acquisition is desired to achieve more efficient mapping of a specific region, some form of real-time adaptive or scout approach should be considered.
The identification of eloquent cortex is essential when planning interventions for brain lesions. Functional Magnetic Resonance Imaging (fMRI) is being used as a means to localize eloquent cortex in patients with brain tumors and other lesions [1–13]. The results of this study strengthen the rationale for using fMRI as an additional modality for planning neurosurgical procedures. The data confirm our hypothesis that even “experts” in neuroanatomy perform poorly when attempting to predict the location of functional cortex. While electrical stimulation of the brain can be used to locate eloquent cortex during awake surgery, knowledge of functional neuroanatomy is used to plan a surgical approach prior to the procedure. While the raters in the current study who could be expected to be involved in interpreting MR images for surgical planning (i.e. neurosurgeons and neuroradiologists) performed marginally superior to the non-expert raters, their best performance would be unacceptable for surgical planning. An error of 2 centimeters would not be satisfactory for planning a neurosurgical approach. Specifically, the results of this study argue that presurgical planning and potentially intraoperative cortical mapping (a highly invasive, technically demanding, and limited in its availability technique) may be achieved more accurately with the addition of pre-operative fMRI (a non-invasive and potentially widely available technique).
The impact of the above observations on surgical planning has been suggested by some recent studies which reported modification in patient management and surgical approach based on fMRI results [23, 24]. The change in plan could be attributed to unexpected information gained from fMRI as a result of abnormal patterns of functional activation in patients with altered neuroanatomy due to brain lesions. In other words, fMRI could have provided more information for the treatment team not because they could not accurately predict normal functional neuroanatomy, but because they could not accurately predict abnormal functional neuroanatomy. However, the poor performance of our raters in both healthy volunteers and in tumor patients argues against this. Contrary to expectation, the raters performed similarly in both healthy and tumor subjects. The overall conclusion is that regardless of the presence or absence of distorted anatomy, medical personnel perform poorly when asked to use anatomic information to predict the location of eloquent cortex. Not surprisingly, the results of this study essentially underscore the observation that while functional neuroanatomy is based on data gathered from large populations of people, it is insufficient when applied to individuals.
In addition to supporting the use of fMRI for surgical planning, our results support the argument for routine use of fMRI in wider clinical settings. As stated above, all of the raters performed poorly when attempting to predict the location of functional anatomy using anatomical MR images, regardless of training or years of experience. This serves as a cautionary note to clinicians who often decide if an intracranial lesion is operable based on anatomical location alone. It is well known that functional anatomy is quite variable from individual to individual. Apart from these individual differences, however, our study demonstrates further that experienced clinicians may vary considerably as to the location of functional areas even in the same individual. This would argue for the addition of functional imaging in clinical practice when evaluating patients with intracranial lesions. In further support of this conclusion, as reported in the studies cited above, some patient management decisions were changed after patients underwent pre-surgical fMRI. Unfortunately, if a patient is already determined to be inoperable on the basis of an evaluation of anatomical MR images, the patient is then unlikely to undergo further evaluation with fMRI. Therefore, functional imaging should be routinely performed to aid in decisions of operability. This study suggests that fMRI may be a useful clinical adjunct to help guide deployment of further interventions and studies (such as intracranial mapping) and this conclusion may be extrapolated to pathology other than operable lesions. While further clinical studies are obviously necessary to determine the value of fMRI in surgical and non-surgical clinical settings, this supports a cautious approach when making definitive statements to patients regarding prognosis or expectations of functional deficits based on anatomical location alone.
In summary, this study emphasizes the difficulty in accurately interpreting anatomical images with respect to specific functional areas of cortex. While medical personnel with extensive experience tended to perform better than non-experts, in general none of the groups in this study were able to predict location with the resolution typically desired for operative planning. These results have implications for the technical aspects of acquiring fMRI data, but more importantly emphasize the potential benefits of using fMRI for wider clinical applications. While this is not a study of the impact of fMRI on clinical decision-making, we feel that our results support caution when discussing prognosis or potential functional deficits with patients strictly based on anatomical imaging. Further studies should be done to explore the whether fMRI can actually benefit clinical outcomes, both surgically and medically.
Footnotes
Source of Support: This research was supported by the following: AJ Golby, LP Panych, SS Yoo and KH Zou partially supported by NIH U41RR019703. LP Panych and SS Yoo partially supported by NIH grant RO1NS37992. SS Yoo partially supported by Korean Ministry of Commerce, Industry, and Energy Grant (#2004-02012). KH Zou is partially supported by NIH R01LM007861. HK Rolls partially supported by the Harvard Medical School PASTEUR Program and Office of Enrichment Programs.
Publisher's Disclaimer: This is a PDF file of an unedited manuscript that has been accepted for publication. As a service to our customers we are providing this early version of the manuscript. The manuscript will undergo copyediting, typesetting, and review of the resulting proof before it is published in its final citable form. Please note that during the production process errors may be discovered which could affect the content, and all legal disclaimers that apply to the journal pertain.
References
- 1.Jack CR, Jr, Thompson RM, Butts RK, et al. Sensory motor cortex: correlation of presurgical mapping with functional MR imaging and invasive cortical mapping. Radiology. 1994;190:85–92. doi: 10.1148/radiology.190.1.8259434. [DOI] [PubMed] [Google Scholar]
- 2.Puce A, Constable RT, Luby ML, et al. Functional magnetic resonance imaging of sensory and motor cortex: comparison with electrophysiological localization. J Neurosurg. 1995;83(2):262–270. doi: 10.3171/jns.1995.83.2.0262. [DOI] [PubMed] [Google Scholar]
- 3.Yousry TA, Schmid UD, Jassoy AG, et al. Topography of the cortical motor hand area: prospective study with functional MR imaging and direct motor mapping at surgery. Radiology. 1995;195:23–29. doi: 10.1148/radiology.195.1.7892475. [DOI] [PubMed] [Google Scholar]
- 4.Atlas SW, Howard RS, 2nd, Maldjian J, et al. Functional magnetic resonance imaging of regional brain activity in patients with intracerebral gliomas: findings and implications for clinical management. Neurosurg. 1996;38(2):329–338. doi: 10.1097/00006123-199602000-00019. [DOI] [PubMed] [Google Scholar]
- 5.Mueller WM, Yetkin FZ, Hammeke TA, et al. Functional magnetic resonance imaging mapping of the motor cortex in patients with cerebral tumors. Neurosurgery. 1996;39(3):515–520. doi: 10.1097/00006123-199609000-00015. discussion 520–521. [DOI] [PubMed] [Google Scholar]
- 6.Pujol J, Conessa G, Deus J, et al. Presurgical identification of the primary sensorimotor cortex by functional magnetic resonance imaging. J Neurosurg. 1996;84:7–13. doi: 10.3171/jns.1996.84.1.0007. [DOI] [PubMed] [Google Scholar]
- 7.Bittar RG, Olivier A, Sadikot AF, Andermann F, Pike GB, Reutens DC. Presurgical motor and somatosensory cortex mapping with functional magnetic resonance imaging and positron emission tomography. J Neurosurg. 1999;91:915–921. doi: 10.3171/jns.1999.91.6.0915. [DOI] [PubMed] [Google Scholar]
- 8.Fandino J, Kollias SS, Wieser HG, Valavanis A, Yonekawa Y. Intraoperative validation of functional magnetic resonance imaging and cortical reorganization patterns in patients with brain tumors involving the primary motor cortex. J Neurosurg. 1999;91:238–250. doi: 10.3171/jns.1999.91.2.0238. [DOI] [PubMed] [Google Scholar]
- 9.Roux FE, Boulanouar K, Ranjeva JP, et al. Usefulness of motor functional MRI correlated to cortical mapping in Rolandic low grade astrocytomas. Acta Neurochir. 1999;141(1):71–79. doi: 10.1007/s007010050268. [DOI] [PubMed] [Google Scholar]
- 10.Hirsch J, Ruge MI, Kim KH, et al. An integrated functional magnetic resonance imaging procedure for preoperative mapping of cortical areas associated with tactile, motor, language, and visual functions. Neurosurg. 2000;47(3):711–721. doi: 10.1097/00006123-200009000-00037. discussion 721, 722. [DOI] [PubMed] [Google Scholar]
- 11.Krings T, Schreckenberger M, Rohde V, et al. Metabolic and electrophysiological validation of functional MRI. J Neurol Neurosurg Psychiatry. 2001;71(6):762–771. doi: 10.1136/jnnp.71.6.762. [DOI] [PMC free article] [PubMed] [Google Scholar]
- 12.Roux FE, Ibarrola D, Tremoulet M, et al. Methodological and technical issues for integrating functional magnetic resonance imaging data in a neuronavigational system. Neurosurg. 2001;49:1145–1156. doi: 10.1097/00006123-200111000-00025. [DOI] [PubMed] [Google Scholar]
- 13.Yoo S-S, Talos I, Golby AJ, Black PM, Panych LP. Evaluating requirements for spatial resolution of fMRI for neurosurgical planning. Human Brain Mapping. 2004;21:34–43. doi: 10.1002/hbm.10148. [DOI] [PMC free article] [PubMed] [Google Scholar]
- 14.Wei X, Yoo S-S, Dickey CC, Zou KH, Guttmann CR, Panych LP. Functional MRI of auditory verbal working memory: long-term reproducibility analysis. Neuroimage. 2004;21(3):1000–8. doi: 10.1016/j.neuroimage.2003.10.039. [DOI] [PubMed] [Google Scholar]
- 15.Yoo S-S, Wei X, Dickey CC, Guttmann CR, Panych LP. Long-term reproducibility analysis of fMRI using hand motor task. Int J Neurosci. 2005;115(1):55–77. doi: 10.1080/00207450490512650. [DOI] [PubMed] [Google Scholar]
- 16.Yoo S-S, O'Leary HM, Dickey CC, et al. Functional asymmetry in human primary auditory cortex: identified from longitudinal fMRI study. Neurosci Lett. 2005;383(12):16. doi: 10.1016/j.neulet.2005.03.025. [DOI] [PubMed] [Google Scholar]
- 17.Friendly M, Franklin PE, Hoffman D, Rubin DC. The Toronto Word Pool: Norms for imagery, concreteness, orthographic variables, and grammatical usage for 1,080 words. Behav Res Methods. 1982;14:375–399. [Google Scholar]
- 18.Bookheimer S. Functional MRI of language: new approaches to understanding the cortical organization of semantic processing. Annu Rev Neurosci. 2002;25:151–88. doi: 10.1146/annurev.neuro.25.112701.142946. [DOI] [PubMed] [Google Scholar]
- 19.Mattay VS, Callicott JH, Bertolino, et al. Hemispheric control of motor function: a whole brain echo planar fMRI study. Psychiatry Res. 1998;83(1):7–22. doi: 10.1016/s0925-4927(98)00023-7. [DOI] [PubMed] [Google Scholar]
- 20.Brannen JH, Badie B, Moritz CH, Quigley M, Meyerand ME, Haughton VM. Reliability of functional MR imaging with word-generation tasks for mapping Broca's area. Am J Neuroradiol. 2001 Oct;22(9):1711–8. [PMC free article] [PubMed] [Google Scholar]
- 21.Schlosser MJ, Aoyagi N, Fulbright RK, Gore JC, McCarthy G. Functional MRI studies of auditory comprehension. Hum Brain Mapp. 1998;6(1):1–13. doi: 10.1002/(SICI)1097-0193(1998)6:1<1::AID-HBM1>3.0.CO;2-7. [DOI] [PMC free article] [PubMed] [Google Scholar]
- 22.Shaywitz SE, Shaywitz BA, Pugh KR, et al. Functional disruption in the organization of the brain for reading in dyslexia. Proc Natl Acad Sci U S A. 1998 Mar 3;95(5):2636–41. doi: 10.1073/pnas.95.5.2636. [DOI] [PMC free article] [PubMed] [Google Scholar]
- 23.Medina LS, Bernal B, Dunoyer C, et al. Seizure disorders: functional MR imaging for diagnostic evaluation and surgical treatment--prospective study. Radiology. 2005;236(1):247–53. doi: 10.1148/radiol.2361040690. [DOI] [PubMed] [Google Scholar]
- 24.Zotta D, Di Rienzo A, Scogna A, Ricci A, Ricci G, Galzio RJ. Supratentorial cavernomas in eloquent brain areas: application of neuronavigation and functional MRI in operative planning. J Neurosurg Sci. 2005;49(1):13–9. [PubMed] [Google Scholar]
- 25.Goodyear BG, Gati JS, Menon RS. Real-time interactive MRI on a conventional scanner. Magn Reson Med. 1997;38:183–186. doi: 10.1002/mrm.1910380303. [DOI] [PubMed] [Google Scholar]
- 26.Yoo S-S, Guttmann CR, Zhao L, Panych LP. Real-time adaptive functional MRI. Neuroimage. 1999;10:596–606. doi: 10.1006/nimg.1999.0494. [DOI] [PubMed] [Google Scholar]
- 27.Ojemann JG, Miller JW, Silbergeld DL. Preserved function in brain invaded by tumor. Neurosurg. 1996;39:253–258. doi: 10.1097/00006123-199608000-00003. [DOI] [PubMed] [Google Scholar]
- 28.Skirboll SS, Ojemann GA, Berger MS, Lettich E, Winn HR. Functional cortex and subcortical white matter located within gliomas. Neurosurg. 1996;38:678–684. [PubMed] [Google Scholar]
- 29.Schiffbauer H, Ferrari P, Rowley HA, Berger MS, Roberts TPL. Functional activity within brain tumors: a magnetic source imaging study. Neurosurg. 2001;49:1313–1321. doi: 10.1097/00006123-200112000-00005. [DOI] [PubMed] [Google Scholar]
- 30.Yoo S-S, Guttmann CR, Panych LP. Multiresolution data acquisition and detection in functional MRI. Neuroimage. 2001;14:1476–1485. doi: 10.1006/nimg.2001.0945. [DOI] [PubMed] [Google Scholar]