

Abstract
The zebrafish has been a popular subject of embryology and genetic research for the past three decades. Recently, however, the interest in its neurobiology and behavior has also increased. Nevertheless, compared to other model organisms, e.g., rodents, zebrafish behavior is understudied and very few behavioral paradigms exist for mutation or drug screening purposes. Alcoholism is one of the biggest and costliest diseases whose mechanisms are not well understood. Model organisms such as the zebrafish may be utilized in this line of research. Previously, we investigated the effects of acute ethanol exposure on adult zebrafish using four behavioral paradigms and employing manual quantification methods. Here, we study the effects of chronic ethanol exposure and analyze how it modifies the effects of acute ethanol treatment. We employ a videotracking-based automated quantification method in a predator model paradigm and show that this method is capable of detecting an avoidance reaction that is ameliorated by higher doses of ethanol, a potential anxiolytic effect. Importantly, we also demonstrate that chronic, two week long, exposure to ethanol results in significant adaptation to this substance in adult zebrafish. Overall, our results suggest that zebrafish will be an appropriate subject for high throughput screening applications aimed at the analysis of the mechanisms and pharmacology of acute and chronic ethanol induced changes in the vertebrate brain.
Keywords: adaptation, alcohol, anxiety, ethanol, zebrafish
INTRODUCTION
Although the zebrafish has been a popular subject of research in the past three decades, especially in developmental biology and genetics, its brain function and behavior have not been well studied compared to that of classical laboratory model organisms including the rat, the mouse, or the fruit fly (for review see Sison et al. 2006). Nevertheless, the recent years have seen an exponential increase of the number of publications in the fields of animal psychology and behavioral neuroscience using zebrafish (reviewed by Sison et al., 2006). The main reason for the interest in this species is that it appears to be an ideal organism for high throughput screening applications, e.g., mutagenesis screening or drug discovery efforts. Zebrafish are small (4 cm long) and prefer swimming in groups (shoaling), so large numbers of subjects can be housed in small laboratory rooms. Their eggs are fertilized and develop externally, and a single female can produce 200 offspring every other day. Zebrafish take up hydrophilic substances easily from the water (through the gills and the entire body surface). Furthermore, the basic layout of their brain is not fundamentally different from the typical vertebrate brain (Tropepe & Sive, 2003). Given the DNA sequence homologies found between zebrafish genes and other vertebrate genes including those of mammals (for ethanol metabolism related genes see, for example, Lassen et al., 2005; Reimers et al., 2004) and given the anatomical similarities among vertebrate brains, it has been argued that mechanisms of complex functional properties of the mammalian brain may be modeled and investigated using this species (e.g., Gerlai, 2003; Tropepe & Sive, 2003). Furthermore, it has also been argued (see e.g., Blaser & Gerlai, 2006) that behavioral analysis is perhaps the best and most objective method with which one can study the function of the brain and thus discover mutation or drug induced changes in this organ. In summary, due to the ease with which mutations may be generated and identified in this species, to its prolific nature, and to the fact that large number of mutants may be housed cheaply and tested rapidly, we argue that zebrafish will be a useful model organism with which the mechanisms of ethanol effects on vertebrate brain function may be studied. However, we also argue there is a serious bottle neck for forward genetic approaches or drug screening applications as the behavior of zebrafish is not well characterized. Briefly, there is a significant need for the understanding of the behavior of zebrafish and for the development of appropriate behavioral testing tools.
Previously, we have studied the effects of acute ethanol exposure on zebrafish behavior. We developed four simple behavioral test paradigms in which we showed significant behavioral changes induced by acute ethanol treatment (Gerlai et al., 2000). We argued that the simplicity of these paradigms and their ability to detect acute ethanol induced behavioral changes should make them useful for high throughput screening. However, the behavioral quantification methods we employed were manual, i.e., they required the presence of a human observer, a method that is time consuming and labor intensive.
Recently, we completed a study in which we compared two manual recording methods with a computer aided automated quantification approach, videotracking (Blaser & Gerlai, 2006). The results of this study showed that the computerized videotracking approach could detect test paradigm dependent behavioral changes with high precision. In this latter methodological study the effects of ethanol were not tested. Furthermore, it is not known how chronic ethanol exposure may alter behavior of zebrafish in these test paradigms.
Our current study is aimed at addressing these questions. Here we employ a 4 × 2 design with which we analyze the effects of acute ethanol exposure (one control fresh water and three ethanol acute treatment groups) and whether chronic ethanol treatment (one control fresh water and one chronic ethanol exposure group) interacts with or modifies the acute ethanol effects. Importantly, we now quantify the behavior of zebrafish using the videotracking procedure and thus test the question whether our automated computerized behavioral quantification method is capable of detecting acute and chronic alcohol induced changes in the behavior of zebrafish.
METHODS
Experimental design & ethanol administration procedure
We employed a 4 × 2 experimental design with four acute ethanol exposure conditions and two chronic ethanol exposure conditions. The acute conditions consisted of one freshwater control group and three acute ethanol dose groups, the latter exposed to one of the following concentrations of ethanol solutions: 0.25%, 0.50%, and 1.00% (where % represents volume/volume percentage). The two chronic exposure conditions included one freshwater group and one group exposed chronically to 0.25% ethanol. The eight resulting groups will be referred to as Group C0.00-A0.00 (n = 14), Group C0.00-A0.25 (n = 14), Group C0.00-A0.50 (n = 14), Group C0.00-A1.00 (n = 14), Group C0.25-A0.00 (n = 13), Group C0.25-A0.25 (n = 12), Group C0.25-A-0.50 (n = 12) and Group C0.25-A1.00 (n = 13), where C represents chronic treatment, A represents acute treatment, and the number represents the concentration of alcohol used in each treatment. The four acute ethanol doses corresponded to previously employed ethanol concentrations (Gerlai et al., 2000). The concentration of the ethanol solution for chronic treatment (0.25%) was based upon our pilot studies, and was half the concentration employed by other experimenters (Dlugos & Rabin, 2003). The acute ethanol delivery procedure was the same as detailed in Gerlai et al. (2000) in order to keep the results comparable with our previous work. Fish were placed in the ethanol solution for 60 min prior to testing, and habituated and tested in the same concentration in the test tank. This length of acute ethanol exposure was chosen based upon numerous studies conducted with other cyprinids in the literature (cited in Gerlai et al., 2000). Furthermore, Dlugos and Rabin (2003) have since conducted a detailed analysis of ethanol content of the brain of zebrafish after differing lengths of exposure to 0.50% ethanol. Their results confirmed that after a 60 min ethanol treatment, two populations of zebrafish exhibiting the long fin phenotype reached a brain ethanol level that was not significantly different than those obtained after prolonged (e.g., from 6 to 24 hours) ethanol exposure.
Importantly, the acute treatment procedure (e.g., the origin and quality of the system water and the timing of ethanol delivery, etc.) was identical for all fish. The only difference among acute treatment groups was the concentration of ethanol employed. In addition, according to the 4 × 2 design, fifty percent of these fish were exposed to a 0.25% ethanol solution for two weeks before acute treatment and testing, and the other fifty percent received fresh water. For chronic treatment, mature system water (aged and oxygenated in large water containers for over a week) was mixed with ethanol to achieve the appropriate ethanol concentration. The water of the fish treatment tanks was replaced with this solution once a day. Otherwise, fish were maintained as described below. Fish in the chronic freshwater groups received the same water change procedure but their water contained no ethanol.
Animal housing and maintenance
One hundred and six adult, 5–6 month old, zebrafish (Danio rerio) were tested (50–50% males and females). All fish were purchased from a local vendor (Pets Pacifica, Honolulu, HI) and were of a genetically heterogeneous (randomly bred) stock whose exact origin was not known. The fish exhibited the “long fin” phenotype to a varying degree. The disadvantage of undefined genetic heterogeneity is that such a stock is difficult to use for forward genetic, e.g., random chemical mutagenesis-based, studies (large genetic variability). The advantage of this stock, however, is hybrid vigor, e.g., ease of maintenance, and more importantly, its similarity to natural wild populations in terms of genetic make up and general phenotypical features. That is, the information gained on these fish may extrapolate better to a range of wild type populations bred in the laboratory because they may not possess unique characteristics arising from genetic drift and inbreeding.
First, fish were kept in groups of 20 for two weeks in 40 liter quarantine tanks (50×30×26 cm length × depth × width) and then moved to large 160 liter (90×60×30 cm) home tanks where they were kept in groups of 80 until the experiments started. Thermostat controlled heaters maintained water temperature at 26° Celsius in all tanks and water was filtered by Fluval 204 (small tanks) or Fluval 404 (large tanks) canister filters that contained filter foam (mechanical filtration), activated carbon (removal of organic waste and small particles) and BioMax rings (biological filtration). The fish tanks were illuminated using fluorescent light tubes (20W/tank) switched on at 7:00 and off at 19:00 h. The tanks also received natural light (sunrise around 6:00 and sunset around 19:30 h). Fish were fed twice daily with a 50/50 mix of ground TetraMin flakes (Melle, Germany) and freeze dried krill (Aquatic Ecosystems Inc, Apopka, FL, USA). For the chronic treatment fish were moved to an Aquatic Habitat (AHAB, Aquatic Ecosystems, Inc., Apopka, FL, USA) zebrafish rack system. Here they were housed in groups of 4 in 1.5 liter clear acrylic tanks for the period of the experimental treatment (both the control and the ethanol exposed fish). Filtration of these tanks was disconnected from the main system and instead the fish tanks were individually aerated using air stones attached to air compressors and water was changed daily as described above. The water was kept at the same temperature, the illumination was set at the same level, and the fish were fed the same manner as described above.
Behavioral Test Procedures
The behavior of fish was recorded between 10:00 h and 17:00 h. The test procedures were identical to those described previously (Gerlai et al., 2000). Fish were placed individually into the experimental tank (20×25×12 cm, length × depth × width) and were first habituated to the test tank for 30 min. At the conclusion of the habituation session, the Predator model test (described previously in detail in Gerlai et al., 2000) was started and the fish’s behavior was recorded for 10 min. Upon the conclusion of the test, fish were returned to their home tank and were kept there for future experimentation. A CCD camera (Panasonic WV-CP470) fed the live image (frontal view) into a computer (Dell Dimension 8300, pentium IV) and this image was processed using the EthoVision 3.0 videotracking software (Noldus Info. Tech., Wageningen, The Netherlands). A second camera (also frontal view), a Sony DCR TRV 70 Camcorder, was used as a back up, and this camera recorded the sessions onto MiniDV tapes to be later replayed for manual observation based behavioral quantification.
The test utilized a predator model similar in size and shape to that used before by Gerlai et al. (2000). The model was made of a 50-ml falcon tube that was filled with charcoal and water (and thus appeared black). The model had two plastic “eyes” (diameter 8 mm, white “iris”, and black “pupil”) glued to the conical end of the tube. The model was placed into a stimulus tank adjacent to the experimental tank and was presented by removing grey plastic sheets covering the outside of the left and the right side of the experimental tank. The model was presented only for the first and last 1-minute interval of the 10-minute test session. We noticed that the appearance of stimuli such as the predator model was the most effective way to elicit behavioral responses and repeated presentation of the model allowed us to compare behavioral responses in its presence and in its absence. During predator model presentation, the model was moved using a transparent plastic rod attached to its back in a consistent manner following an up and down movement trajectory. The positioning of the stimulus presentation was randomized according to left vs. right side of the experimental tank across multiple subjects. Antipredatory behavior of zebrafish is believed to be adaptive thus likely to be under the influence of genetic factors (Gerlai, 1993; Csányi, 1986). Furthermore, behavioral responses elicited by a predator model were shown to be dependent upon level of exposure to ethanol independent of sedative or stimulating effects on locomotor activity suggesting that the paradigm is capable of detecting fear reducing effects of substances including those of ethanol (Gerlai et al., 2000). The above suggests that predator elicited responses are phenotypical characteristics that when tested will allow the detection of mutation or pharmaceutical agent induced functional changes in the brain.
Videotracking-based behavioral quantification
Behavior of the experimental fish was quantified using the automated videotracking method (Blaser & Gerlai, 2006) with the EthoVision Color Pro (version 3.0) software (Noldus, Wageningen, The Netherlands). This approach has allowed quantification of swim path characteristics of zebrafish precisely and without the need for the experimenter to view video-tapes (Blaser & Gerlai, 2006). The EthoVision software was configured to accept live input from a video camera fed directly into the computer through a piccolo video card. Before each test, a background image was recorded of the empty experimental tank. After placing the subject in the tank, the program compared each incoming image sample (at a 10 Hz image rate) to the original background, a subtraction method of stimulus detection whereby the pixel values of each new sample image were subtracted from those of the background image. Detection threshold levels, the minimum difference between the values of pixels accepted by the computer, were also set to minimize environmental noise (from water droplets, reflections, bubbles, etc). An additional detection criterion, “minimum surface area” was also employed: it was defined as the number of adjacent pixels with differences above a set noise threshold (minimum of 25 pixels). The pixel cluster above this minimum was interpreted as the target subject, and the X,Y coordinates of the center of this subject were recorded. Tracks were recorded for the full 10 minutes of the test period.
The following parameters were quantified. Distance from stimulus: the distance of the experimental fish from the glass wall of its test tank adjacent to the stimulus tank containing the predator model was recorded every 0.10 sec and the mean of these distance values was calculated for 1-minute intervals. Note that the stimulus (the predator model) was presented at the same side for a given experimental fish but the side randomly changed among experimental fish. Path length: To quantify locomotor activity, the total distance moved by the experimental fish (swim path length) was recorded and is analyzed for 1-minute intervals and also for the total session length. Quantification of all measures was conducted after calibration of EthoVision by inputting the actual dimensions of the test tank and thus results are expressed in cm.
Observation-based event recording
Computerized videotracking allows behavioral quantification without a need for a human observer to judge and record behavior. However, it is notable that although automated and precise, videotracking may not be capable of quantifying all postural or motor patterns zebrafish exhibit. Given that we did not expose fish chronically to ethanol in prior experiments, and we did not know what behavioral changes, if any, would ensue, we decided to also visually observe all fish throughout the recording session. All sessions were recorded onto MiniDV tapes using a Sony Camcorder (DCR TRV 70) and the video-recordings were later replayed on a Sony DSR-11 digital cassette player connected to the Dell computer. This set up allowed the temporal synchronization of the time code on tape with the computer’s clock and facilitated the precise quantification of behavioral events using the Observer Color Pro event recording software (Noldus Info. Tech., Wageningen, The Netherlands). Briefly, the Observer software turns the computer into a multi-channel stop watch that a human experimenter can then use to measure the frequency and duration of a virtually unlimited number of behavioral events. Here we quantified certain motor and posture patterns (see e.g., Blaser & Gerlai, 2006; also see Gerlai & Csányi, 1990).that may not be detectable for videotracking including the following behavioral units: Freezing: a motionless state during which only the gills and occasionally the eyes may move. It mostly occurs while the fish is on the bottom, in a corner, or right below the water surface. Erratic movement: fast (more than 3 cm/sec swim speed) and seemingly aimless zig-zagging with frequent changes of the direction of swimming. It often occurs in the bottom of the tank but can be seen in mid-water as well. Creeping: slow (less than 1 cm/sec speed) movement during which the caudal dorsal and anal fins are motionless and only the pectoral fins beat. Most often observed after freezing and/or erratic movement. Leaping: fast jump with the use of the caudal fin. Notably, these behavioral units are normally observed under fear inducing conditions (Gerlai et al., 2000). In addition to these behaviors, we monitored our fish for potential signs of ethanol induced abnormalities including, Paralysis (as in freezing but while in an abnormal posture, e.g., laying on the side or floating upside down or standing vertically) and Seizures (tonic or clonic rhythmic movements). For leaping we calculated the frequency and for the other behaviors we calculated and analyzed the duration of time relative to session or to interval length (%).
Statistical analysis
Data were analyzed using the SPSS (version 14.0 for the PC) statistical software package. Repeated measure variance analysis (ANOVA) was employed with session interval (ten 1-minute intervals of the behavioral recording session) as the repeated measure (within subject) factor. The between subject factor Gender was also investigated. No gender effects or gender interaction terms were found to be significant and gender is pooled in all analyses presented. The between subject factors Chronic treatment (two levels: 0.00% and 0.25% ethanol) and Acute treatment (four levels: 0.00%, 0.25%, 0.50%, and 1.00% ethanol) were analyzed. If no Session interval × Ethanol treatment interaction was found, Chronic and Acute Treatment main effects were analyzed using univariate ANOVA. In case of significant results, post hoc Tukey Honestly Significant Difference (HSD) tests or T tests were used as appropriate. When required (variance homogeneity) scale transformation (logarithm) was conducted before statistical analysis as indicated below.
RESULTS
Fish exposed to either acute, chronic, or the combination of acute and chronic ethanol treatment exhibited no abnormalities in their posture or motor patterns (data not shown). For example, paralysis or seizures or any other abnormalities were not observed in ethanol exposed fish suggesting that even the two week long chronic ethanol exposure (at the currently employed dose of 0.25%), or the highest acute dose (1.00%), was not deleterious to the fish.
The predator model paradigm is expected to induce fear responses. These responses are expected to be strongest when the predator model stimulus is present. Although the experimental fish were extensively habituated to the test environment before the recording commenced, handling and the novel nature of the experimental tank itself may also have elicited fear responses. To investigate this, we recorded and analyzed motor and posture patterns that are known to be exhibited under fear inducing conditions. These included leaping, erratic movement, creeping, and freezing (see e.g., Gerlai & Csányi, 1990; Csányi, 1986). Importantly, these behaviors were virtually absent during the absence of the predator model stimulus (time interval 2–9 min) suggesting that the test environment alone had no aversive effect on the zebrafish, even though the fish were tested singly (see Figure 1). Furthermore, chronic and acute ethanol treatment had no significant effect on erratic movement and freezing (their interaction terms ‘acute × chronic treatment’, ‘acute × session interval, ‘chronic × session interval and ‘acute × chronic × session interval’ were also non-significant). Thus we pooled the ethanol treatment data for these behaviors and only show the session interval results in Figure 1. Significant changes across session intervals were found for Erratic movement (ANOVA F(9, 855) = 1.92, p < 0.05) but this behavior occurred extremely rarely (less than 0.5% of the time). Freezing did not change significantly across session intervals (F(9, 855) = 1.26, p > 0.05), and again occurred for very short periods of time (ranging from 1.8% to 0% of the time from interval to interval). Creeping was not observed and thus is not statistically analyzed. Leaping, however, occurred consistently, but only in response to the appearance of the predator. Furthermore, the increase in leaping elicited by the predator model appeared to be ameliorated by administration of ethanol. The acute treatment effects were especially apparent (Figure 2, panels A, B vs. C, D, and panels E, F vs. G, H). ANOVA supported these observations and showed a significant Session interval effect (F9, 855) = 27.09, p < 0.001), a non-significant Acute treatment effect (F(3, 95) = 1.09, p > 0.05), a non-significant Chronic treatment effect (F(1, 95) = 1.19, p > 0.05), but a significant Acute treatment × Session interval interaction (F(27, 855) = 2.28, p < 0.001) and a significant Acute treatment × Chronic treatment × Session interval triple interaction (F(27, 855) = 1.76, p < 0.01). The Chronic treatment × Session interval interaction term was found non-significant (F(9,855) = 1.33, p > 0.05). Perusal of Figure 2 as well as Tukey HSD post hoc comparison analyses show that while at lower acute doses (0% and 0.25%) leaping occurred significantly (p < 0.05) more frequently during the first and last minute of the session, at higher acute doses the difference became non significant. It is also interesting to note that the highest leaping value was obtained in the first minute of recording session for fish in Group C0.25-A0.00 (Tukey HSD, p < 0.05 for comparison of all first min values).
Figure 1.
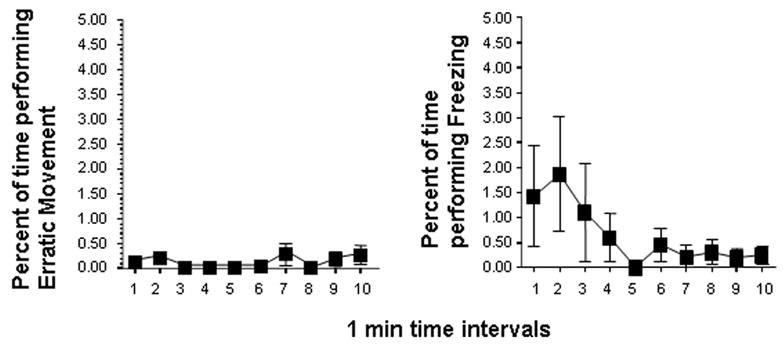
Fear associated behaviors, Erratic movement, Freezing are exhibited rarely during the recording session. Mean ± S.E.M. of Erratic movement and Freezing are shown for 1-minute intervals of the recording session. Sample sizes are given in the Methods section. Note that ethanol treatment (acute or chronic) had no significant effect on these behaviors. Also note that Creeping was completely absent and is not shown.
Figure 2.
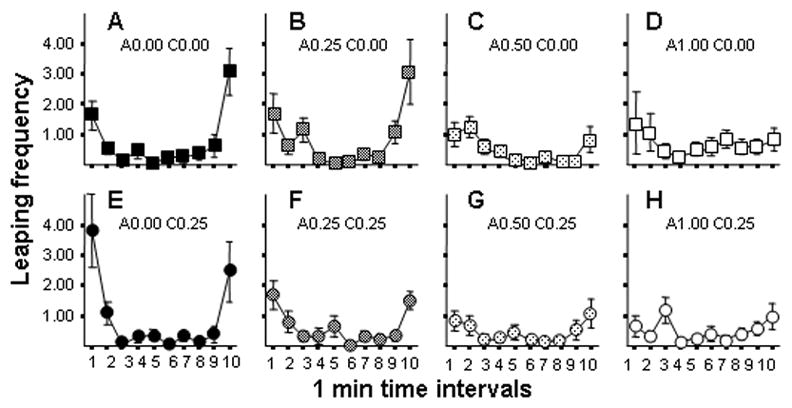
Effects of acute and chronic ethanol exposure on the frequency of Leaping in zebrafish. Panels A–D (square symbols) show fish not treated with chronic ethanol (C0.00 groups). Panels E–H (circle symbols) show fish treated with 0.25% ethanol for two weeks (C0.25 groups). Increasing acute doses are indicated by lighter hatching inside the symbols. The exact acute and chronic ethanol dose is indicated above each panel (‘A’ representing ‘acute’, ‘C’ representing the ‘chronic’ dose). Mean ± S.E.M. are shown. Sample sizes are in the Methods section. Note that the predator model was presented during the first and the last interval. Observe the U-shaped temporal trajectories for Panels A, B, E and F. Note that the flattened temporal response trajectory suggest reduced predator avoidance reaction.
Analysis of videotracking quantified behavioral parameters also showed that ethanol treated fish exhibited significant dose dependent changes in their locomotor activity as well as in the location of swimming in the experimental tank. Figure 3 shows the average distance of the experimental fish from the side of the experimental tank where the predator model (stimulus) was presented during the first and the last minute of the session. The results are shown as performance during 1-minute intervals of the 10-minute session. The temporal trajectories suggest that experimental fish moved away from the stimulus side during the beginning and during the end of the session, i.e., during stimulus presentation, but this response was reduced or abolished in fish exposed to higher acute concentrations of ethanol. ANOVA confirmed these observations and revealed a significant Session interval effect (F(9, 882) = 23.88, p < 0.001), and it also showed a significant Session interval × Acute treatment interaction (F(27, 882) = 6.49, p < 0.001), Session interval × Chronic treatment interaction (F(9, 882) = 2.15, p < 0.05), and a near significant Session interval × Acute treatment × Chronic treatment triple interaction (F(27, 882) = 1.40, p = 0.08). The significant interaction terms confirmed that the temporal changes, i.e., the predator model elicited avoidance reaction, were ethanol dose dependent.
Figure 3.
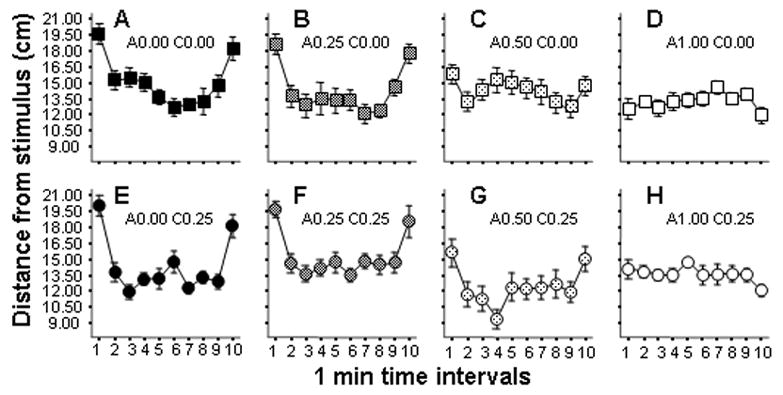
Effects of acute and chronic ethanol exposure on the distance of experimental zebrafish from the predator stimulus tank. Panels A–D (square symbols) show fish not treated with chronic ethanol (C0.00 groups). Panels E–H (circle symbols) show fish treated with 0.25% ethanol for two weeks (C0.25 groups). Increasing acute doses are indicated by lighter hatching inside the symbols. The exact acute and chronic ethanol dose is indicated above each panel (‘A’ representing ‘acute’, ‘C’ representing the ‘chronic’ dose). Mean ± S.E.M. are shown. Sample sizes are in the Methods section. Note that the predator model was presented during the first and the last interval. Observe the U-shaped temporal trajectories for Panels A, B, E and F, and also for Panel G but not for Panels C, D, and H.
The interaction of Session interval with Acute treatment is quite apparent in the graph (Figure 3). Higher acute doses led to a diminished avoidance reaction. First let us consider the results in the chronic freshwater groups (Figure 3, panels A-D). Tukey’s HSD post hoc analysis showed that while in Group C0.00-A0.00 and in Group C0.00-A0.25 (Figure 3, panels A & B) the distance from the stimulus was significantly (p < 0.05) higher in the first and last minute compared to the other intervals, in Group C0.00-A0.50 (Figure 3 panel C) the first and last minute value was significantly smaller than in the lower dose groups and these values only differed (p < 0.05) from the second and the ninth 1-minute interval performance but not the other intervals. The smallest distance values of the first and last minute interval were observed in Group C0.00-A1.00 (Figure 3, panel D) and here these values did not significantly differ (p > 0.05) from the values of any other interval (see Figure 3, Panels A& B vs. D).
Now let us consider the effects of chronic ethanol treatment. The interpretation of the significant interaction term Session interval × Chronic treatment is somewhat complicated in the light of the near significant triple interaction term (Wahlsten, 1990). It appears that Groups C0.00-A0.00, C0.00-A0.25, C0.25-A0.00, And C0.25-A0.25 respond similarly to the predator stimulus, in spite of different chronic treatments (Figure 3 A & B and E & F). All four of these graphs show the U-shaped predator avoidance curve. The trajectories of Group C0.00-A1.00 and Group C0.25-A1.00 are also fairly similar to each other (Figure 3, Panels D & H) as both show a flattened pattern, i.e., diminished response to the appearance of the predator model. Perhaps the only obvious difference between the C0.00 and the C0.25 groups is at the 0.50% acute dose (Figure 3, panels C & G). While Group C0.25-A0.50 (Figure 3, Panel G) shows the typical U-shaped trajectory and Tukey’s HSD confirms that the first and last interval differ from the rest (p < 0.05), Group C0.00-A0.50 does not show this U-shaped pattern (Figure 3, Panel C) and the first and the last interval only differ from the 2nd and the 9th interval but not from the rest. It appears that chronic ethanol exposure attenuated the effect of the acute ethanol exposure in these fish, a possible indication of adaptation as a result of long term exposure to ethanol. As stated above, however, this adaptation effect of the chronic treatment disappears in the highest dose of acute treatment (Figure 3, panel H). This latter finding is not unexpected given that the relative dose difference between the 1% acute dose and the 0.25% chronic dose is quite substantial, i.e., 0.75% (e.g., see effect of 0.50% acute ethanol on chronic freshwater fish, i.e., Fig 3, panel C).
To further analyze the above results, we calculated the distance of fish from stimulus during predator stimulus presentation relative to the distance during no predator stimulus presentation by dividing the average of distance values during stimulus presentation intervals by the average of distance values during no stimulus presentation intervals. This measure is expected to differ from 100 % when fish respond to the presentation of the predator stimulus, but no such difference is expected when they do not respond. A larger than 100 % value reflects fish which avoid the stimulus and a smaller than 100 % value reflects preference of, i.e., swimming closer to, the stimulus. After calculating this measure, we asked the question whether fish in Group C0.00-A0.50 show predator avoidance (increased distance during stimulus presentation vs. no presentation). Using a T-test, we compared the calculated relative distance measure to 100 % and found that in Group C0.00-A0.50 the value did not significantly differ from 100% (mean = 110%, s.e.m. = 5.3, t = 2.0, df = 13, p > 0.05), suggesting that the acute ethanol treatment diminished the predator avoidance reaction to random chance. Interestingly, however, fish in Group C0.25-A0.50 showed a significantly higher than 100% relative distance value (mean = 140 %, s.e.m. = 9.8, t = 3.8, df = 12, p < 0.01), a result that shows these fish continued to avoid the predator model despite the higher acute dose implying adaptation to ethanol.
Adaptation as a result of chronic ethanol treatment is also demonstrated by the analysis of the locomotor activity of our experimental fish. Figure 4 shows the path length (total distance traveled) of fish in all treatment groups. ANOVA of logarithm transformed values revealed a significant Session interval effect (F(9. 882) = 2.29, p < 0.05) suggesting that path length changed across the ten 1-minute intervals of the session. No significant interaction between Session interval and ethanol treatment was found (Session interval × Acute treatment F(27, 882) = 1.45, p > 0.05; Session interval × Chronic treatment F(9, 882) = 0.68, p > 0.05; Session interval × Acute treatment × Chronic treatment F(27, 882) = 1.15, p > 0.05) and thus data were pooled for Session interval. Analysis of Acute treatment showed a significant effect (F(3, 98) = 5.19, p < 0.01) but no significant effect of Chronic treatment was found (F(1, 98) = 1.01, p > 0.05). However, a significant interaction between Acute and Chronic treatments was revealed (F(3, 98) = 2.74, p < 0.05) suggesting that the effect of acute treatment was dependent upon prior chronic exposure to ethanol.
Figure 4.
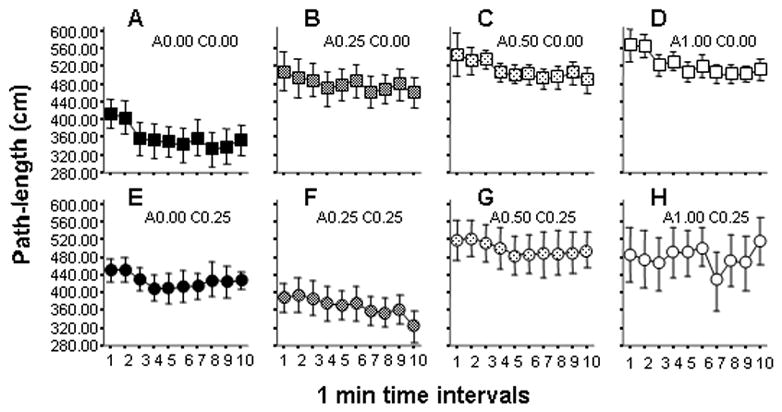
Effects of acute and chronic ethanol exposure on the path length (locomotor activity) of zebrafish. Panels A–D (square symbols) show fish not treated with chronic ethanol (C0.00 groups). Panels E–H (circle symbols) show fish treated with 0.25% ethanol for two weeks (C0.25 groups). Increasing acute doses are indicated by lighter hatching inside the symbols. The exact acute and chronic ethanol dose is indicated above each panel (‘A’ representing ‘acute’, ‘C’ representing the ‘chronic’ dose). Mean ± S.E.M. are shown. Sample sizes are in the Methods section. Note that increasing acute doses lead to an apparent increase in path length in fish not exposed to chronic ethanol (Panels A–D). Also note that this dose response pattern is different in case of chronic ethanol exposed fish as path length is smallest on Panel F.
The interaction between acute and chronic treatments is apparent on Figure 4 but may be even better appreciated by perusing Figure 5 where performance is pooled across session intervals. In general, all C0.00 fish responded to acute ethanol treatment by increasing their activity (Figure 5, Panel A). However, C0.25 fish responded differently (Figure 5, Panel B). Particularly, while fish in Group C0.00-A0.25 showed an increase in activity, fish in Group C0.25-A0.25 showed a corresponding reduction in activity. Post hoc Tukey HSD multiple comparison of the acute treatment groups confirmed these observations. Activity in Group C0.00-A0.00 was significantly lower than in Groups C0.00-A0.25, C0.00-A0.50, C0.00-A1.00 [p < 0.05], but activity in Group C0.25-A0.00 was not significantly different from activity in C0.25-A0.50 or C0.25-A1.00, the latter two of which were significantly higher than in Group C0.25-A0.25 [p < 0.05]. It appears that fish placed in the same ethanol concentration (0.25%) during the experiment as during chronic treatment behaved in the same manner as the fish that were kept in fresh water and placed in fresh water as acute “treatment”. Indeed, comparison of Groups C0.00-A0.00 and C0.25-A0.25 shows no significant difference (t = −0.22, df = 24, p > 0.80). These results suggest that chronic ethanol exposure reduced the hyperactivity inducing effects of acute ethanol treatment, a phenomenon we suggest is due to adaptation to ethanol.
Figure 5.
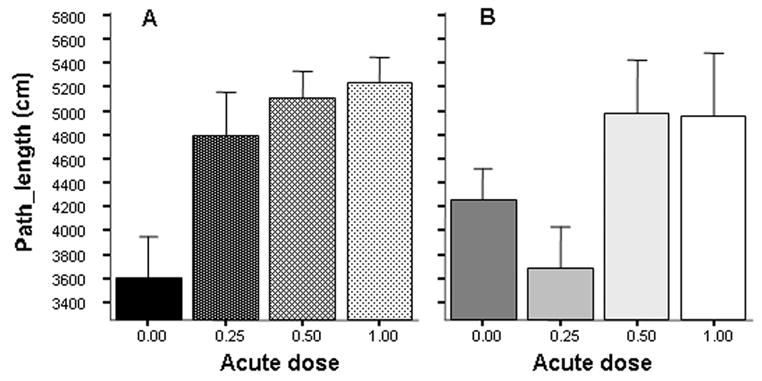
Effects of acute and chronic ethanol exposure on the total path length (locomotor activity) traveled during the 10 min recording session in zebrafish. Panel A shows the results for fish that were not exposed to chronic ethanol (C0.00 groups), and Panel B for fish that received chronic ethanol for two weeks (C0.25 groups). Mean ± S.E.M. are shown. Sample sizes are in the Methods section. Note that the first bar on Panel A (fish that received no ethanol acutely or chronically) is not different from the second bar on Panel B (fish that received 0.25% ethanol both chronically before and acutely during the experiment). Also note the somewhat elevated path length value of the first bar on Panel B (fish that received the 0.25% chronic ethanol treatment but were withdrawn from it one hour before and during the behavioral recording session).
One may also note the somewhat elevated activity level (increased path length value) of Group C0.25-A0.00 relative to Group C0.00-A0.00 (Figure 5 first bar on Panel A vs. first bar on Panel B). Although we could not reject the null hypothesis that withdrawal from 0.25% chronic ethanol in zebrafish leads to no increase of path length (comparison of C0.00-A 0.00 and C0.25-A0.00 groups), the probability that path length did not increase was small (t = −1.612, df = 25, p = 0.057) and thus the result may warrant future investigation.
The last point to which we would like to draw attention regards the variability of the behavior of our fish. We noticed that in the highest acute dose group fish exhibited increased variability in their activity. This variability manifested as between individual variability (e.g., see Figure 4, Panel H) but also as within individual variability. The latter we investigated by recording the bout length of swim episodes (i.e., the length of time during which any movement was detected by the tracking system). We calculated and analyzed the variance of the bout length for each 1 min interval for each fish (means and s.e.m. of the variances are not shown). Variance Analysis of these variances revealed a significant Session interval effect (F(9, 882) = 4.28, p < 0.01), a significant Acute treatment effect (F(3, 98) = 5.15, p < 0.01), and a significant Acute treatment × Session interval interaction (F(27, 882) = 1.89, p < 0.01) but no significant Chronic treatment effect or interaction with Chronic treatment was revealed. These results indicate that acute ethanol treatment led to a test session interval dependent change in variability of swim bout lengths. Tukey HSD post hoc comparisons revealed that the significant acute treatment related changes were primarily due to increased within individual variance (p < 0.05) found in the highest (1.00%) acute dose group as compared to the other dose groups.
DISCUSSION
The effects of ethanol on zebrafish have been extensively studied from a developmental biology perspective. For over three decades it has been clear that ethanol exerts deleterious effects on the developing zebrafish embryo (e.g., Laale, 1971). Numerous recent studies have investigated the teratogenic and toxicological properties of this substance in zebrafish (Arenzana et al., 2006; Hallare et al., 2006) and zebrafish have also been proposed as a model of fetal alcohol syndrome (Bilotta et al., 2004). The behavioral effects of ethanol have also been studied in the zebrafish embryo (Lockwood et al., 2004). However, little is known about the effects of ethanol on the brain function and behavior of adult zebrafish. Given that in the human society alcoholism affects a large number of adults (Sullivan & Handley, 1993) and the mechanisms of ethanol’s action and of alcohol addiction are not well understood (Oroszi & Goldman, 2004), analysis and modeling of the effects of ethanol on the adult vertebrate brain are important (Lovinger & Crabbe, 2005).
Previously, we investigated the behavioral effects of acute ethanol treatment in adult zebrafish (Gerlai et al., 2000) and found several similarities in zebrafish responses to those described for mammalian species including our own. For example, we found that at intermediate doses ethanol increases general activity and aggression, and it diminishes fear and shoaling. The latter phenomenon, i.e., decreased shoal cohesion as a result of acute ethanol treatment, was confirmed by others (Dlugos & Rabin, 2003) who used a methodology different from ours. In the current study, we found evidence confirming our previous results on the anxiolytic-like effects of ethanol in zebrafish. In ethanol naïve fish, predator avoidance (i.e., the distance from the predator model stimulus) was significantly decreased by the two highest doses (0.50% and 1.00%) of acute ethanol treatment. Importantly, the dose response curve for path length, i.e., the total distance moved, was different (all acutely administered ethanol doses increased locomotion) from the dose response curve obtained for the distance from stimulus measure, suggesting that ethanol’s effects on predator avoidance cannot be attributed to the effects of this substance on locomotion and indeed the changes may be due to reduced fear.
Also important to note that this anxiolytic-like effect was seen only at the highest (1.00%) acute ethanol dose in fish that were previously exposed to chronic ethanol treatment. We argue that the ability of chronic ethanol exposure to reduce the anxiolytic properties of acute ethanol treatment is due to adaptation to ethanol. Notably, when we refer to “anxiolytic” effects of ethanol, we use this terminology on the basis of our previous study (Gerlai et al., 2000) in which ethanol was found to reduce the fear inducing effects of a predator stimulus without disrupting motor function, perception, or attention. Since, however, the latter two behavioral aspects (perceptual and attentional properties of zebrafish) were not directly investigated in the current study, the interpretation of our findings with regard to anxiolytic-like effects can be regarded only as an extrapolation.
Proper interpretation will be aided by pharmacological validation with known compounds that have anxiolytic effects in multiple species. As zebrafish is a rather novel model organism in behavioral pharmacology, numerous issues ranging from drug target homology or selectivity to proper drug delivery methods will need to be addressed first. Nevertheless, some recent studies suggest that there is reason for optimism. For example, benzodiazepam receptors have been identified in the minnow (Rehnberg et al. 1989) as well as in the trout (Wilkinson et al., 1983). Chlorpheniramine as well as Diazepam have been found to reduce anxiety in gold fish (Faganello & Mattioli, 2006), a close relative of zebrafish. Finally, nicotine has been found to reduce anxiety-like responses in zebrafish (Levin et al., 2006). Thus it appears that pharmacological validation of the predator model paradigm will be possible.
Shoaling behavior of zebrafish was studied by Dlugos and Rabin (2003). They found that chronic ethanol exposure significantly reduced shoaling in one population of zebrafish (short fin wild type) but not in another (long fin zebrafish) implying a potential genetic component in this phenomenon. They found that their long fin zebrafish exhibited somewhat decreased shoaling after a one week long chronic ethanol exposure but this decrease was not evident by the second week of chronic ethanol treatment. Although the effects appeared modest, the authors interpreted these findings as evidence for adaptation to ethanol. Importantly, Dlugos & Rabin (2003) did not conduct an acute dose response analysis. It is thus not known how the ethanol dose applied acutely during the behavioral test may have influenced the performance of the test fish and whether the chronic treatment influenced the effects of the acute test dose. An exciting aspect with regard to the results of the Dlugos & Rabin (2003) study is that shoaling is a highly complex behavior that is under the governance of numerous factors including foraging strategies, antipredatory behaviors, intra-specific aggression and/or reproductive behaviors. Thus, changes in shoaling could result from any one or any combination of these factors, a question one will have to address in the future. A crucial piece of evidence Dlugos & Rabin (2003) obtained with regard to the effects of ethanol was that the behavioral changes they detected were not due to alterations of ethanol levels in the brain and thus could not be explained by changes in ethanol metabolism, absorption, or distribution. Thus, it is likely that the behavioral differences they found between the zebrafish populations and the behavioral effects of chronic ethanol treatment were due to the central effects of ethanol, i.e., to alterations of neuronal function of the central nervous system of zebrafish.
In our current study, we investigated the activity and fear responses of single zebrafish, a grossly simplified situation compared to the above, and we studied how the effects of different doses of acute ethanol may be modified by chronic ethanol treatment. Our results provide evidence for adaptation to ethanol in adult zebrafish. They show that after a two week long chronic treatment with ethanol, zebrafish that receive the same ethanol dose during testing essentially behave the same way as fish that were never exposed to ethanol. The activity level of these chronically treated fish is as low as that of the control, i.e., that of the ethanol unexposed fish, and they also show the same robust avoidance reaction when a predator model is presented as their ethanol naïve counterparts. In summary, the hyperactivity inducing and anxiolytic effects of acute ethanol treatment are not apparent in the chronic ethanol exposed fish as long as the acute dose is identical or similar to the chronic dose. At higher acute doses, however, these chronic ethanol exposed fish exhibit the typical acute ethanol induced responses, i.e., hyperactivity and reduced fear reaction. This response profile is reminiscent of that seen in human drug abuse (Weiss & Porrino, 2002 and references therein). The stimulant and anxiolytic properties of alcohol may have sufficient reinforcing properties but after prolonged exposure to the substance, due to adaptation, its efficacy decreases and higher doses are needed to maintain the desired effects.
Although the current study was not designed to specifically demonstrate and examine potential effects of withdrawal from ethanol, we observed an apparent and near significant elevation of activity in fish upon their withdrawal from chronic ethanol treatment. Withdrawal from ethanol may manifest as hyperresponsivity or hyperactivity but may also manifest as hypoactivity in mammalian species (e.g., Finn & Crabbe, 1997; Erstad & Cotugno, 1995). Given the preliminary nature of our current findings and the complexities of withdrawal symptoms in other species, our current results with zebrafish must be corroborated and potential withdrawal related behavioral responses must be carefully characterized in the future.
Another point that may be noted here concerns the fact that the dose response curve we obtained for acute ethanol treatment is atypical. Ethanol is known to have an inverted U-shape dose effect on activity in mammals including mice (see e.g., Cohen et al., 1997) and previously we (Gerlai et al., 2000) also found that intermediate doses (0.25 and 0.50%) of ethanol induced hyperactivity in zebrafish whereas the highest dose employed (1.00%) led to hypoactivity. In the current study the doses of ethanol and their administration protocol were identical to what we employed before, yet now we found a quasi-linear dose response showing that higher ethanol doses increased the total path length swum by zebrafish. We do not have a clear explanation for this discrepancy. It is possible that the strain used, the long-fin wild type zebrafish, was more resistant to ethanol than the California outbred stock we tested before (Gerlai et al, 2000) and thus the 1.00% acute dose was not high enough for them to elicit hypoactivity. Furthermore, it is likely that our current videotracking based quantification method could detect movements more precisely than our recording method did before. Previously we (Gerlai et al., 2000) simply counted the number of segments the fish crossed. A within segment movement would not factor into the total locomotor activity recorded. In the current study we noticed that fish in the highest dose moved often in the corner of the tank and this movement was detected by the tracking system. These fish also showed abrupt and fast swim episodes that now could be precisely quantified. This type of swim pattern resulted into increased between individual variability but it also led to within individual variability that was significantly increased in the highest dose group. We therefore argue that the effect of the highest acute dose employed here is more complex than previously thought and although this dose may reduce locomotor tendencies in zebrafish it does it without eliciting sedation related passivity that would lead to reduction of total activity.
Last, we would like to discuss a methodological, but rather important aspect of our current study: the behavioral analysis was conducted using automated quantification methods, i.e., videotracking. Our results show that it is possible to detect significant acute and chronic ethanol treatment induced behavioral changes in zebrafish without having to observe the fish and without having to manually record their behavior. Automated computerized behavioral quantification is an important prerequisite for high throughput screening. It allows the application of a large number of test apparati running in parallel. The limiting factor in such a set up is no longer the amount of time an experimenter has but rather the physical space available and the cost of the equipment. Given that the test tanks are small and the equipment is also inexpensive (commercially available video equipment and computer hardware and software), high throughput screening appears rather feasible.
In summary, taken together with previous results discussed in this paper, the current study shows that the zebrafish is a promising animal model with which both the acute and the chronic effects of ethanol may be investigated in the adult using high throughput genetic or pharmacological screens.
Acknowledgments
This study was supported by NIH (NIAAA, R21 AA015533 grant awarded to RG). We would like to thank Andromeda Axcell, Carrie Burns, MinKu Kim and Karalyn Tom for their technical help.
Footnotes
Publisher's Disclaimer: This is a PDF file of an unedited manuscript that has been accepted for publication. As a service to our customers we are providing this early version of the manuscript. The manuscript will undergo copyediting, typesetting, and review of the resulting proof before it is published in its final citable form. Please note that during the production process errors may be discovered which could affect the content, and all legal disclaimers that apply to the journal pertain.
References
- Arenzana FJ, Carvan MJ, 3rd, Aijon J, Sanchez-Gonzalez R, Arevalo R, Porteros A. Teratogenic effects of ethanol exposure on zebrafish visual system development. Neurotoxicol Teratol. 2006;28:342–348. doi: 10.1016/j.ntt.2006.02.001. [DOI] [PubMed] [Google Scholar]
- Bilotta J, Barnett JA, Hancock L, Saszik S. Ethanol exposure alters zebrafish development: a novel model of fetal alcohol syndrome. Neurotoxicol Teratol. 2004;26:737–743. doi: 10.1016/j.ntt.2004.06.011. [DOI] [PubMed] [Google Scholar]
- Blaser R, Gerlai R. Behavioral phenotyping in Zebrafish: Comparison of three behavioral quantification methods. Behavior Research Methods. 2006 doi: 10.3758/bf03192800. in press. [DOI] [PubMed] [Google Scholar]
- Cohen C, Perrault Gh, Sanger DJ. Evidence for the involvement of dopamine receptors in ethanol-induced hyperactivity in mice. Neuropharmacology. 1997;36:1099–1108. doi: 10.1016/s0028-3908(97)00100-7. [DOI] [PubMed] [Google Scholar]
- Csányi V. Ethological analysis of predator avoidance by the paradise fish (Macropodus opercularis L.): II. Key stimuli in avoidance learning. Anim Learn Behav. 1986;14:101–109. [Google Scholar]
- Dlugos CA, Rabin RA. Ethanol effects on three strains of zebrafish: model system for genetic investigations. Pharm Biochem Behav. 2003;74:471–480. doi: 10.1016/s0091-3057(02)01026-2. [DOI] [PubMed] [Google Scholar]
- Erstad BL, Cotugno CL. Management of alcohol withdrawal. Am J Health Syst Pharm. 1995;52:697–709. doi: 10.1093/ajhp/52.7.697. [DOI] [PubMed] [Google Scholar]
- Faganello FR, Mattioli R. Anxiolytic-like effect of Chlorpheniramine in inhibitory avoidance in goldfish submitted to telencephalic ablation. Prog Neuropsychopharmacol Biol Psychiatry. 2006 doi: 10.1016/j.pnpbp.2006.06.015. in press. [DOI] [PubMed] [Google Scholar]
- Finn DA, Crabbe JC. Exploring alcohol withdrawal syndrome. Alcohol Health Res World. 1997;21:149–156. [PMC free article] [PubMed] [Google Scholar]
- Gerlai R. Zebra fish: An uncharted behavior genetic model. Behav Genet. 2003;33:461–468. doi: 10.1023/a:1025762314250. [DOI] [PubMed] [Google Scholar]
- Gerlai R, Lahav M, Guo S, Rosenthal A. Drinks like a fish: Zebra fish (Danio rerio) as a behavior genetic model to study alcohol effects. Pharmacol Biochem Behav. 2000;67:773–782. doi: 10.1016/s0091-3057(00)00422-6. [DOI] [PubMed] [Google Scholar]
- Gerlai R. Can paradise fish (Macropodus opercularis) recognize its natural predator? An ethological analysis. Ethology. 1993;94:127–136. [Google Scholar]
- Gerlai R, Csányi V. Genotype environment interaction and the correlation structure of behavioral elements in paradise fish (Macropodus opercularis) . Physiology and Behavior. 1990;47:343–356. doi: 10.1016/0031-9384(90)90153-u. [DOI] [PubMed] [Google Scholar]
- Hallare A, Nagel K, Kohler HR, Triebskorn R. Comparative embryotoxicity and proteotoxicity of three carrier solvents to zebrafish (Danio rerio) embryos. Ecotoxicol Environ Saf. 2006;63:378–388. doi: 10.1016/j.ecoenv.2005.07.006. [DOI] [PubMed] [Google Scholar]
- Laale HW. Ethanol induced notochord and spinal cord duplications in the embryo of the zebrafish. Brachydanio rerio. J Exp Zool. 1971;177:51–64. doi: 10.1002/jez.1401770107. [DOI] [PubMed] [Google Scholar]
- Lassen N, Estey T, Tanguay RL, Pappa A, Reimers MJ, Vasiliou V. Molecular cloning, baculovirus expression, and tissue distribution of the zebrafish aldehyde dehydrogenase 2. Drug Metab Dispos. 2005;33:649–656. doi: 10.1124/dmd.104.002964. [DOI] [PubMed] [Google Scholar]
- Levin ED, Bencan Z, Cerutti DT. Anxiolytic effects of nicotine in zebrafish. Physiol Behav. 2006 doi: 10.1016/j.physbeh.2006.08.026. in press. [DOI] [PubMed] [Google Scholar]
- Lockwood B, Bjerke S, Kobayashi K, Guo S. Acute effects of alcohol on larval zebrafish: a genetic system for large-scale screening. Pharmacol Biochem Behav. 2004;77:647–654. doi: 10.1016/j.pbb.2004.01.003. [DOI] [PubMed] [Google Scholar]
- Lovinger DM, Crabbe JC. Laboratory models of alcoholism: treatment target identification and insight into mechanisms. Nat Neurosci. 2005;8:1471–1480. doi: 10.1038/nn1581. [DOI] [PubMed] [Google Scholar]
- Oroszi G, Goldman D. Alcoholism: genes and mechanisms. Pharmacogenomics. 2004;5:1037–1048. doi: 10.1517/14622416.5.8.1037. [DOI] [PubMed] [Google Scholar]
- Rehnberg BG, Bates EH, Smith RJ, Sloley BD, Richardson JS. Brain benzodiazepine receptors in fathead minnows and the behavioral response to alarm pheromone. Pharmacol Biochem Behav. 1989;33:435–442. doi: 10.1016/0091-3057(89)90527-3. [DOI] [PubMed] [Google Scholar]
- Reimers MJ, Hahn ME, Tanguay RL. Two zebrafish alcohol dehydrogenases share common ancestry with mammalian class I, II, IV, and V alcohol dehydrogenase genes but have distinct functional characteristics. J Biol Chem. 2004;279:38303–38312. doi: 10.1074/jbc.M401165200. [DOI] [PMC free article] [PubMed] [Google Scholar]
- Sison M, Cawker J, Buske C, Gerlai R. Fishing for genes of vertebrate behavior: Zebra fish as an upcoming model system. Lab Animal. 2006;35:33–39. doi: 10.1038/laban0506-33. [DOI] [PubMed] [Google Scholar]
- Sullivan EJ, Handley SM. Alcohol and drug abuse. Annu Rev Nurs Res. 1993;11:281–297. [PubMed] [Google Scholar]
- Wahlsten D. Insensitivity of the analysis of variance to heredity × environment interaction. Behavioral Brain Science. 1990;13:109–161. [Google Scholar]
- Wilkinson M, Wilkinson DA, Khan I, Crim LW. Benzodiazepine receptors in fish brain: [3H]-flunitrazepam binding and modulatory effects of GABA in rainbow trout. Brain Res Bull. 1983;10:301–303. doi: 10.1016/0361-9230(83)90094-1. [DOI] [PubMed] [Google Scholar]
- Tropepe V, Sive HL. Can zebrafish be used as a model to study neurodevelopmental causes of autism? Genes, Brain and Behavior. 2003;2:268–281. doi: 10.1034/j.1601-183x.2003.00038.x. [DOI] [PubMed] [Google Scholar]
- Weiss F, Porrino LJ. Behavioral neurobiology of alcohol addiction: recent advances and challenges. J Neurosci. 2002;22:3332–3337. doi: 10.1523/JNEUROSCI.22-09-03332.2002. [DOI] [PMC free article] [PubMed] [Google Scholar]