

Abstract
The bacterial envelope stress response senses stress signals in the extracytoplasmic compartment, and activates σE-dependent transcription by degrading its antisigma factor RseA. RseB, a binding partner of RseA, plays a pivotal role in regulating this response, but its molecular mechanism is not understood. We therefore determined the crystal structure of Escherichia coli RseB at a resolution of 2.4 Å. RseB is composed of two domains linked by a flexible linker and forms a loosely packed dimer with two grooves on each side. This structural feature is confirmed by small-angle scattering in solution. Analysis of the binding of various RseA mutants to RseB allowed us to identify the major RseB-binding motif in RseA. These data, coupled with analysis of small-angle scattering of the RseA/RseB complex in solution, leads us to propose that two RseAs bind to the grooves of the dimeric RseB by conserved residues. The implications for modulating proteolytic cleavage of RseA are discussed.
Keywords: RseB, RseA, envelope stress signal, x-ray crystallography, small-angle scattering
Bacterial cells sense elevated temperature and other environmental stresses by the recognition of misfolded proteins in the envelop compartment. The envelop stress signal is then transmitted to the cytoplasm across the membrane, by either the σE or CpxRA pathway (1, 2), thereby inducing the expression of the genes required for cellular adaptation and homeostasis. A variety of stress signals, which can be detected by increases in the levels of misfolded OMP precursor in the extracytoplasmic compartment, are transduced into the cytoplasmic compartment and activate the genes necessary for the defense or recovery of the cells against stress by the release of σE, a sigma factor that functions as a subunit of the RNA polymerase holoenzyme. Approximately 100 genes have been determined to be regulated by the σE response (3–6).
In the σE pathway, the activity of the sigma factor σE is controlled by two inner membrane proteases, DegS and RseP, as well as two antisigma factors, RseA and RseB. RseA consists of the N-terminal cytosolic domain, the single transmembrane segment, and the C-terminal periplasmic domain. The cytosolic domain of RseA functions as an antisigma factor by strongly binding to σE and inhibiting its activity. DegS, which is anchored to inner membrane by an N-terminal transmembrane segment, is activated in cases in which the PDZ domain of DegS binds to a misfolded OMP precursor (7, 8). The periplasmic C terminus of RseA is then cleaved by the activated DegS (8, 9), followed by the sequential digestion of the N terminus of RseA by RseP, a membrane metalloprotease, to release the N terminus RseA/σE complex into the cytosol (10, 11). It was reported that this process is controlled by the PDZ domain of RseP and the Gln-rich region of RseA in the periplasmic compartment (12). The σE can be released completely from RseA, and its activity as a sigma factor is restored when the RseA fragment is removed by ClpXP protease (13). Ultimately, the serial digestion of RseA by DegS, RseP, and ClpXP results in the release of active σE in the cytosolic space and the expression of stress-responsive genes. In addition, it has also been determined that simply the overproduction of P pilus subunit, PapG, in the absence of a chaperone or structural changes in lipopolysaccharides, can also result in the activation of σE without the activation of DegS (14–16).
RseB, a negative modulator of the σE pathway, has been shown to control the activity of RseP by binding to the C terminus of RseA (17–19). It appears that the role of RseB is crucial for the negative regulation of σE signaling, because RseP can cleave ResA in the Escherichia coli ΔrseB ΔdegS strain, without the periplasmic cleavage of RseA (20). In other words, RseB may prevent the proteolytic cleavage of intact RseA by RseP in the absence of stress signals (20). RseB has also been proposed to activate the function of σE by sensing other stress signals, e.g., damaged proteins in the periplasmic space (15, 20–22). Therefore, RseB is considered to function in the fine tuning of the σE envelop stress response, by modulation of the RseP activity (20).
RseA and RseB are broadly conserved among Gram-negative bacteria that have the σE envelop stress response (Fig. 1A), and RseB is believed to be crucial for the modulation of the signaling pathway. However, it remains unclear as to the manner in which RseB functions and interacts with RseA at the molecular level, as well as the manner in which their binding modulates the envelop stress response. In this study, we report the crystal structure of RseB and the fine mapping of the ResB-binding region of RseA. We propose a binding mode of RseB to RseA and discuss the implications for modulating proteolytic cleavage of RseA.
Fig. 1.

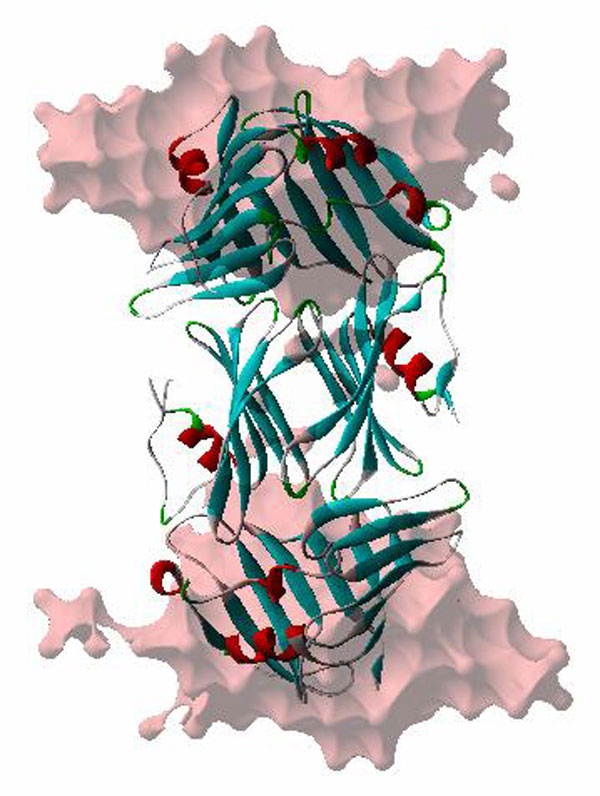
Sequence and structure of RseB. (A) Sequence alignment of RseB homologues. The secondary structure of E. coli RseB is indicated by a cylinder for an α-helix or by an arrow for a β-strand. Identical and similar residues are boxed in blue and yellow, respectively. Protein sequences were obtained from the Institute for Genomic Research. Species abbreviations are as follows: Ec, Escherichia coli; Se, Salmonella enterica; Yp, Yersinia pestis; Vc, Vibrio cholerae; So, Shewanella oneidensis; Eca, Erwinia carotovora; Ms, Mannheimia succiniciproducens; Pm, Pasteurella multocida; Hi, Haemophilus influenzae; and Pl, Photorhabdus luminescens. (B) Ribbon diagram of the E. coli RseB monomer in two different views. α-Helices and β-strands are labeled alphabetically and by arabic numerals, respectively. The large and the small domains are colored cyan and red, respectively. A green dashed line represents the linker between residues 210 and 216, which is not modeled. (C) Two dimeric conformations of RseB. The open (Upper) and the closed (Lower) dimers are depicted in ribbon diagrams seen from three different views. Two subunits are colored magenta and green. The closed dimer is packed tightly by a detergent, n-octyl-β-d-glucoside, which is depicted in a gray stick model.
Results
Structure Determination of RseB.
Mature RseB (residues 24–318) lacking the signal peptide was expressed in E. coli and purified by two chromatography steps. Size-exclusion chromatography revealed that RseB exists as a dimer in solution. It was crystallized in a solution containing PEG 8000 as a precipitant and in the presence of n-octyl-β-d-glucoside and guanidine-HCl as additives. In particular, the addition of n-octyl-β-d-glucoside proved essential to the alteration of the morphology of crystals as well as diffraction quality. The crystal structure of RseB has been determined by using single-wavelength anomalous dispersion data collected from the Se-Met substituted RseB crystal in the wavelength showing the maximum anomalous absorption of the selenium atom and refined at a resolution of 2.4 Å [supporting information (SI) Table 1 and SI Fig. 6]. The asymmetric unit of the RseB crystal harbors three subunits that have different conformations (SI Fig. 7).
Crystal Structure of RseB Monomer.
The monomeric structure of RseB is composed of a larger N-terminal (residues 26–209 in the first subunit) domain and a smaller C-terminal (residues 217–316 in the first subunit) domain (Fig. 1). A flexible linker (residues 210–216 in the first subunit) between two domains was not traced, probably because of the inherent flexibility. In the second and third subunits, the residues 191–217 and 209–220 were not modeled, respectively. The N-terminal domain of RseB is composed of a saddle-shaped β-sheet of 11 antiparallel β-strands (β1–β11) flanked by three α-helices (αa–αc; Fig. 1B). The structural similarity of RseB with other known structures was searched by DALI algorithm (23). The overall fold of the N-terminal domain was shown to be similar to that of a lipoprotein, LppX, which is involved in the translocation of complex lipids to the cell envelop (24). LppX can be superimposed on the N-terminal domain of RseB with a Z-score of 10.5 with rmsd of 3.5 Å for 142 Cα atoms. The C-terminal domain is comprised of two β-sheets of six (β13-β18) and two (β12 and β19) antiparallel β-strands, respectively, and a helix (Fig. 1B). The overall fold of the C-terminal domain is similar to Mog1p, a Ran GTPase-binding protein from Saccharomyces cerevisiae (25). The rmsd between the C-terminal domain of RseB and Mog1p is 2.9 Å for 77 Cα atoms, with a Z-score of 4.8. However, it does not seem that this structural similarity bears functional relevance, because the residues that comprise the Ran GTPase-binding site of Mog1p are not conserved in RseB. Although each domain of RseB shows structural similarity to other proteins, the entire structure is not similar to any other known proteins.
RseB Dimers in Two Different Conformations in the Crystal.
An asymmetric unit of the RseB crystal harbors three subunits (SI Fig. 7). The dimeric structure in the crystal was previously expected, because RseB forms a dimer in solution. Two of the three subunits in the asymmetric unit form a closed dimer by noncrystallographic twofold symmetry and are packed relatively tightly with the burial of 3,597 Å2 of the solvent-accessible surface. The closed dimer has overall dimensions of 46 × 55 × 95 Å (Fig. 1C). The third subunit shows a different conformation, mostly because of the difference in the relative orientation of two domains, whereas the overall fold is quite similar (SI Fig. 8A). Because RseB forms a dimer in solution, the third subunit and its equivalent related by the twofold crystallographic symmetry were used to build another form of dimer, which is denoted as an open dimer. The overall dimensions of the open dimer are 41 × 49 × 110 Å (Fig. 1C). By the formation of an open dimer, 760 Å2 of the solvent-accessible surface becomes buried. However, we cannot completely exclude the possibility that this model does not represent a natural form.
The formation of the open RseB dimer is mediated only by the residues in the C-terminal domain (Fig. 1C and SI Fig. 8B). The hydrogen bonding between Q275 and T273 of the opposite subunits is enclosed by the van der Waals contacts involving several residues which are related by twofold symmetry (SI Fig. 8B). The packing between two subunits is tighter in the closed than in the open conformation. The wide binding area observed in the closed dimer is attributable to the use of n-octyl-β-d-glucoside, which is buried within the binding interface of the two C-terminal domains by hydrophobic interaction with the aliphatic chains of residues T243, M247, N264*, R281*, R282*, and V297* (* denotes the residues in the opposite subunit; SI Fig. 6). The detergent appears to stabilize the dimer by an increase in the binding surface, because the detergent-binding region, including residues 234–251, is flexible in the open dimer and is accordingly not modeled (Fig. 1C and SI Fig. 8A). As a result, two grooves of approximate dimensions of 15 Å depth and 30 Å length are formed by the two C-terminal domain and a single N-terminal domain in the open dimer (Fig. 1C).
RseB Exists as the Open Dimer in Solution.
Because two different dimeric conformations were observed in the crystal structure, it was necessary to identify the dimeric nature of RseB in solution. Therefore, RseB was examined by synchrotron small-angle x-ray scattering (SAXS) experiment. The distance distribution function of RseB, which was obtained from the SAXS data, is not identical to those calculated from the conformations found in the crystal structures (SI Fig. 9), but the overall shape of the curve for the SAXS experiment appears to be closer to that for the open dimer (Fig. 2A and SI Fig. 9). The solution model of RseB constructed from the scattering data revealed that RseB exists as an extended dimer and has two grooves on each side (Fig. 2A). Therefore, it is thought that the solution model is similar to the conformation of the open dimer in terms of the overall 3D shape and the distance distribution function (Fig. 2A and SI Figs. 9 and 10), and two open grooves are present in the solution conformation as well as in the crystal structure of the open dimer. In the solution model, the shape of the N-terminal domain is similar to the crystal structure, whereas the C-terminal domain is not well defined, which may be because of its flexibility in solution (Fig. 2A). However, we cannot rule out the presence of the closed dimer in certain environments, because the SAXS experiments were performed in the buffer containing 20 mM Tris·HCl, pH 7.5/100 mM NaCl, which is not identical to the crystallization condition.
Fig. 2.

The solution models of RseB (A) and RseA121–216/RseB complex (B) restored from the synchrotron SAXS data in the same orientation. The ribbon diagram of the open RseB dimer is overlapped onto the solution model of RseB for the comparison of overall shape and dimension.
RseB Interacts with the Small Binding Fragment of RseA.
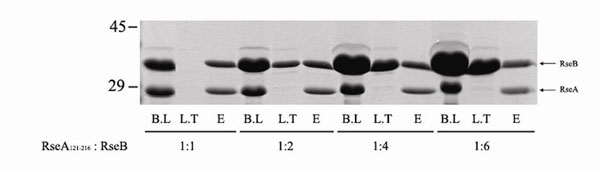
RseB binds to the periplasmic C-terminal domain of RseA and negatively regulates σE signaling as an antisigma factor (17, 18, 20). To locate the RseB-binding fragment of RseA, His pulldown assays using a variety of truncated RseAs (tRseA) were conducted. Eighteen different forms of tRseAs were expressed as His-Trx fusion proteins, and their binding to RseB was evaluated by the pulldown assay and SDS/PAGE (Fig. 3). The minimal region of RseA required for binding to RseB consists of the residues 169–186 (QRRRINAMLQDYELQRRL) (Fig. 3). The titration of RseB binding to RseA revealed that one dimeric RseB binds to two RseAs (SI Fig. 11). When RseB and the periplasmic domain of RseA (RseA121–216) were mixed at the subunit molar ratio of 1:1 and loaded onto an NTA column, no RseB was detected in the loading-through. When RseB was added at increasing molar ratios, the amount of bound RseB was the same, and the excessive RseB was observed in the loading-through, thereby suggesting that one subunit of RseB binds to one RseA.
Fig. 3.

Mapping of the RseB-binding fragment of RseA by His pulldown assays. (A) A schematic diagram for the various truncated RseA mutants used in the experiment. The region confined by the red dotted line represents the fragment essential for RseB binding. The blue, cyan, and magenta colors represent strong, weak, and no binding activity to RseB, respectively. Q1 and Q2 are the Gln-rich motifs defined in ref. 12. (B) His pulldown assays to characterize the RseB binding of RseA mutants. The numbers in each lane represent the starting and ending residues. Elution fractions are analyzed in SDS/PAGE. When the RseA mutant has the binding activity of RseB, both RseA and RseB bands are visible in the same lane.
The RseB-binding fragment, RseA169–186, harbors five Arg residues at both ends (residues 170, 171, 172, 184, and 185), which are relatively well conserved in all bacterial species (Fig. 4A). Therefore, it is tempting to hypothesize that these residues perform important roles in the function. To elucidate the roles of these Arg residues in the interaction with RseB, they were replaced with negatively charged residues (R170D/R171D, R171D/R172D, R184E/R185E, R172D, and R185E; Fig. 4B) or neutral residues (R171A/R172A, R172A, R184A/R185A, R185A, and R172A/R1875A; Fig. 4C), and the interactions between these tRseA mutants and RseB were assessed by the His pulldown assay (Fig. 4 B and C). Among the mutants, R171D/R172D, R184E/R185E, R185E, and R172A/R185A did not bind to RseB, and R172D showed marginal binding affinity, whereas R170D/R171D and other Arg-to-Ala mutants retained full binding affinity (Fig. 4 B and C). These results suggest that R172 and R185 of RseA are crucial for the interaction with RseB. Consistent with this notion, R172 and R185 appear to be very well conserved in Gram-negative bacteria (Fig. 4A). That R172 and R185 are essential for binding RseB suggests the negatively charged surface of RseB dimer, which is found at the bottom and the inside of the groove (Fig. 5A), might be the binding site of RseA. The SAXS data are consistent with the idea that the groove of RseB might be the binding site of RseA (Fig. 2). The distance distribution function and the solution model of RseB/RseA complex show that the complex has a flattened surface, and the inter atomic distances are more evenly distributed than the unbound RseB, suggesting that the structure of the complex is more compact and the grooves are occupied (Fig. 2B and SI Fig. 9). These data propose that the open grooves of RseB are occupied by RseAs and the conformation of RseB is less flexible when bound to RseAs (Fig. 2).
Fig. 4.

His pulldown assays of the mutants RseA121–216. (A) Sequence alignment of the periplasmic region of RseA comprising the residues 159–202, which harbors the Gln-rich regions (Q1, residues 162–169; and Q2, residues 190–200) and the RseB-binding fragment (169–186). Identical and similar residues are boxed in blue and yellow, respectively. (B) The binding of reverse-charged mutants of RseA121–216 (R170D/R171D, R171D/R172D, R184E/R185E and R172D) to RseB was estimated via the His pulldown assays. BL, LT, and E stand for before loading, loading through, and elution fractions, respectively. (C) The same pulldown assays were performed by using Arg-to-Ala mutants of RseA121–216 (R171A/R172A, R172A, R184A/R185A, R185A, and R172A/R1875A).
Fig. 5.

The surface models of the open RseB. (A) Charge-distribution surface models of the open RseB dimer seen from two different views. The red and blue areas represent negatively and positively charged surfaces, respectively. Negatively charged surfaces are primarily located at the bottom (Right) and the inside (Left) of the grooves. (B) Surface model of the open RseB in the same view as A Right shows the distribution of the conserved residues. The blue, yellow, and white surfaces respectively represent identical, well conserved, and less-conserved residues, which is marked in the multiple sequence alignment of Fig. 1A. The conserved polar and negatively charged residues in the cleft are labeled.
Discussion
RseA/σE signaling has been extensively studied as one of the envelop stress responses in Gram-negative bacteria (1, 2). It has been thought that RseB, or its complex with RseA is involved in the fine tuning of this response, by the regulation of the activity of RseP, the integral membrane protease responsible for the modulation of the signaling pathway. In this report, the crystal structure of RseB and its mode of binding with RseA were studied, in an attempt to elucidate the molecular mechanisms inherent to RseB.
Two dimeric forms of RseB, the open and the closed forms, were identified by crystallographic analyses (Fig. 1). However, the SAXS data suggest that RseB in solution adopts an open conformation (Fig. 2A), which is comparable but not identical to the open dimer observed in the crystal structure. It is thought that the conformation of RseB is not fixed in solution, that is, the relative position of the two domains or dimeric interface is subject to change. The crystal structure of the open dimer may represent a snapshot of that changeable conformation. The closed RseB dimer seems to be a crystallization artifact induced by the addition of the detergent, which was indispensable for crystallization. However, we cannot rule out the possibility that the closed dimer exists under certain conditions such as the presence of lipids or lipid analogues, because it was observed in the crystal structure that the nonionic detergent tightly binds inside of the closed RseB dimer. As for the binding of RseA to RseB, the binding assays using various RseA mutants and the complex structure obtained by the SAXS experiment (Figs. 2B and 3) propose that two RseAs bind to the two grooves of RseB dimer by the binding fragment containing well conserved residues.
In the binding fragment of RseA, two conserved key Arg residues (R172 and R185) are located at both ends, whereas the hydrophobic residues, which are also well conserved, are found in the middle (Fig. 4A). Therefore, it is believed that RseA binding to RseB occurs by hydrophobic as well as charged residues. When either R172 or R185 was changed to Ala, mutated RseA still can bind to RseB, thereby suggesting that the binding affinity between RseA and RseB is not significantly affected when one of the charge-mediated or polar interactions is interrupted (Fig. 4C). This idea can also be confirmed by the fact that the truncated mutant, RseA173–216, which lacks the N-terminal four residues including R172 still shows partial binding affinity for RseB. However, the deletion of two more N-terminal residues (RseA175–216) or the substitution of both Arg residues (R172A/R185A) can abolish the binding affinity (Fig. 3). However, R172 and R185 have special roles in binding through the electrostatic interaction with RseB. Unlike the Arg-to-Ala mutation of R172 or R185, the replacement of either R172 or R185 with a negatively charged residue abolishes the binding affinity (Fig. 4B), probably because of the repulsion force between RseA and RseB. In a recent study reported during the final review of this manuscript, the major interaction site of RseA with RseB was mapped, and it is consistent with our results (26). The surface model of the open RseB dimer, in which the locations of the conserved residues are marked (Fig. 5B), clearly shows that many of the conserved polar and negatively charged residues, such as E98, S113, D118, E181, S260, and E299, are localized in the cleft, and are likely to be involved in the interaction with RseA. A recent mutation analysis proved that the 245–250 residues of RseB, which are located in the cleft, play essential roles in RseA binding (C. A. Gross, personal communication). The 245–250 residues of RseB are not shown in the surface model, because this region is not modeled in the open dimer probably because of its flexibility.
The solution structure of RseA/RseB complex restored from the small angle scattering data seems to occupy more volume in the middle region (Fig. 2B) than the RseB structures modeled from the SAXS or x-ray crystallography. From the comparison, it is assumed that RseA binds to the groove of RseB, which is located in the interface between two domains and pushes away the N-terminal domain to the outside and stabilize the C-terminal domain of RseB. If this happens, the C-terminal domain will become more ordered and the N-terminal domain will be rotated counterclockwise. The relative movement of the two domains can be inferred, because a similar movement is observed when the closed and the open dimers are compared (SI Fig. 8A). The size of the groove is estimated to be 15 Å deep and 30 Å long (Figs. 1C and 5) and is about the same as the size of an 18-residue helix, which is 13 Å in diameter and 27 Å in length. Therefore, it can be hypothesized that the binding fragment of RseA forms a helix and tightly fits into the groove. These results, taken together, suggest that the periplasmic domain of RseA undergoes conformational changes and its RseB binding fragment gains significant helical property when bound to the groove of RseB. We cannot rule out the possibility where RseA binds to the closed dimer of RseB proximally to the C terminus. If this happens, the resulting envelop could be also similar to the SAXS model of the complex (Fig. 2B). However, considering other evidences including the charge distribution and the size of the binding cleft of the open dimer, it is more likely that RseA binds to the open dimer of RseB and the RseA-binding site is the cleft, which is formed between two RseB subunits.
It has been previously proposed that the role of RseB may be to block the access of RseP to RseA as one way of negative regulation of RseP (20). Our current data provide the structural basis for the interaction between RseB and RseA, thereby supporting this idea. But, it is yet unknown how the two Gln-rich regions of RseA are involved in the regulation of RseP (12). Interestingly, the RseB-binding fragment identified in this study does not overlap with the Gln-rich regions (Q1: residues 162–169; Q2: residues 190–200) and is rather located between them (Figs. 3A and 4A), thereby implying that the negative regulation of RseP by the Gln-rich regions is not mediated by the interaction with RseB. If RseA undergoes the conformational changes induced by RseB binding, it is possible that the conformations and relative distance of the two Gln-rich regions may be altered and ultimately RseB may enhance the accessibility of RseA to the PDZ domain of RseP and modulate the RseP activity. Apart from this, RseB has been shown to be solely capable of controlling the RseP activity under stress conditions (15, 20–22). In this regard, it is hypothesized that the stress signals might directly induce the conformational changes of RseB toward more closed form and ultimately result in the release RseB from RseA. In our crystal structure, a detergent molecule was found in the closed RseB dimer, and it is therefore likely that lipids or lipid-containing molecules can function as signaling molecules to induce the closed conformation of RseB and activate RseP. In this context, a recent report is noteworthy, which indicated that the σE activity is DegS-independently increased by modified lipopolysaccharides (16).
The crystal structure of RseB as well as the proposed binding mode to RseA will provide a cornerstone for further biochemical and physiological studies of RseB/RseA complex and important clues for understanding the regulatory mechanisms of the σE signaling pathway. Further studies on the physiological properties and roles of RseB and RseA/RseB complex will be required to fully characterize the σE signaling pathway and the general mechanisms inherent to the regulation of intramembrane proteolysis.
Materials and Methods
Cloning, Expression, and Protein Purification.
The gene encoding E. coli RseB (residues 24–318) was amplified from the E. coli genome by PCR. The PCR products were then digested by NdeI and HindIII and inserted into pET-22b(+). The plasmid was then transformed into E. coli BL21(DE3). The cells were grown in LB medium and protein expression was induced with 0.5 mM isopropyl β-d-thiogalactoside at 30°C. After 5 h of induction, the cells were harvested by centrifugation and disrupted by sonication in 20 mM Tris·HCl, pH 7.5. The homogenate was then clarified by centrifugation and was dialyzed against the same buffer. The protein was then purified by using heparin-agarose (GE Healthcare, Piscataway, NJ) and Superdex 200 gel-filtration chromatography. The purified protein was then dialyzed in 20 mM Tris·HCl, pH 7.5/100 mM NaCl and concentrated to 20 mg/ml. Se-Met-labeled RseB was expressed in E. coli B834(DE3). Point mutations were introduced into the RseA gene by Quick Change mutagenesis kit (Stratagene, La Jolla, CA).
Crystallization.
RseB crystals suitable for x-ray data collection were grown by the hanging-drop vapor diffusion method at 20°C in the condition of 0.1 M Hepes, pH 7.5/6%(wt/vol) PEG 8000/0.1 M NaCl/5%(vol/vol) 2-methyl-2,4-pentanediol/5%(wt/vol) guanidine·HCl/3 mM n-octyl-β-d-glucoside. For cryoprotection, the crystals were serially transferred into crystallization solution containing an increasing amount of PEG 8000 (up to 25%) and frozen in a cold nitrogen stream at −173°C. Diffraction experiments were performed at beam line 4A of Pohang Light Source, Pohang, Korea, and at NW12 of Photon Factory, Tsukuba, Japan. The final x-ray diffraction data were collected with a Quantum 210 CCD detector (Area Detector Systems Corp., Poway, CA) at beam line NW12. The native RseB crystal diffracted to 2.4 Å and belongs to the space group C2221, with unit cell dimensions: a = 97.7 Å, b = 197.7 Å, and c = 109.0 Å. The single-wavelength anomalous dispersion data using Se-Met-labeled RseB were collected at peak wavelength (0.9794 Å). The data were processed and scaled by using HKL2000 (27).
Structure Determination and Refinement.
The crystal structure of RseB was determined by the single-wavelength anomalous dispersion method. Twenty selenium sites were found and used for phase calculation by the SOLVE program. The density modification using RESOLVE (28) resulted in electron density map, which was suitable for model building. Several cycles of rigid body annealing, positional refinement, simulated annealing, B-factor refinement, and model rebuilding were conducted at a resolution of 2.4 Å, using the CNS (29) and O (30) programs. Final refinement, after the inclusion of solvents, resulted in R and Rfree values of 23.3% and 28.3% (for a 10% data sample), respectively. Data collection and refinement statistics are summarized in SI Table 1.
His Pulldown Assay.
For the mapping of the RseB-binding motif of RseA, the His-pulldown experiments were conducted by using Ni-NTA resin (Qiagen, Chatsworth, CA). The DNAs coding for tRseA were inserted into pET-28a for the expression of the His6-Trx-tRseA fusion proteins. For the pulldown experiment, 200 μl of His6-Trx-tRseA protein (100 μM) was loaded onto the 200 μl of Ni-NTA resin equilibrated with buffer A, followed by incubation for 10 min with 200 μl of 100 μM RseB at room temperature. After washing the Ni-NTA resins with 50 mM imidazole, the bound proteins were eluted with 400 μl of 250 mM imidazole and analyzed by SDS/PAGE.
SAXS.
The synchrotron SAXS experiments were performed at the 4C1 beam line (31) of Pohang Light Source. SAXS patterns were recorded at 25°C by a MAR165 CCD detector (MAR USA, Evanston, IL). The magnitude of scattering vectors q = 4π sinθ/λ was 0.15 nm−1<q<5 nm−1, where 2θ is the scattering angle, and λ is the x-ray wavelength (1.608 Å). Proteins in the concentration range of 2–20 mg/ml were exposed typically for 5 min for individual measurements. Two data sets recorded at 2 and 0.5 m were merged to yield the final composite scattering curves. The program GNOM (32) was used to compute the distance distribution function p(r), which represents the probability of finding a point within the particle at a distance r from a given point. An ab initio model of the protein was constructed from solution scattering data by finding the chain-compatible spatial arrangements of the dummy residues that fit into the experimental scattering pattern using the program GASBOR (33). Ten independent models were generated, and the most probable one was chosen by using the program DAMAVER (34). All models were aligned with the most probable one and averaged to compute the probability map, and the averaged model was filtered at a given cutoff volume. The reconstructed models were obtained by imposing the twofold symmetry restriction, assuming that RseB is a dimer in solution.
Supplementary Material
Acknowledgments
This work was supported by 21C Frontier Functional Proteomics Program Grant FPR06B2-120, Ubiquitome Research Program Grant M10533010001-05N3301-00100, National Research Laboratory Program Grant NRL-2006-02287, (to K.K.K.), the National Research Laboratory Program, and the Center for Integrated Molecular Systems (to M.R.). D.Y.K. is supported by Korean Research Foundation Grant C00032.
Abbreviations
- SAXS
small-angle x-ray scattering
- tRseA
truncated RseA.
Footnotes
Data deposition: The atomic coordinate and structure factor of the RseB structure have been deposited in the Protein Data Bank, www.pdb.org (PDB ID code 2P4B).
This article contains supporting information online at www.pnas.org/cgi/content/full/0703117104/DC1.
References
- 1.Connolly L, De Las Penas A, Alba BM, Gross CA. Genes Dev. 1997;11:2012–2021. doi: 10.1101/gad.11.15.2012. [DOI] [PMC free article] [PubMed] [Google Scholar]
- 2.Raivio TL, Silhavy TJ. Annu Rev Microbiol. 2001;55:591–624. doi: 10.1146/annurev.micro.55.1.591. [DOI] [PubMed] [Google Scholar]
- 3.Dartigalongue C, Missiakas D, Raina S. J Biol Chem. 2001;276:20866–20875. doi: 10.1074/jbc.M100464200. [DOI] [PubMed] [Google Scholar]
- 4.Rezuchova B, Miticka H, Homerova D, Roberts M, Kormanec J. FEMS Microbiol Lett. 2003;225:1–7. doi: 10.1016/S0378-1097(03)00480-4. [DOI] [PubMed] [Google Scholar]
- 5.Onufryk C, Crouch ML, Fang FC, Gross CA. J Bacteriol. 2005;187:4552–4561. doi: 10.1128/JB.187.13.4552-4561.2005. [DOI] [PMC free article] [PubMed] [Google Scholar]
- 6.Rhodius VA, Suh WC, Nonaka G, West J, Gross CA. PLoS Biol. 2006;4:e2. doi: 10.1371/journal.pbio.0040002. [DOI] [PMC free article] [PubMed] [Google Scholar]
- 7.Ades SE, Connolly LE, Alba BM, Gross CA. Genes Dev. 1999;13:2449–2461. doi: 10.1101/gad.13.18.2449. [DOI] [PMC free article] [PubMed] [Google Scholar]
- 8.Walsh NP, Alba BM, Bose B, Gross CA, Sauer RT. Cell. 2003;113:61–71. doi: 10.1016/s0092-8674(03)00203-4. [DOI] [PubMed] [Google Scholar]
- 9.Wilken C, Kitzing K, Kurzbauer R, Ehrmann M, Clausen T. Cell. 2004;117:483–494. doi: 10.1016/s0092-8674(04)00454-4. [DOI] [PubMed] [Google Scholar]
- 10.Alba BM, Leeds JA, Onufryk C, Lu CZ, Gross CA. Genes Dev. 2002;16:2156–2168. doi: 10.1101/gad.1008902. [DOI] [PMC free article] [PubMed] [Google Scholar]
- 11.Kanehara K, Ito K, Akiyama Y. Genes Dev. 2002;16:2147–2155. doi: 10.1101/gad.1002302. [DOI] [PMC free article] [PubMed] [Google Scholar]
- 12.Kanehara K, Ito K, Akiyama Y. EMBO J. 2003;22:6389–6398. doi: 10.1093/emboj/cdg602. [DOI] [PMC free article] [PubMed] [Google Scholar]
- 13.Flynn JM, Levchenko I, Sauer RT, Baker TA. Genes Dev. 2004;18:2292–2301. doi: 10.1101/gad.1240104. [DOI] [PMC free article] [PubMed] [Google Scholar]
- 14.Missiakas D, Betton JM, Raina S. Mol Microbiol. 1996;21:871–884. doi: 10.1046/j.1365-2958.1996.561412.x. [DOI] [PubMed] [Google Scholar]
- 15.Jones CH, Danese PN, Pinkner JS, Silhavy TJ, Hultgren SJ. EMBO J. 1997;16:6394–6406. doi: 10.1093/emboj/16.21.6394. [DOI] [PMC free article] [PubMed] [Google Scholar]
- 16.Tam C, Missiakas D. Mol Microbiol. 2005;55:1403–1412. doi: 10.1111/j.1365-2958.2005.04497.x. [DOI] [PubMed] [Google Scholar]
- 17.De Las Penas A, Connolly L, Gross CA. Mol Microbiol. 1997;24:373–385. doi: 10.1046/j.1365-2958.1997.3611718.x. [DOI] [PubMed] [Google Scholar]
- 18.Missiakas D, Mayer MP, Lemaire M, Georgopoulos C, Raina S. Mol Microbiol. 1997;24:355–371. doi: 10.1046/j.1365-2958.1997.3601713.x. [DOI] [PubMed] [Google Scholar]
- 19.Campbell EA, Tupy JL, Gruber TM, Wang S, Sharp MM, Gross CA, Darst SA. Mol Cell. 2003;11:1067–1078. doi: 10.1016/s1097-2765(03)00148-5. [DOI] [PubMed] [Google Scholar]
- 20.Grigorova IL, Chaba R, Zhong HJ, Alba BM, Rhodius V, Herman C, Gross CA. Genes Dev. 2004;18:2686–2697. doi: 10.1101/gad.1238604. [DOI] [PMC free article] [PubMed] [Google Scholar]
- 21.Collinet B, Yuzawa H, Chen T, Herrera C, Missiakas D. J Biol Chem. 2000;275:33898–33904. doi: 10.1074/jbc.m006214200. [DOI] [PubMed] [Google Scholar]
- 22.Ruiz N, Silhavy TJ. Curr Opin Microbiol. 2005;8:122–126. doi: 10.1016/j.mib.2005.02.013. [DOI] [PubMed] [Google Scholar]
- 23.Holm L, Sander C. J Mol Biol. 1993;233:123–138. doi: 10.1006/jmbi.1993.1489. [DOI] [PubMed] [Google Scholar]
- 24.Sulzenbacher G, Canaan S, Bordat Y, Neyrolles O, Stadthagen G, Roig-Zamboni V, Rauzier J, Maurin D, Laval F, Daffe M, et al. EMBO J. 2006;25:1436–1444. doi: 10.1038/sj.emboj.7601048. [DOI] [PMC free article] [PubMed] [Google Scholar]
- 25.Stewart M, Baker RP. J Mol Biol. 2000;299:213–223. doi: 10.1006/jmbi.2000.3733. [DOI] [PubMed] [Google Scholar]
- 26.Ceairliyan BC, Sauer T. Proc Natl Acad Sci USA. 2007;104:3771–3776. doi: 10.1073/pnas.0611567104. [DOI] [PMC free article] [PubMed] [Google Scholar]
- 27.Otwinowski Z, Minor W. Methods Enzymol. 1997;276:307–326. doi: 10.1016/S0076-6879(97)76066-X. [DOI] [PubMed] [Google Scholar]
- 28.Terwilliger TC, Berendzen J. Acta Crystallogr D. 1999;55:849–861. doi: 10.1107/S0907444999000839. [DOI] [PMC free article] [PubMed] [Google Scholar]
- 29.Brunger AT, Adams PD, Clore GM, DeLano WL, Gros P, Grosse-Kunstleve RW, Jiang JS, Kuszewski J, Nilges M, Pannu NS, et al. Acta Crystallogr D. 1998;54:905–921. doi: 10.1107/s0907444998003254. [DOI] [PubMed] [Google Scholar]
- 30.Jones TA, Zou JY, Cowan SW, Kjeldgaard M. Acta Crystallogr A. 1991;47:110–119. doi: 10.1107/s0108767390010224. [DOI] [PubMed] [Google Scholar]
- 31.Bolze J, Kim J, Huang JY, Rah S, Youn HS, Lee B, Shin TJ, Ree M. Macromol Res. 2002;10:2–12. [Google Scholar]
- 32.Semenyuk AV, Svergun DI. J Appl Crystallogr. 1991;24:537–540. [Google Scholar]
- 33.Svergun DI, Petoukhov MV, Koch MHJ. Biophys J. 2001;80:2946–2953. doi: 10.1016/S0006-3495(01)76260-1. [DOI] [PMC free article] [PubMed] [Google Scholar]
- 34.Vladimir VV, Svergun DI. J Appl Crystallogr. 2003;36:860–864. [Google Scholar]
Associated Data
This section collects any data citations, data availability statements, or supplementary materials included in this article.