

Abstract
Liver regeneration after two-thirds surgical partial hepatectomy (PH) in rats treated with the pyrrolizidine alkaloid retrorsine is accomplished through the activation, expansion, and differentiation of a population of small hepatocyte-like progenitor cells (SHPCs). We have examined expression of the major liver-enriched transcription factors, cytochrome P450 (CYP) enzymes, and other markers of hepatocytic differentiation in SHPCs during the protracted period of liver regeneration after PH in retrorsine-exposed rats. Early-appearing SHPCs (at 3–7 days after PH) express mRNAs for all of the major liver-enriched transcription factors at varying levels compared to fully differentiated hepatocytes. In addition, SHPCs lack (or have significantly reduced) expression of mRNA for hepatocyte markers tyrosine aminotransferase and α-1 antitrypsin, but their expression levels of mRNA and/or protein for WT1 and α-fetoprotein (AFP) are increased. With the exception of AFP expression, SHPCs resembled fully differentiated hepatocytes by 14 days after PH. Expression of AFP was maintained by most SHPCs through 14 days after PH, gradually declined through 23 days after PH, and was essentially absent from SHPC progeny by 30 days after PH. Furthermore, early appearing SHPCs lack (or have reduced expression) of hepatic CYP proteins known to be induced in rat livers after retrorsine exposure. The resistance of SHPCs to the mitoinhibitory effects of retrorsine may be directly related to a lack of CYP enzymes required to metabolize retrorsine to its toxic derivatives. These results suggest that SHPCs represent a unique parenchymal (less differentiated) progenitor cell population of adult rodent liver that is phenotypically distinct from fully differentiated hepatocytes, biliary epithelial cells, and (ductular) oval cells.
Replacement of hepatocytes (and liver tissue mass) lost to surgical resection (partial hepatectomy) or toxic injury (necrosis) is typically achieved through the proliferation of fully differentiated, normally quiescent hepatocytes and biliary epithelial cells contained in the residual (viable) tissue. 1-4 Thus, fully differentiated hepatocytes can be viewed as a unipotential progenitor cell for the generation of additional hepatocytes. 5 However, certain forms of toxic hepatocellular injury impair the replicative capacity of hepatocytes, such as the modified Solt-Farber hepatocarcinogenic model 6-9 and the galactosamine model of necrotic liver injury. 10,11 In these models, the liver parenchyma may be replaced via the proliferation and differentiation of liver epithelial (ductular) stemlike cells (oval cells). 12,13 Oval cells are not activated during liver repair in rodents if the mature residual hepatocytes and biliary epithelial cells are capable of proliferating to restore the normal liver mass and structure. 11,14 Therefore, two cell types of the adult rodent liver have been recognized historically to possess “stemlike” characteristics and are able to contribute to liver repair/regeneration under different pathophysiological circumstances: 1) unipotential committed progenitor cells (differentiated hepatocytes and biliary epithelial cells) and 2) multipotential nonparenchymal progenitor cells (oval cells).
We have recently described the cellular responses and time course for liver regeneration after surgical partial hepatectomy (PH) in rats with retrorsine-induced hepatocellular injury. 15 Similar to other models of chemical liver injury, 12,13 systemic exposure to retrorsine results in a severe inhibition of the replicative capacity of fully differentiated hepatocytes. 15-19 When confronted with a strong proliferative stimulus such as PH 15-17,20 or hepatocellular necrosis, 21 retrorsine-injured hepatocytes that are unable to complete mitosis arrest as nonproliferative giant cells (megalocytes). In this model, neither retrorsine-injured, fully differentiated hepatocytes nor oval cells proliferate abundantly to contribute significantly to the restoration of liver mass after PH. Instead, the entire liver mass is reconstituted after PH through a novel cellular response that is mediated by the emergence and rapid expansion of a population of small hepatocyte-like progenitor cells (SHPCs), which share some phenotypic traits with fetal hepatoblasts, oval cells, and fully differentiated hepatocytes but are morphologically and phenotypically distinct from all of these. 15 SHPCs emerge from all regions of the liver lobule after PH and are not associated with modest oval cell outgrowths, suggesting that SHPCs represent a novel cell population. 15 SHPCs morphologically most closely resemble fully differentiated (but small) hepatocytes at early time points after PH, perhaps indicating that SHPCs are a subset of retrorsine-resistant hepatocytes and not a novel progenitor cell population. However, the phenotype of SHPCs suggests that they are in fact distinct from fully differentiated hepatocytes, because a subset of SHPCs express the oval cell/bile duct/fetal liver markers OC.2 and OC.5 through 5 days after PH. 15 Coexpression of hepatocyte markers and oval cell markers by early-appearing SHPCs suggests that these cells either are not fully differentiated or display a transitional phenotype similar to that expected for a cell type between the bipotential hepatoblast (E14) and the fetal hepatocyte (E18–E20).
In the current study, we have used a combined approach involving gene expression analysis of tissues isolated using laser capture microdissection (LCM) and in situ immunohistochemistry to study expression patterns of mRNA and protein, respectively, in the earliest (least differentiated) SHPCs that emerge after PH in retrorsine-exposed rat livers. The results show that early-appearing SHPCs (at 3–7 days after PH) expressed mRNA and/or protein for all of the major liver-enriched transcription factors, WT1, α-fetoprotein (AFP), and P-glycoprotein (Pgp). In addition, compared to hepatocytes early-appearing SHPCs lacked (or had significantly reduced) expression of mRNA for hepatocyte markers tyrosine aminotransferase (TAT) and α-1 antitrypsin (α-1 AT). By 30 days after PH, expression patterns of all markers by SHPCs mirrored that expected for fully differentiated hepatocytes. AFP and WT1 protein were uniquely expressed by SHPCs during the early phase of liver regeneration, suggesting that these markers may be used to identify the earliest progenitors of these cells. SHPCs that emerge and proliferate during the early phase of liver regeneration lack (or had reduced expression) of hepatic cytochrome P450 proteins (CYPs) known to be induced in rat livers after retrorsine exposure (CYP 2E1, CYP 1A2, and CYP 3A1). The resistance of SHPCs to the mitoinhibitory effects of retrorsine may be directly related to a lack of CYP enzymes required to metabolize retrorsine to its toxic derivatives. The results of this study combine with previous observations to strongly suggest that SHPCs represent a unique parenchymal (less differentiated) progenitor cell population of adult rodent liver.
Materials and Methods
Animals
Male German-strain Fischer 344 dipeptidylpeptidase IV (DPPIV)-deficient rats were used in these studies. These rats were bred and maintained in a colony at the University of North Carolina at Chapel Hill. The original breeders were kindly provided by Douglas C. Hixson (Department of Medical Oncology, Rhode Island Hospital, Brown University).
Retrorsine Administration and Partial Hepatectomy
The retrorsine administration protocol 15,16 and experimental design 15 were exactly as previously reported. Six-week-old male littermate Fischer 344 rats (approximately 100 g body weight) received two treatments of retrorsine (30 mg/kg i.p.) 2 weeks apart. The retrorsine working solution was prepared as described. 15,16 Retrorsine (12,18-dihydroxysenecionan-11,16-dione; β-longilobine; Sigma, St. Louis, MO) was added to distilled water at 10 mg/ml and titrated to pH 2.5 with 1 N HCl to completely dissolve the solid. Subsequently, the solution was neutralized using 1 N NaOH, and NaCl was added for a final concentration of 6 mg/ml retrorsine and 0.15 mol/L NaCl (pH 7.0). The working solution was used immediately after preparation. Two-thirds surgical PH was performed on a subset of retrorsine-exposed rats 5 weeks after the second treatment and on unmanipulated control rats of similar age (13 weeks old), essentially as originally described. 22 At 0, 1, 3, 5, 7, 10, 14, 17, 23, and 30 days after PH (n = 3–6 per time point), portions of liver tissue were fixed in 10% neutral buffered formalin processed for RNA or snap-frozen in liquid nitrogen and then placed into embedding medium (OCT) for preparation of cryosections for use in LCM. All studies involving animals were carried out in accordance with federal and state guidelines put forth by the National Institutes of Health and the Institutional Animal Care and Use Committee of the University of North Carolina at Chapel Hill.
RNA Isolation and Amplification
Total liver RNA was obtained from retrorsine-exposed and control rats at t = 0 and 30 days after PH as previously described. 23,24 Liver tissue was solubilized in an RNA extraction buffer consisting of 4 mol/L guanidinium isothiocyanate, 25 mmol/L sodium citrate, 0.1 mol/L β-mercaptoethanol, and 0.5% N-lauroyl-sarcosine. The lysate was placed on a cushion of 5.7 mol/L cesium chloride containing 25 mmol/L sodium acetate and centrifuged at 36,000 rpm in a Beckman SW40 rotor for 18 hours at 24°C.
RNA was obtained from fully differentiated hepatocytes (megalocytes) and SHPCs, using a PixCell laser capture microscope with an infrared diode laser (Arcturus Engineering, Santa Clara, CA), essentially as described 25-29 and shown in Figure 1 ▶ . Portions of snap-frozen liver from retrorsine-exposed rats at 5, 7, 14, and 30 days after PH (n = 3 rats per time point) were sectioned at 6 μm onto uncharged slides. Cryosections were fixed in cold 70% EtOH for 1 minute. and rehydrated for 30 seconds in phosphate-buffered saline (PBS) (136 mmol/L NaCl, 2.7 mmol/L KCl, 10 mmol/L Na2HPO4, and 1.76 mmol/L KH2PO4, pH 7.2) prepared using diethyl pyrocarbonate-treated water. After a brief (1–2 minutes) counterstain in Mayer’s hematoxylin (Sigma), sections were dehydrated through a series of alcohol solutions (70%, 95%, and 100%) for 1 minute. each, cleared in xylene, and allowed to completely dry at room temperature. Microdissection immediately followed tissue preparation. Approximately 50 cells of each type were morphologically identified, microdissected, and solubilized in RNA extraction buffer. To ensure the absence of nonspecific transfer of tissue, we placed the microdissection cap on the tissue without firing the dissecting laser. RNA was extracted using a phenol/chloroform-based procedure based on the Stratagene Microisolation protocol. 30-33 Double-stranded cDNA was synthesized from extracted RNA (Gibco cDNA Synthesis Kit; Life Technologies, Rockville, MD), exactly per the manufacturer’s instructions, with the following exception: first-strand synthesis was initiated using a T7 promoter-oligo(dT) primer as described. 34 The T7 promoter-oligo(dT) primer (5′-TCTAGTCGACGCCCAGTGAATTGTAATACGACTCACTATAGGGCGT21−3′) was synthesized by the UNC Oligonucleotide Synthesis Core Facility, as described. 34 After cDNA synthesis, T4 DNA polymerase (Life Technologies) was added to the reaction mixture and incubated at 16°C for 10 minutes to produce completely blunt ends. Subsequent RNA amplification was achieved using the Ampliscribe T7 Transcription kit (Epicentre Technologies, Madison, WI) exactly per the manufacturer’s recommended protocols. All RNA samples were quantified and normalized using spectrophotometric methods.
Figure 1.
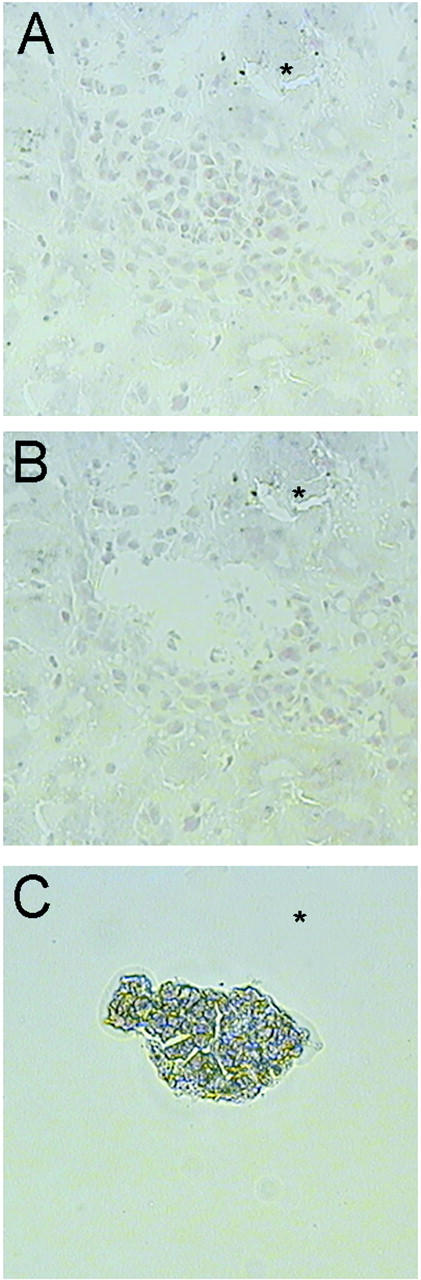
LCM-facilitated isolation of homogeneous cell populations from retrorsine-exposed rat livers after PH. A-C: Microdissection of SHPCs on fixed tissue cryosections from retrorsine-exposed rat liver 5 days after PH. SHPC cell clusters that are identified based on morphological criteria (A) are overlaid with a cap coated with a plastic polymer and targeted for microdissection with a laser to melt the plastic surrounding the cells of interest to fuse them to the surface. Only targeted cells are removed from the tissue (B) and adhere to the cap when lifted from the tissue section (C). * Point of reference
Reverse Transcriptase-Polymerase Chain Reaction
To perform reverse transcriptase-polymerase chain reaction (RT-PCR), 2 μg total whole liver RNA or T7-amplified RNA was reverse-transcribed into cDNA, using Gibco Superscript II Reverse Transcriptase (Life Technologies), for 60 minutes at 42°C, and oligo(dT) as the primer according to standard procedures. 35 The sequence of all PCR primers is summarized in Table 1 ▶ . The PCR primers used to amplify portions of mRNA from CYP reductase and CYPs 1A1, 1A2, 2B1/2, 2E1, and 3A1 were synthesized as described. 36 These PCR primers are complementary to sequences in the mRNA that correspond to sequences of intron/exon boundaries of the respective CYP genes to prevent amplification from genomic DNA template. Oligonucleotide primers for all other mRNAs were designed based on the known cDNA sequence (GenBank). All primers were generated by the UNC Oligonucleotide Synthesis Core Facility. Verification of equal template concentration between samples was accomplished using primers that amplify a portion of actin mRNA (Research Genetics, Huntsville, AL). Amplified PCR products were electrophoresed on 2% agarose gels and visualized using ethidium bromide staining.
Table 1.
Primer Sequences Used for RT-PCR Analysis of Gene Expression in Retrorsine-Exposed Rat Hepatocytes and SHPCs
| Primer name | Sequence (5′-3′) | Annealing temp. (°C) | Amplicon size (bp) |
|---|---|---|---|
| CYP reductase | GAGCACTTCAATGCCATGGGCAAG | 65 | 597 |
| GATGTCCAGGTAGTAGGTGAGGGCC | |||
| CYP 1A1 | GATGCTGAGGACCAGGAAGACCGC | 65 | 679 |
| CAGGAGGCTGGACGAGAATGC | |||
| CYP 1A2 | CTTGGAGAAGCGTGGCCAGG | 55 | 664 |
| CTACAAAGACAACGGTGGTCT | |||
| CYP 2B1/2* | CCAAGCCGTCCACGAGACTT | 60 | 380/404* |
| TTGGGAAGCAGGTACCCTC | |||
| CYP 2E1 | CTGCCCCCAGGACCTTTTCCC | 65 | 847 |
| ATCAGGAGCCCATATCTCAGAGTTGTCCTGGTGGTCTC | |||
| CYP 3A1 | CAGCTCTCACACTGGAAACCTGGG | 60 | 689 |
| CTCATATATTTGGGGTGAGGAATGG | |||
| CYP 4A3 | TCGAGGATCTAAACAACCTGAC | 60 | 573 |
| GGTTGTGATACCTTTGGGTATGG | |||
| C/EBP-α | TTCCAGATCGCACACTGCCC | 65 | 404 |
| TGACCAAGGAGCTCTCAGGC | |||
| C/EBP-β | TGACCAAGGAGCTCTCAGGC | 65 | 419 |
| ACCCACCACCACACACAACCC | |||
| C/EBP-γ | CACTGGACAGCTGGTTAGCC | 60 | 399 |
| TCTCGACGTGACCTGATGGG | |||
| HNF-1α | AGACACCAACCTCAGCACCC | 65 | 463 |
| AGACACCTCAGAGCCATCCC | |||
| HNF-1β | CCGTTCTTGGAAAATGGTGTCCAAGC | 60 | 235 |
| ATGGGAGGAGTGTCATAGTCGTCG | |||
| HNF-3α | TGCAGTACTCTCCTTACGGC | 60 | 714 |
| GGGGAAACTTGTTTAGCTGGG | |||
| HNF-3β | GCCCAGTCACGAACAAAGCC | 60 | 686 |
| GGAACTCTGGCATTCTAGCC | |||
| HNF-3γ | AACTGAAGTTGGATGCGCCC | 60 | 476 |
| ATATGTCCTCCGACATCGCG | |||
| HNF-4 | TCTACAGAGCATTACCTGGC | 60 | 614 |
| TGAGGGGAAGATGAAGACGG | |||
| HNF-6 | GACAAATGGCAGGACGAGGG | 60 | 681 |
| AGCGTACTGGTTTAGGTGCC | |||
| WT1 | GTCAGAAAAAGTTTGCGCGG | 55 | 200 |
| CCATCATGTCCTTTTGTAGG | |||
| α-Fetoprotein | CAGTGAGGAGAAACGGTCCG | 60 | 252 |
| ATGGTCTGTAGGGCTCGGCC | |||
| α-1-Antitrypsin | ATGGATTACCTGGGCAACGC | 60 | 398 |
| TTTTCCCACAAAGAGGGGGC | |||
| Albumin | AAGGCACCCCGATTACTCCG | 60 | 608 |
| TGCGAAGTCACCCATCACCG | |||
| Transferrin | CCTGACAAAACGGTCAAATGGTGC | 60 | 251 |
| TAAAAACTCTGCTGCCACAGGC | |||
| Tyrosine aminotransferase (TAT) | TACTCAGTTCTGCTGGAGCC | 65 | 471 |
| GCAAAGTCTCTAGAGAGGCC |
*The cytochrome P450 mRNA isoforms 2B1 and 2B2 have substantial homology, differing mainly in an additional 24 bp in 2B2. Therefore, these primers amplify both isoforms and amplicons can be distinguished by size on agarose gels.
Immunohistochemistry
Markers of hepatocytes and hematopoietic stem cells were examined on 6-μm formalin-fixed, paraffin-embedded sections and 6-μm cryosections from retrorsine-exposed and control rats 1, 3, 5, 7, 10, 14, 17, 23, and 30 days after PH and from control and retrorsine-exposed rats not surgically manipulated. Hepatocyte markers were identified using antibodies to AFP, Pgp (Santa Cruz Biochemicals, Santa Cruz, CA); cytokeratin 18 (CK18) (Dako, Carpinteria, CA); CYP reductase, CYP 1A1, CYP 2B1, CYP 2E1 (Gentest, Woburn, MA); CYP 4A (Affinity Bioreagents, Golden, CO); and CYP 3A1 (Oxford Biomedical Research, Oxford, MI) in addition to WT1 (Santa Cruz Biochemicals). Hematopoietic stem cell markers were identified using antibodies to Thy-1 (Pharmingen, San Diego, CA) and CD34 (Research Diagnostics, Flanders, NJ). Immunostaining of CK18, Thy-1, and CD34 was performed on 6-μm liver cryosections fixed for 10 minutes in cold 4% paraformaldehyde. All other immunostaining was performed on 6-μm paraffin sections. Indirect immunoperoxidase analysis was performed on paraffin sections that were cleared with xylene and passed through a graded series of alcohols ending with a short incubation (15 minutes) in PBS to fully rehydrate tissue sections. Detection of primary antibodies was accomplished using the avidin/biotin peroxidase system (Vectastain Elite Kit; Vector, Burlingame, CA). Endogenous peroxidase activity was quenched using 0.3% H2O2 in PBS. Blocking of nonspecific activity was accomplished by a 30-minute incubation in buffer containing serum of the secondary antibody species. When necessary, antigenic unmasking was accomplished by either incubation in 0.1% porcine trypsin for 20 minutes (for WT1, Pgp, CYPs 1A1, 2B1, 2E1, and CYP reductase) or by boiling in a 0.01 mol/L citrate buffer consisting of 1.8 mmol/L citric acid and 8.2 mmol/L sodium citrate (pH 6.0) for 10 minutes (for CYP3A1 and AFP). Primary antibodies were diluted by 1:200 (1:100 for AFP) in PBS and incubated on tissue sections for 30 minutes. Biotinylated secondary antibodies (Sigma) were diluted by 1:100 and applied to tissue sections for 30 minutes. Antibody complex was visualized using diaminobenzidine (DAB Kit; Vector) with Mayer’s hematoxylin counterstain. Immunoperoxidase analysis of 4% paraformaldehyde-fixed cryosections incorporated an additional step to block endogenous avidin/biotin binding sites (Avidin/Biotin Blocking Kit; Vector). Primary antibodies were diluted by 1:100 in PBS and incubated on tissue sections for 30 minutes. Immunoperoxidase analysis was performed as described. Negative controls for all immunostaining reactions consisted of replacement of the primary antibody with PBS. All images were captured using a Nikon FXA microscope and color transparency film.
Densitometry and Statistical Analysis
RT-PCR was quantitated by a densitometric-based analysis of digitally captured agarose gels, using Kodak Digital Science 1D software (version 2.02). A two-tailed unpaired t-test was used to generate P values and determine the significance of all quantified differences in pixel density. GraphPad Prism software (version 2.01) was used for all calculations.
Results
Expression of mRNA for Liver-Enriched Transcription Factors by SHPCs
No RNA was obtained from preparations where we placed the microdissection cap on the tissue without firing the laser (data not shown). The results of RT-PCR analysis of liver-enriched transcription factor mRNA expression in retrorsine-injured, growth-arrested megalocytes and SHPCs from the livers of retrorsine-exposed rats after PH are summarized in Figure 2 ▶ . Expression levels of HNF-1α mRNA were similar between SHPCs and megalocytes at all time points examined (Figure 2A) ▶ . However, levels of HNF-1β mRNA were consistently and significantly (P = 0.029) lower in SHPCs 5 days after PH than in megalocytes at the same time point (Figure 2B) ▶ . Conversely, levels of HNF-3α mRNA are significantly (P = 0.012) higher in SHPCs than in megalocytes at this time (Figure 2C) ▶ . Levels of HNF-3β and HNF-3γ mRNA remained consistent between megalocytes and SHPCs at all time points (Figure 2, D and E ▶ , respectively). Expression levels of HNF-4 mRNA were significantly elevated in SHPCs compared to megalocytes 5, 7, and 14 days after PH (P = 0.037, P = 0.031, and P = 0.042, respectively) (Figure 2F) ▶ , whereas levels of HNF-6 mRNA remained consistent between the two cell types across all time points (Figure 2G) ▶ . At 5 and 7 days after PH, mRNA levels of C/EBP-α were significantly lower (P = 0.002 and P = 0.015, respectively) (Figure 2H) ▶ , and mRNA levels of C/EBP-β (Figure 2I) ▶ and C/EBP-γ (Figure 2J) ▶ were significantly higher in SHPCs compared to megalocytes at similar time points (P = 0.027 and P = 0.019, respectively, for C/EBP-β; P = 0.037 and P = 0.044, respectively for C/EBP-γ).
Figure 2.

RT-PCR analysis of liver-enriched transcription factor expression in expanding clusters of SHPCs after PH in the livers of retrorsine-exposed rats. Portions of message were PCR-amplified using primers and annealing temperatures shown in Table 1 ▶ for HNF-1α, 463 bp (A); HNF-1β, 235 bp (B); HNF-3α, 714 bp (C); HNF-3β, 686 bp (D); HNF-3γ, 476 bp (E); HNF-4, 614 bp (F); HNF-6, 681 bp (G); C/EBP-α, 404 bp (H); C/EBP-β, 419 bp (I); and C/EBP-γ, 399 bp (J). M: 100-bp DNA ladder. (−), Negative control consisting of substitution of water for template in the PCR reaction. Lanes 1–4: RNA from hepatic megalocytes 5, 7, 14, and 30 days, respectively, after PH in retrorsine-exposed rats. Lanes 5–8: RNA from SHPCs 5, 7, 14, and 30 days, respectively, after PH in retrorsine-exposed rats.
Expression of mRNA for Hepatocyte Markers by SHPCs
The results of RT-PCR analysis of hepatocyte marker mRNA expression in retrorsine-injured, growth-arrested megalocytes and SHPCs microdissected from the livers of retrorsine-exposed rats after PH are summarized in Figure 3 ▶ . SHPCs in expanding clusters had significantly lower levels of CYP 2E1 mRNA 5 and 7 days after PH (P = 0.026 and P = 0.021, respectively) compared to surrounding megalocytes on the same tissue section (Figure 3A) ▶ . At 14 and 30 days after PH, the amount of CYP 2E1 mRNA in SHPCs increased dramatically to levels approaching that observed in surrounding megalocytes. Differences between the levels of CYP 2E1 mRNA in SHPCs and megalocytes at these later time points were not significantly different (P = 0.062 and P = 0.085, respectively), although SHPCs never expressed a level of CYP 2E1 mRNA that equaled that of the megalocytes at any time point. SHPCs also had significantly lower levels of CYP 3A1 mRNA 5, 7, and 14 days after PH (P < 0.001) compared with megalocytes (Figure 3B) ▶ . CYP 3A1 mRNA levels in SHPCs 30 days after PH were indistinguishable from that of surrounding megalocytes. Five days after PH, SHPCs did not express mRNA for TAT (Figure 3C) ▶ . TAT mRNA expression was initiated in these cells by 7 days after PH, albeit at levels significantly (P = 0.036) lower than those of megalocytes. By 14 days after PH, TAT mRNA expression levels in SHPCs resembled those found in megalocytes. We did not detect α-1 antitrypsin (α-1 AT) mRNA in SHPCs at 5 or 7 days after PH (Figure 3D) ▶ . However, by 14 days after PH, levels of α-1 AT mRNA in SHPCs were statistically (P > 0.05) indistinguishable from those in megalocytes at the same time point. Low levels of AFP mRNA were detected in megalocytes only 5 days after PH (Figure 3E) ▶ . At the same time point, significantly higher levels of AFP mRNA were found in SHPCs (P = 0.0002). SHPCs continued to express detectable AFP mRNA through 14 days after PH, although the relative expression levels at this time were significantly reduced compared with 5 and 7 days after PH (P = 0.0061 and P = 0.025, respectively). WT1 mRNA was not found in megalocytes at any time point (Figure 3F) ▶ . However, high levels of WT1 mRNA were found in SHPCs 5 days after PH and were present at detectable levels in these cells 7 days after PH. WT1 message was rarely present in SHPCs at 14 days after PH and was never present at 30 days after PH. Levels of mRNA for CYP 2B1/2, CYP 4A3, CYP 1A2, CYP reductase, albumin, and transferrin were similar in SHPCs and megalocytes at all time points examined (Figure 3, G–L ▶ , respectively).
Figure 3.

RT-PCR analysis of hepatocyte marker expression in expanding clusters of SHPCs after PH in the livers of retrorsine-exposed rats. Portions of message were PCR-amplified using primers and annealing temperatures shown in Table 1 ▶ for CYP 2E1, 847 bp (A); CYP 3A1, 689 bp (B); TAT, 471 bp (C); α-1 AT, 398 bp (D); AFP, 252 bp (E); WT1, 200 bp (F); CYP 2B1/2, 380/404 bp (G); CYP 4A3, 573 bp (H); CYP 1A2, 664 bp (I); CYP reductase, 597 bp (J); albumin, 608 bp (K); and transferrin, 251 bp (L). M: 100-bp DNA ladder. (−), Negative control consisting of substitution of water for template in the PCR reaction. Lanes 1–4: RNA from hepatic megalocytes 5, 7, 14, and 30 days, respectively, after PH in retrorsine-exposed rats. Lanes 5–8: RNA from SHPCs 5, 7, 14, and 30 days after PH in retrorsine-exposed rats, respectively. To demonstrate equal template concentrations, amplification of actin mRNA for each sample is shown below A, corresponding to samples in respective lanes.
mRNA Expression in Whole Liver Preparations
To show that retrorsine exposure alone does not alter the expression of specific genes in rat liver that appear to be differentially expressed by proliferating/differentiating SHPCs in this model, we examined levels of mRNA for TAT, α-1 AT, WT1, AFP, and CYP 2E1 in whole liver preparations from control and retrorsine-exposed rats before PH and 30 days after PH. Although WT1 message is not normally expressed by hepatocytes, 37 we observed trace levels of WT1 message in all whole liver mRNA preparations, likely reflecting contributions from the mesothelium. 38 AFP mRNA was detected in all whole liver mRNA preparations at consistently higher levels than in microdissected megalocyte preparations, possibly reflecting contributions from cells of the portal triads and periductular cells. 17,39,40 Abundant levels of mRNA for TAT, α-1 AT, and CYP 2E1 were observed in all preparations. However, expression levels did not significantly differ (P > 0.05) between any groups for any mRNA examined (data not shown).
Immunohistochemical Detection of CYP and Pgp Protein in SHPCs
Expression of CYP protein by SHPCs in retrorsine-exposed rats after PH is summarized in Figure 4 ▶ . Similar to previous observations in normal rat livers, 41 we detected CYP protein in all hepatocytes of resting and regenerating livers of control rats, with higher levels located in pericentral and midlobular regions (data not shown). Consistent with RT-PCR data, clusters of SHPCs 5 days after PH had substantially reduced levels of CYP 3A1 protein compared with surrounding megalocytes (Figure 4A) ▶ . The majority of SHPCs in these early clusters had undetectable CYP 3A1 protein, although approximately 10–15% displayed CYP 3A1 expression levels that were similar to those of fully differentiated hepatic megalocytes. At 14 days after PH (Figure 4B) ▶ , most SHPCs continued to demonstrate reduced levels of CYP 3A1, with approximately 20–25% now expressing this protein at levels comparable to those of megalocytes. Between 14 and 23 days after PH, CYP 3A1 expression was seen in increasing numbers of SHPCs, and by 30 days after PH, CYP 3A1 protein levels and distribution resembled those of normal liver (data not shown). At 3 days after PH, most SHPCs had abundant CYP 2B1/2 protein levels that were indistinguishable from those of surrounding megalocytes (Figure 4C) ▶ or control hepatocytes from normal or regenerating liver (data not shown). Expression of CYP 2B1/2 by SHPCs did not change at time points later than 3 days after PH (data not shown). Conversely, 3 days after PH, SHPCs were largely negative for CYP 1A2 (data not shown) and CYP 2E1 (Figure 4D) ▶ . Approximately 75% of all SHPCs at this time point lacked detectable levels of CYP 2E1, 20% expressed low but detectable levels, and 5% had protein levels that resembled those of surrounding megalocytes (Figure 4D) ▶ or hepatocytes from normal or regenerating liver (data not shown). By 5 days after PH, approximately 50% of SHPCs lacked CYP 2E1 protein, and nearly 25% had normal expression levels (data not shown). By 7 days after PH, nearly all SHPCs had levels of CYP 2E1 protein that were indistinguishable from those of surrounding megalocytes (data not shown). The temporal pattern of CYP 1A2 protein expression by SHPCs was very similar to that observed for CYP 2E1 (data not shown). We examined serial sections from retrorsine-exposed rats 5 days after PH for the expression of CYP 2B1/2 and CYP 2E1 (Figure 4, E and F ▶ , respectively) to explore the onset of expression of these two CYP isoforms in proliferating/differentiating clusters of SHPCs. In Figure 4, E and F ▶ , note that SHPCs are either positive for both CYPs (rightmost arrow), negative for both (leftmost arrow), or CYP 2B1-positive and CYP 2E1-negative (uppermost arrow). This observation strongly suggests that CYP 2B1/2 expression precedes that of CYP 2E1 in SHPCs. Consistent with RT-PCR analysis, protein expression levels of CYP 4A, CYP 1A2, and CYP reductase by SHPCs at all time points after PH were comparable to those of surrounding megalocytes and hepatocytes from resting and regenerating control livers (data not shown).
Figure 4.
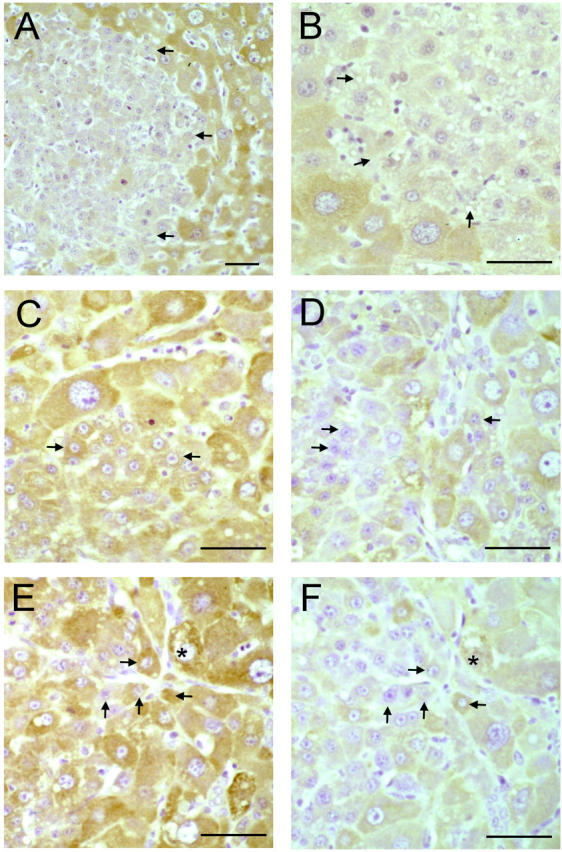
Immunohistochemical detection of cytochrome P450 isoforms in livers of retrorsine-exposed rats after PH. A and B: Indirect immunoperoxidase analysis of CYP 3A1 on liver sections from retrorsine-exposed rats 5 and 14 days after PH, respectively. C and D: Indirect immunoperoxidase analysis of CYP 2B1 and CYP 2E1, respectively, of tissue sections from retrorsine-exposed rats 3 days after PH. E and F: Indirect immunoperoxidase analysis of CYP 2B1 and CYP 2E1, respectively, on serial sections from retrorsine-exposed rats 5 days after PH. A subset of SHPCs in expanding clusters initiates expression of CYP 3A1 5 days after PH (A), although the vast majority of SHPCs still have undetectable (or very low) protein levels of this CYP isoform 14 days after PH (B). Nearly all SHPCs are CYP 2B1-positive 3 days after PH (C), and most are CYP 2E1-negative at the same time point (D). Serial section immunohistochemical analysis of CYP 2B1 (E) and CYP 2E1 (F) on tissue sections 5 days after PH confirms that the initiation of CYP 2B1 expression precedes CYP 2E1 expression. E and F: Note that cells are either positive for both CYPs (rightmost arrow), negative for both (leftmost arrow), or CYP 2B1-positive and CYP 2E1-negative (uppermost arrow). Bar, 50 μm. Arrows, small hepatocyte-like cells. * Reference point.
Pgp is the product of the MDR1 gene and is the most extensively studied member of the MDR family shown thus far to be responsible for drug resistance in certain tumor cells. 42 In the liver, Pgp is weakly expressed on the (apical) bile canaliculi surface of many fully differentiated adult hepatocytes. 43 Our observations of control rat livers were consistent with this observation (data not shown). In control livers after PH, there was a moderate and transient increase in the levels of canalicular Pgp through 3 days after PH that normalized by 5 days after PH (data not shown). This effect was similar, yet more pronounced on megalocytes in retrorsine-exposed rat livers 5 days after PH (Figure 5A) ▶ and persisted though 7 days after PH (data not shown). In control livers, Pgp was always localized to the canalicular surface of hepatocytes and was never found to exist predominately in the cytosol (data not shown). However, in retrorsine-exposed rats in the absence of PH, there were rare cells that were positive for cytoplasmic Pgp (data not shown). Likewise, individual cells in SHPC clusters at 3 days after PH moderately expressed cytoplasmic Pgp (Figure 5B) ▶ that began to localize to the canalicular surface by 5 days after PH (Figure 5A) ▶ . At all time points later than 5 days after PH, the expression of Pgp by SHPC progeny declined and mirrored that of surrounding megalocytes (data not shown).
Figure 5.
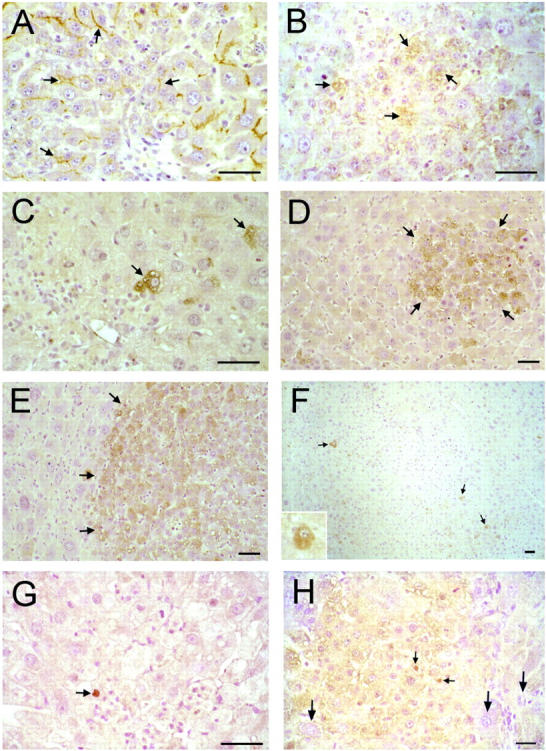
Immunohistochemical detection of hepatocyte markers in livers of retrorsine-exposed rats after PH. A and B: Indirect immunoperoxidase analysis of Pgp on liver sections from retrorsine-exposed rats 5 and 3 days after PH, respectively. C–F: Indirect immunoperoxidase analysis of AFP on liver sections from retrorsine-exposed rats 1, 5, 14, and 23 days after PH, respectively. G and H: Indirect immunoperoxidase analysis of WT1 on liver sections from retrorsine-exposed rat 1 and 5 days after PH. In hepatocytes and SHPCs 5 days after PH (A), Pgp is localized to the bile canaliculi. However, a subset of SHPCs express cytoplasmic Pgp 3 days after PH (B). Small, single AFP-positive hepatocyte-like cells in retrorsine-exposed rat livers are present 1 day after PH (C). Rapidly proliferating SHPCs 5 days after PH form AFP-positive clusters (D). Most SHPCs continue to strongly express AFP through 14 days after PH (E). By 23 days after PH, most SHPCs have ceased expression of AFP, and few AFP-positive cells remain (F). Rare growth-arrested megalocytes are weakly to moderately AFP-positive through 5 days after PH, after which they express trace amounts of AFP at levels similar to those of control rats (the AFP antibody weakly cross-reacts with the adult form of AFP). WT1 protein is localized to the nucleus of rare liver parenchymal cells in retrorsine exposed rats 1 day after PH (G) and is weakly expressed 5 days after PH by proliferating SHPCs and is not expressed by fully differentiated hepatic megalocytes (designated by long arrows) (H). WT1 protein is localized to the nucleus of a small fraction (approximately 5%) of proliferating SHPCs (small arrows, H). Bar, 50 μm. Small arrows, small hepatocyte-like cells. Large arrows (H), growth-arrested, fully differentiated hepatocytes. Note: The inset of F shows a higher magnification of a representative AFP-positive hepatocyte from a different tissue section 23 days after PH.
Immunohistochemical Detection of AFP Protein in SHPCs
Previous studies have documented fetal-form AFP mRNA in rare hepatocytes (approximately 1 in 20,000 cells) of normal rats. 40 Consistent with these observations, we observed rare examples of hepatocytes that were intensely AFP-positive in control livers in the absence of PH and were indistinguishable morphologically from the surrounding hepatocytes. Individual AFP-positive cells in these livers were found in 5% (range 1–9%) of liver lobules. We also observed trace levels of AFP in many parenchymal hepatocytes, inasmuch as the AFP antibody we used for these studies shows minor cross-reactivity with the weakly expressed adult form of AFP. 40,44 Similar to previous observations of AFP mRNA expression in normal rat livers after PH, 17 in control livers through 3 days after PH, we observed intensely AFP-positive cells with a slight increase in prevalence (8 ± 3% of liver lobules), typically found closely spaced (usually as doublets), suggestive of one or two rounds of replication. After 3 days after PH, the relative numbers of AFP-positive cells in control rat livers had returned to pre-PH frequencies. AFP-positive cells in retrorsine-exposed rat livers were present at approximately the same frequency as in control livers (6 ± 4% of liver lobules). However, in contrast to observations in control rats, AFP-positive cells in retrorsine-exposed livers after PH physically resembled, yet were morphologically distinct from, surrounding hepatocytes. They were moderately smaller than surrounding hepatocytes (ie, future megalocytes) and highly vacuolated and possessed scant cytoplasm. At 1 day after PH in retrorsine-exposed rats, only these cells expressed abundant AFP (Figure 5C) ▶ . Consistent with RT-PCR data (Figure 3E) ▶ , growth-arrested megalocytes were weakly to moderately AFP-positive through 5 days after PH (Figure 5D) ▶ , after which they expressed trace amounts of AFP at levels similar to those of control rats (data not shown). During the same time period, small cell clusters previously determined to consist of early-appearing SPHCs 15 expressed substantially higher levels of AFP, and over 90% of SHPCs were AFP-positive at 5 days after PH (Figure 5D) ▶ . AFP-positive hepatocyte-like cells at 1 day after PH morphologically resembled cells forming early clusters of SHPCs at 5 days after PH, 15 although the current study did not produce evidence of a direct lineage relationship between these two cell types. Rapidly proliferating SHPCs remained intensely AFP-positive through 14 days after PH (Figure 5E) ▶ and gradually ceased expression of this protein though 23 days after PH (Figure 5F) ▶ . At 30 days after PH, when the livers of retrorsine/PH rats were essentially indistinguishable from those of controls, 15 the differentiated progeny of SHPCs were AFP-negative, and the number of AFP-positive cells detected was indistinguishable from that observed in unmanipulated control rats (data not shown). AFP-positive oval cells in retrorsine-exposed rat livers were extremely rare at any time point and, as in previous observations, 15 were never associated with proliferating clusters of SHPCs (data not shown).
Immunohistochemical Detection of WT1 Protein, CK18, and Hematopoietic Stem Cells Markers in SHPCs
The protein product of the WT1 gene is a multiple-function tumor suppressor whose aberrant expression has been implicated in the formation of childhood nephroblastomas (Wilms’ tumors). 45 Although WT1 mRNA is not normally detected in adult rat hepatocytes, 37 abundant WT1 mRNA and/or protein can be found in liver mesothelial cells and cultured rat liver epithelial (non-parenchymal) cells (WB-F344 cells, BRL-3A cells, and LE/6 cells). 38,46 Consistent with these observations, we detected WT1 protein in liver mesothelial cells on fixed liver tissue sections, but did not detect WT1 protein in hepatocytes of control and retrorsine-exposed rats in the absence of PH or in control rat livers at any time after PH (data not shown). However, in retrorsine-exposed rat livers at 1 day after PH there were rare parenchymal cells (that most resembled hepatocytes morphologically) that stained intensely for nuclear-localized WT1 (Figure 5G) ▶ . Expression of WT1 was maintained by a substantial subset (>80%) of verified SHPCs (WT1 protein is localized in the nucleus in approximately 5%) at 3, 5 (Figure 5H) ▶ , and 7 days after PH, was gradually lost through 10 days after PH, and returned to undetectable levels (similar to those of control and retrorsine-exposed rats in the absence of PH) by 14 days after PH (data not shown). Oval cells in retrorsine-exposed rat livers did not express WT1 protein at any time (data not shown).
Liver progenitor cells (oval cells) activated in other models of liver injury expressed the hematopoietic stem cell markers CD34 47 and Thy-1. 48 Furthermore, cytoplasmic Pgp is highly expressed by certain immature cell types (such as hematopoietic stem cells). 49 Based on these two observations, we examined SHPCs for the expression of CD34 and Thy-1. CD34 has been shown to be expressed in normal liver by endothelial cells of large hepatic vessels and bile ductular epithelial cells. 47,50 Our observations in retrorsine-exposed and control livers both with and without PH were consistent with these previous findings (data not shown). However, at no time after PH were cells making up SHPC clusters positive for CD34 (data not shown). Oval cells that undergo limited proliferation after PH in the retrorsine model 15 displayed a heterogeneous pattern of CD34 expression (data not shown). Thy-1 is not normally observed in the adult liver but is expressed by oval cells in the 2-acetylaminofluorene/PH model of liver injury. 48 In the current study, we did not detect expression of Thy-1 on any cell type in the livers of any experimental rats (data not shown).
We examined SHPCs for the expression of CK18 because oval cells, hepatocytes, and bile duct epithelial cells express this cytokeratin. 51-53 In the current study, we detected CK18 in bile duct cells in the livers of all experimental rats (data not shown). In retrorsine-exposed rats 5 days after PH and at all times thereafter, CK18 was expressed by both oval cells and SHPCs (data not shown).
Discussion
We have examined temporal patterns of mRNA and protein expression in proliferating and differentiating clusters of SHPCs that emerge after PH in retrorsine-exposed rats. A combined approach was used that employed the relatively new technique of LCM 25,27,28,31,33,34,54 to isolate with absolute purity small clusters of SHPCs from fixed tissue sections. Dissected cells were used to obtain mRNA for use in RT-PCR gene expression analysis to complement immunohistochemical analysis of fixed tissue sections. This experimental design facilitates direct examination of homogeneous cell populations for the expression of various markers of differentiation. Although early-appearing SHPCs have some antigenic determinants in common with fully differentiated hepatocytes, bile duct epithelia, and other liver progenitor cell types (oval cells), it appears that they possess an overall phenotype that would distinguish them from each of these. 15 However, the ultimate precursor cell for SHPCs has not been identified in normal (or retrorsine-exposed) liver. Even though no firm evidence has been found to date establishing a direct lineage relationship between oval cells and SHPCs, 15 this possibility still cannot be completely excluded. SHPCs proliferate extensively after PH in retrorsine-exposed rats while simultaneously acquiring the panoply of markers that are characteristic of fully differentiated hepatocytes. Yet, the molecular mechanism by which SHPCs, and not fully differentiated hepatocytes, are able to escape the proliferative block imposed by retrorsine and expand in number after PH is not known. The results of the current study 1) provide evidence that further distinguishes SHPCs as a cell type that is phenotypically distinct from other parenchymal and progenitor cell types of the rodent liver, 2) describe two unique markers expressed by SHPCs that could potentially be used to identify SHPC precursors in normal rodent liver, and 3) suggest that SHPCs escape the mitoinhibitory effects of retrorsine because they lack or have reduced expression of one or more of the CYP isozymes necessary to produce toxic metabolic derivatives of retrorsine.
The onset (and loss) of various markers of hepatocyte differentiation by early-appearing SHPCs as they proliferate and differentiate suggest that these cells display a phenotype resembling that expected for a transitional cell type between the bipotential hepatoblast (E14) and the fetal hepatocyte (E18–E20) (Figure 6) ▶ . SHPCs at 5 days after PH most resemble fully differentiated hepatocytes morphologically. Therefore, it is significant that these cells express (at varying levels) mRNA for all of the major families of liver-enriched transcription factors normally expressed by adult hepatocytes. At 5 days after PH, SHPCs have abundant mRNA for the liver “establishment factors” HNF-1α, HNF-3, and HNF-4 (see Figure 2, A, C ▶ -F, respectively) proposed by Lai and Darnell 55 to be important for liver development before embryonic day 16 (E16). As in embryonic liver development, 56 mRNA levels for HNF-3α and HNF-4 in (maturing) SHPCs decrease 5 days after PH, at the time when mRNA levels for HNF-1β increase. The combined results of numerous studies have shown that the transcription factor C/EBP-α has reciprocal mRNA expression levels compared to C/EBP-γ and C/EBP-β in actively regenerating liver after PH. 57,58 In response to PH, levels of C/EBP-α mRNA are dramatically decreased, whereas levels of C/EBP-β and C/EBP-γ mRNA are transiently increased. Similarly, expression levels of these transcription factors follow similar patterns at 5 and 7 days after PH in SHPCs, perhaps reflecting the intense proliferation occurring in this cell compartment. This implies that certain transcription factors may have similar roles during liver regeneration in both proliferating SHPCs and normal hepatocytes. The significance of increased levels of mRNA for HNF-3 and HNF-4 in early-appearing SHPCs is currently unknown, though it is possible to imagine some role for these transcription factors in the proliferation, maturation, and/or differentiation of these cells. However, because many genes expressed in the liver are capable of being regulated by multiple transcription factors (and other factors) 59 and none of the transcription factors mentioned thus far are capable of starting a hepatocyte differentiation program by themselves, 60 the precise consequence of relative levels of liver-enriched transcription factor mRNA in SHPCs is currently unknown.
Figure 6.

Expression of protein and/or mRNA for markers of differentiation in developing embryonic rat liver. Early-appearing SHPCs express a phenotypic profile that resembles that expected for a transitional cell type that is between the bipotential hepatoblast (E14) and the fetal hepatocyte (E18–E20). Markers of differentiation initiated in rat livers on or by E14 expressed in bipotential hepatoblasts, and at various times afterward in hepatocyte-determined cells culminating in birth, are summarized from the published literature. 13,41,51,56,59-61,63-67,91,92 Expression of markers of differentiation by SHPCs 5 days after PH (contained within the box) is summarized from the results of the current study and previously published results. 15 The +/− designation refers to either the presence or the absence of mRNA and/or protein for the marker on subsets of SHPC populations 5 days after PH and does not indicate relative expression levels within populations positive for the marker. SHPC marker expression without the +/− designation implies uniform positive or negative expression for all observed SHPCs or that the extent of expression in SHPC subpopulations is not known (eg, for RT-PCR-derived data).
Although many markers of hepatocyte differentiation are already present on early SHPCs (and E14 bipotential hepatoblasts), there is a conspicuous lack of mRNA and/or protein expression of hepatocyte markers whose expression is initiated at or later than E18–20 by some (or all) SHPCs. SHPCs at 5 days after PH completely lack mRNA expression of TAT, a marker of fully differentiated hepatocytes whose expression is not detected before birth. 61 However, it is not clear why SHPCs cells lack expression of α-1 AT at this time point, because this mRNA is detected as early as E13 in fetal mouse liver. 62 The lack of CYP 2E1 and CYP 3A1 protein expression (and concurrent robust expression of CYP 2B1/2, albumin, and transferrin) by a substantial number of SHPCs at 5 days after PH further substantiates the “transitional” nature of proliferating SHPCs, because CYP 2E1 and CYP 3A1 are not detected until near or at the time of birth in the rat. 41,63-66 Furthermore, SHPCs display transient expression between 5 and 7 days after PH of two antigens recognized by the monoclonal antibodies OC.2 67,68 and OC.5 93 which are historically used to identify oval cells and bile duct epithelial cells and study cell lineage relationships in developing liver. 15 The cytoplasmic distribution of the multidrug transporter Pgp 42,69-71 in the earliest (most primitive) clusters of SHPCs at 3 days after PH suggests that these cells are initiating expression of this protein for the first time, because Pgp is rapidly localized to the bile canalicular membrane (as in fully differentiated hepatocytes) by 5 days after PH.
The results of the current study indicate that continued expression of AFP and WT1 5 days after PH by SHPCs (and the concordant lack of expression of certain hepatocyte markers, such as CYP 3A1) further distinguishes these cells phenotypically and morphologically from oval cells, bile duct epithelial cells, and fully differentiated hepatocytes (megalocytes) in the retrorsine/PH model. The fact that retrorsine-injured hepatocytes are weakly and transiently AFP mRNA- and protein-positive is not surprising. It is well known that under certain conditions (such as chemical injury), the liver is capable of reinitiating expression of AFP (summarized in ref. 17 ). Interestingly, Dabeva and colleagues 17 have noted AFP expression patterns in retrorsine-exposed livers after PH (concurrent with transplantation of isolated hepatocytes) that differ from the results presented here. These investigators observe substantially elevated levels of AFP mRNA (using in situ hybridization) in extensively proliferated oval cells of retrorsine-exposed livers after PH. In the absence of transplanted hepatocytes, we report here that the few oval cells that emerged after PH in these livers 15 were essentially AFP-negative (Figure 5E) ▶ . Furthermore, Dabeva and colleagues did not observe AFP mRNA in well-circumscribed clusters of proliferating endogenous small hepatocytes, although small hepatocytes/transitional cells that colocalized with oval cells were AFP-positive. 17 It is plausible that the endogenous small hepatocytes characterized by Dabeva and colleagues are members of the SHPC compartment we describe here and elsewhere, 15 because the transplantation of hepatocytes concurrent with PH by these authors represents a substantial departure from the experimental design of the current study. It is possible that the endogenous small hepatocyte compartment in rodent liver reacts differently in retrorsine-exposed rats receiving isolated normal hepatocyte cell transplantation from those not receiving cell transplants.
The expression of moderate levels of WT1 protein by SHPCs during the early phase of liver regeneration is intriguing. WT1 is expressed in a spatial and temporal manner during urogenital development and is best known for its role as a tumor suppressor. 45 Although WT1 is not normally expressed in hepatocytes, we (and others) 38 have previously shown that WT1 mRNA and protein are present in WB-F344 cells. 46 WB-F344 cells are a line of undifferentiated liver epithelial stemlike cells (originally isolated from a normal rat) capable of hepatocytic differentiation on transplantation into the livers of host rats. 72,73 Furthermore, WT1 protein is localized mainly to the nucleus in these cells in vitro (unpublished observations). The fact that a subset of SHPCs (∼5%) maintain nuclear-localized WT1 expression through the early phase of liver regeneration in this model may suggest that as the SHPC population proliferates and differentiates, there is maintenance of a more “stemlike” subset of cells in this compartment until such time when it is no longer needed. However, the precise role of WT1 protein in SHPCs is not understood at this point. WT1 may interact with genes and/or proteins that are important in the regulation of liver growth and differentiation, inasmuch as WT1 has been shown to regulate many growth-related genes. 74-77 WT1 is also responsible for the onset of epithelial differentiation (via repression of bcl-2 and c-myc) during renal development. 78 Potential targets of WT1-induced transcriptional repression in highly proliferative SHPCs could include transforming growth factor-β, 76 because this growth factor is a negative regulator of proliferation in rodent hepatocytes after PH. 79
The resistance of oval cells to a number of different carcinogens, many of which are mitoinhibitory to mature hepatocytes (such as 2-acetylaminofluorene), is due to the absence of carcinogen-activated CYPs. 9,80-82 Oval cells that proliferate in these models lack expression of CYP enzymes when they first appear. 9 However, these cells initiate expression of CYP enzymes when they differentiate and form foci of small basophilic hepatocytes. 7 At the dose used in the current study, retrorsine induces the expression of mRNA and/or protein for CYP 2E1, CYP 2B1/2, CYP 1A2, and CYP 1A1. 83 Other laboratories have also implicated CYP 3A1 in the bioactivation of other retrorsine-related family members to their active metabolites. 84-86 These findings and the results of the current study, showing reduced (or complete lack of) expression of CYP 2E1 and CYP 3A1 mRNA and/or protein by SHPCs, combine to strongly suggest that the earliest appearing SHPCs (or their ultimate progenitor) escape the mitoinhibitory effects of retrorsine because they lack or have reduced expression of one or more of the CYPs required for the bioactivation of this pyrrolizidiue alkyloid. Unlike most enzymes, which possess relatively high substrate specificity, CYPs are capable of metabolizing a number of structurally diverse compounds. 87,88 In addition, it is possible for a compound to be a CYP substrate in the absence of increased levels of CYP mRNA and/or protein. 88 Thus the fact that we did not previously detect enhanced mRNA or protein levels for CYP 3A1 after retrorsine exposure 83 does not necessarily exclude CYP 3A1 from playing a role in the bioactivation of retrorsine. Various liver-enriched transcription factors (the mRNAs of which are expressed by SHPCs), such as HNF-1, HNF-3, HNF-4, and C/EBP, have been implicated in the regulation of the expression of CYP genes. 89 As such, the reason for decreased levels of CYP 3A1 and CYP 2E1 protein in cells of early SHPC clusters is not clear, but could involve mechanisms of posttranscriptional regulation. Even though CYP 3A1 mRNA is detected as early as E15 in developing liver, 64 CYP 3A1 protein cannot be detected until a day or two before birth. 66 Likewise, neither CYP 2E1 mRNA or protein can be detected in rat livers until after birth, likely because of methylation-related chromatin accessibility issues. 90
In summary, the results of this study and previous observations 15 combine to suggest 1) that SHPCs represent a previously uncharacterized parenchymal progenitor cell population of adult rodent liver that is phenotypically and/or morphologically distinct from fully differentiated hepatocytes, biliary epithelial cells, and oval cells; 2) that SHPCs escape the mitoinhibitory effects of retrorsine because they lack the appropriate CYP enzymes needed to produce toxic retrorsine metabolites; and 3) that the earliest progenitor cells for emerging SHPC clusters are found within the hepatic parenchyma (and not in portal spaces) and could possibly be identified by the expression of AFP and/or (nuclear-localized) WT protein.
Acknowledgments
We thank Dr. Robert C. Bagnell and Victoria Madden of the Microscopy Services Laboratory of the University of North Carolina at Chapel Hill Department of Pathology and Laboratory Medicine for their expert assistance in the preparation of the color photomicrographs.
Footnotes
Address reprint requests to Dr. William B. Coleman, Department of Pathology and Laboratory Medicine, University of North Carolina School of Medicine, CB 7525, Chapel Hill, NC 27599. E-mail: wbcolemn@med.unc.edu.
Preliminary findings were presented at Experimental Biology 2000 (San Diego, CA) and published in abstract form: Gordon GJ, Coleman WB, Grisham JW: Early-appearing small hepatocyte-like progenitor cells in the retrorsine model of hepatocellular injury and regeneration lack expression of cytochrome P450 enzymes. FASEB J 2000, 14:A285.
Supported by grants CA29323 (to J.W.G.) and CA78434 (to W.B.C.) from the National Institutes of Health.
References
- 1.Grisham JW: A morphologic study of deoxyribonucleic acid synthesis and cell proliferation in regenerating rat liver. Autoradiography with thymidine-H3. Cancer Res 1962, 26:842–849 [PubMed]
- 2.Fabrikant JI: The kinetics of cellular proliferation in regenerating liver. J Cell Biol 1968, 36:551-565 [DOI] [PMC free article] [PubMed] [Google Scholar]
- 3.Grisham JW: Cellular proliferation in the liver. Recent Results Cancer Res 1969, 17:28-43 [Google Scholar]
- 4.Wright N, Alison M: The Biology of Epithelial Cell Populations. 1984. Clarendon Press, Oxford
- 5.Thorgeirsson SS: Hepatic stem cells in liver regeneration. FASEB J 1996, 10:1249-1256 [PubMed] [Google Scholar]
- 6.Evarts RP, Nagy P, Nakatsukasa H, Marsden E, Thorgeirsson SS: In vivo differentiation of rat liver oval cells into hepatocytes. Cancer Res 1989, 49:1541-1547 [PubMed] [Google Scholar]
- 7.Golding M, Sarraf CE, Lalani E-N, Anilkumar TV, Edwards RJ, Nagy P, Thorgeirsson SS, Alison MR: Oval cell differentiation into hepatocytes in the acetylaminofluorene-treated regenerating rat liver. Hepatology 1995, 22:1243-1253 [DOI] [PubMed] [Google Scholar]
- 8.Evarts RP, Hu Z, Omori N, Marsden ER, Thorgeirsson SS: Precursor-product relationship between oval cells and hepatocytes: comparison between tritiated thymidine and bromodeoxyuridine as tracers. Carcinogenesis 1996, 17:2143-2151 [DOI] [PubMed] [Google Scholar]
- 9.Alison M, Golding M, Lalani E-N, Nagy P, Thorgeirsson S, Sarraf C: Wholesale hepatocytic differentiation in the rat from ductular oval cells, the progeny of biliary stem cells. J Hepatol 1997, 26:343-352 [DOI] [PubMed] [Google Scholar]
- 10.Lemire JM, Shiojiri N, Fausto N: Oval cell proliferation and the origin of small hepatocytes in liver injury induced by d-galactosamine. Am J Pathol 1991, 139:535-552 [PMC free article] [PubMed] [Google Scholar]
- 11.Dabeva MD, Shafritz DA: Activation, proliferation, and differentiation of progenitor cells into hepatocytes in the d-galactosamine model of liver regeneration. Am J Pathol 1993, 143:1606-1620 [PMC free article] [PubMed] [Google Scholar]
- 12.Grisham JW, Thorgeirsson SS: Liver stem cells. Potten CS eds. Stem Cells. 1997, :pp 233-282 Academic Press, New York [Google Scholar]
- 13.Coleman WB, Grisham JW: Epithelial stem-like cells of the rodent liver. Strain A Diehl AM eds. Liver Growth and Repair. 1998, :pp 50-99 Chapman and Hall, London [Google Scholar]
- 14.Klinman NR, Erslev AJ: Cellular response to partial hepatectomy. Proc Soc Exp Biol Med 1963, 112:338-340 [DOI] [PubMed] [Google Scholar]
- 15.Gordon GJ, Coleman WB, Grisham JW: Liver regeneration in rats with retrorsine-induced hepatocellular injury proceeds through a novel cellular response. Am J Pathol 2000, 156:607-619 [DOI] [PMC free article] [PubMed] [Google Scholar]
- 16.Laconi E, Oren R, Mukhopadhyay DK, Hurston E, Laconi S, Pani P, Dabeva MD, Shafritz DA: Long-term, near-total liver replacement by transplantation of isolated hepatocytes in rats treated with retrorsine. Am J Pathol 1998, 153:319-329 [DOI] [PMC free article] [PubMed] [Google Scholar]
- 17.Dabeva MD, Laconi E, Oren R, Petkov PM, Hurston E, Shafritz DA: Liver regeneration and alpha-fetoprotein messenger RNA expression in the retrorsine model for hepatocyte transplantation. Cancer Res 1998, 58:5825-5834 [PubMed] [Google Scholar]
- 18.Oren R, Dabeva M, Karnezis AN, Petkov PM, Rosencrantz R, Sandhu JP, Moss SF, Wang S, Hurston E, Laconi E, Holt PR, Thung SN, Zhu L, Shafritz DA: Role of thyroid hormone in stimulating liver repopulation in the rat by transplanted hepatocytes. Hepatology 1999, 30:903-913 [DOI] [PubMed] [Google Scholar]
- 19.Oren R, Dabeva MD, Petkov PM, Hurston E, Laconi E, Shafritz DA: Restoration of serum albumin levels in nagase analbuminemic rats by hepatocyte transplantation. Hepatology 1999, 29:75-81 [DOI] [PubMed] [Google Scholar]
- 20.Laconi E, Dabeva M, Laconi S, Pani P, Mukhopadhyay D, Oren R, Shafritz DA: Rapid proliferation of transplanted syngeneic DPPIV+ hepatocytes in the liver of pyrrolizidine alkaloid treated DPPIV− Fischer rats. FASEB J 1997, 11:A304 [Google Scholar]
- 21.Jago MV: The development of hepatic megalocytosis of chronic pyrrolizidine alkaloids poisoning. Am J Pathol 1969, 56:405-422 [PMC free article] [PubMed] [Google Scholar]
- 22.Higgins GM, Anderson RM: Experimental pathology of the liver. I. Restoration of the liver of the white rat following partial surgical removal. Arch Pathol 1931, 12:186–202
- 23.Chirgwin J, Przybyla A, MacDonald R, Rutter W: Isolation of biologically active ribonucleic acid from sources enriched in ribonuclease. Biochemistry 1979, 18:5294-5299 [DOI] [PubMed] [Google Scholar]
- 24.Glisin V, Crkvenjakov R, Byus C: Ribonucleic acid isolated by cesium chloride centrifugation. Biochemistry 1974, 13:2633-2638 [DOI] [PubMed] [Google Scholar]
- 25.Bonner RF, Emmert-Buck M, Cole K, Pohida T, Chuaqui R, Goldstein S, Liotta LA: Laser capture microdissection: molecular analysis of tissue. Science 1997, 278:1481-1483 [DOI] [PubMed] [Google Scholar]
- 26.Dean-Clower E, Vortmeyer AO, Bonner RF, Emmert-Buck M, Zhuang Z, Liotta LA: Microdissection-based genetic discovery and analysis applied to cancer progression. Cancer J Sci Am 1997, 3:259-265 [PubMed] [Google Scholar]
- 27.Emmert-Buck MR, Bonner RF, Smith PD, Chuaqui RF, Zhuang Z, Goldstein SR, Weiss RA, Liotta LA: Laser capture microdissection. Science 1996, 274:998-1001 [DOI] [PubMed] [Google Scholar]
- 28.Simone NL, Bonner RF, Gillespie JW, Emmert-Buck MR, Liotta LA: Laser-capture microdissection: opening the microscopic frontier to molecular analysis. Trends Genet 1998, 14:272-276 [DOI] [PubMed] [Google Scholar]
- 29.Simone NL, Remaley AT, Charboneau L, Petricoin EFI, Glickman JW, Emmert-Buck MR, Fleisher TA, Liotta LA: Sensitive immunoassay of tissue cell proteins procured by laser capture microdissection. Am J Pathol 2000, 156:445-452 [DOI] [PMC free article] [PubMed] [Google Scholar]
- 30.Suarez-Quian CA, Goldstein SR, Pohida T, Smith PD, Peterson JI, Wellner E, Ghany M, Bonner RF: Laser capture microdissection of single cells from complex tissues. Biotechniques 1999, 26:328-335 [DOI] [PubMed] [Google Scholar]
- 31.Jin L, Thompson CA, Qian X, Kuecker SJ, Kulig E, Lloyd RV: Analysis of anterior pituitary hormone mRNA expression in immunophenotypically characterized single cells after laser capture microdissection. Lab Invest 1999, 79:511-512 [PubMed] [Google Scholar]
- 32.Glasow A, Haidan A, Gillespie J, Kelly PA, Chrousos GP, Bornstein SR: Differential expression of prolactin receptor (PRLR) in normal and tumorous adrenal tissues: separation of cellular endocrine compartments by laser capture microdissection (LCM). Endocr Res 1998, 24:857-862 [DOI] [PubMed] [Google Scholar]
- 33.Fend F, Emmert-Buck MR, Chuaqui R, Cole K, Lee J, Liotta LA, Raffeld M: Immuno-LCM: laser capture microdissection of immunostained frozen sections for mRNA analysis. Am J Pathol 1999, 154:61-66 [DOI] [PMC free article] [PubMed] [Google Scholar]
- 34.Luo L, Salunga RC, Guo H, Bittner A, Joy KC, Galindo JE, Xiao H, Rogers K, Wan JS, Jackson MR, Erlander MG: Gene expression profiles of laser-captured adjacent neuronal subtypes. Nat Med 1999, 5:117-122 [DOI] [PubMed] [Google Scholar]
- 35.Larrick JW, Siebert PD: Reverse Transcriptase PCR. 1995. Ellis Horwood, London
- 36.Hodgson AV, White TB, White JW, Strobel HW: Expression analysis of the mixed function oxidase system in rat brain by the polymerase chain reaction. Mol Cell Biochem 1993, 120:171-179 [DOI] [PubMed] [Google Scholar]
- 37.Walker C, Rutten F, Yuan X, Pass H, Mew DM, Everitt J: Wilms’ tumor suppressor gene expression in rat and human mesothelioma. Cancer Res 1994, 54:3101-3106 [PubMed] [Google Scholar]
- 38.Faris RA, McBride A, Yang L, Affigne S, Walker C, Cha C-J: Isolation, propagation, and characterization of rat liver serosal mesothelial cells. Am J Pathol 1994, 145:1432-1443 [PMC free article] [PubMed] [Google Scholar]
- 39.Alpini G, Aragona E, Dabeva M, Salvi R, Shafritz DA, Tavoloni N: Distribution of albumin and α-fetoprotein mRNAs in normal, hyperplastic, and preneoplastic rat liver. Am J Pathol 1992, 141:623-632 [PMC free article] [PubMed] [Google Scholar]
- 40.Lemire JM, Fausto N: Multiple α-fetoprotein RNAs in adult rat liver: cell type-specific expression and differential regulation. Cancer Res 1991, 51:4656-4664 [PubMed] [Google Scholar]
- 41.Maurel P: The CYP3 family. Ioannides C eds. Cytochromes P450: Metabolic and Toxicological Aspects. 1996, :pp 241-270 CRC Press, New York [Google Scholar]
- 42.Gottesman MM: How cancer cells evade chemotherapy: Sixteenth Richard and Hinda Rosenthal Foundation Award Lecture. Cancer Res 1993, 53:747-754 [PubMed] [Google Scholar]
- 43.Thiebaut F, Tsuruo T, Hamada H, Gottesman MM, Pastan I, Willingham MC: Cellular localization of the multidrug-resistance gene product p-glycoprotein in normal human tissues. Proc Natl Acad Sci USA 1987, 84:7735-7738 [DOI] [PMC free article] [PubMed] [Google Scholar]
- 44.Wan Y-J, Chou JY: Expression of the α-fetoprotein gene in adult rat liver. Arch Biochem Biophys 1989, 270:267-276 [DOI] [PubMed] [Google Scholar]
- 45.Reddy JC, Licht JD: The WT1 Wilms’ tumor suppressor gene: how much do we really know? Biochim Biophys Acta 1996, 1287:1-28 [DOI] [PubMed] [Google Scholar]
- 46.Coleman WB, Ricketts SL, Borchert KM, Presnell SC, Esch GL, McCullough KD, Weissman BL, Smith GJ, Grisham JW: Induction of WT1 gene expression correlates with human chromosome 11p11.2-p12-mediated suppression of tumorigenicity in rat liver epithelial tumor cell lines. Int J Oncol 1999, 14:957–963 [DOI] [PubMed]
- 47.Omori N, Omori M, Evarts RP, Teramoto T, Miller MJ, Hoang TN, Thorgeirsson SS: Partial cloning of rat CD34 cDNA and expression during stem cell-dependent liver regeneration in the adult rat. Hepatology 1997, 26:720-727 [DOI] [PubMed] [Google Scholar]
- 48.Petersen BE, Goff JP, Greenberger JS, Michalopoulos GK: Hepatic oval cells express the hematopoietic stem cell marker Thy-1 in the rat. Hepatology 1998, 27:433-445 [DOI] [PubMed] [Google Scholar]
- 49.Chaudhary PM, Roninson IB: Expression and activity of p-glycoprotein, a multidrug efflux pump, in human hematopoietic stem cells. Cell 1991, 66:85-94 [DOI] [PubMed] [Google Scholar]
- 50.Krause DS, Fackler MJ, Civin CI, May CS: CD34: structure, biology, and clinical utility. Blood 1996, 87:1-13 [PubMed] [Google Scholar]
- 51.Shiojiri N, Lemire JM, Fausto N: Cell lineages and oval cell progenitors in rat liver development. Cancer Res 1991, 51:2611-2620 [PubMed] [Google Scholar]
- 52.Moll R, Franke WW, Schiller DL, Geiger B, Krepler R: The catalogue of human cytokeratins: patterns of expression in normal epithelia, tumors, and cultured cells. Cell 1982, 31:11-24 [DOI] [PubMed] [Google Scholar]
- 53.Pack R, Heck R, Dienes HP, Oesch F, Steinberg P: Isolation, biochemical characterization, long-term culture, and phenotype modulation of oval cells from carcinogen-fed rats. Exp Cell Res 1993, 204:198-209 [DOI] [PubMed] [Google Scholar]
- 54.Cui X, Feiner H, Lin Z, Li H: Multiplex genotype analysis of invasive carcinoma and accompanying proliferative lesions microdissected from breast tissue. J Mol Diag 2000, 2:29-36 [DOI] [PMC free article] [PubMed] [Google Scholar]
- 55.Lai E, Darnell JE: Transcriptional control in hepatocytes: a window on development. Trends Biochem Sci 1991, 16:427-430 [DOI] [PubMed] [Google Scholar]
- 56.Nagy P, Bisgaard HC, Thorgeirsson SS: Expression of hepatic transcription factors during liver development and oval cell differentiation. J Cell Biol 1994, 126:223-233 [DOI] [PMC free article] [PubMed] [Google Scholar]
- 57.Flodby P, Antonson P, Barlow C, Blanck A, Porsch-Hallstrom I, Xanthopoulos KG: Differential patterns of expression of three C/EBP isoforms, HNF-1, and HNF-4 after partial hepatectomy in rats. Exp Cell Res 1993, 208:248-256 [DOI] [PubMed] [Google Scholar]
- 58.Bucher NLR, Farmer SR: Liver regeneration following partial hepatectomy: genes and metabolism. Strain A Diehl AM eds. Liver Growth and Repair. 1998, :pp 3-19 Chapman and Hall, London [Google Scholar]
- 59.Zaret K: Genetic control of hepatocyte differentiation. Arias IM Boyer JL Fausto N Jakoby WB Schachter D Shafritz DA eds. The Liver: Biology and Pathobiology. 1994, :pp 53-68 Raven Press, New York [Google Scholar]
- 60.Pietrangelo A, Shafritz DA: Gene expression during pathophysiologic states. Arias IM Boyer JL Fausto N Jakoby WB Schachter D Shafritz DA eds. The Liver: Biology and Pathobiology. 1994, :pp 85-98 Raven Press, New York [Google Scholar]
- 61.Greengard O: Enzymic differentiation in mammalian liver. Science 1969, 163:891-895 [DOI] [PubMed] [Google Scholar]
- 62.Meehan RR, Barlow DP, Hill RE, Hogan BL, Hastie ND: Pattern of serum protein gene expression in mouse visceral yolk sac and foetal liver. EMBO J 1984, 3:1881-1885 [DOI] [PMC free article] [PubMed] [Google Scholar]
- 63.Rich KJ, Boobis AR: Expression and inducibility of P450 enzymes during liver ontogeny. Microsc Res Tech 1997, 39:424-435 [DOI] [PubMed] [Google Scholar]
- 64.Omiecinski CJ, Hassett C, Costa P: Developmental expression and in situ localization of the phenobarbital-inducible rat hepatic mRNAs for cytochromes CYP2B1, CYP2B2, CYP2C6, and CYP 3A1. Mol Pharmacol 1990, 38:462-470 [PubMed] [Google Scholar]
- 65.Nims RW, Lubet RA: The CYP2B family. Ioannides C eds. Cytochromes P450: Metabolic and Toxicological Aspects. 1996, :pp 135-160 CRC Press, New York [Google Scholar]
- 66.Hulla JE, Juchau MR: Occurrence and inducibility of cytochrome P450IIIA in maternal and fetal rats during prenatal development. Biochemistry 1989, 28:4871-4879 [DOI] [PubMed] [Google Scholar]
- 67.Hixson DC, Faris RA, Thompson NL: An antigenic portrait of the liver during carcinogenesis. Pathobiology 1990, 58:65-77 [DOI] [PubMed] [Google Scholar]
- 68.Hixson DC, Allison JP: Monoclonal antibodies recognizing oval cells induced in the liver of rats by N-2-fluorenylacetamide or ethionine in a choline-deficient diet. Cancer Res 1985, 45:3750-3760 [PubMed] [Google Scholar]
- 69.van Helvoort A, Smith AJ, Sprong H, Fritzsche I, Schinkel A, Borst P, van Meer G: MDR-1 P-glycoprotein is a lipid translocase of broad specificity, while MDR3 P-glycoprotein specifically translocates phosphatidylcholine. Cell 1996, 87:507-517 [DOI] [PubMed] [Google Scholar]
- 70.Gros P, Buschman E: The mouse multidrug resistance gene family: structural and functional analysis. Int Rev Cytol 1993, 137C:169-197 [PubMed] [Google Scholar]
- 71.Gottesman MM, Pastan I: Biochemistry of multidrug resistance mediated by the multidrug transporter. Annu Rev Biochem 1993, 62:385-427 [DOI] [PubMed] [Google Scholar]
- 72.Coleman WB, McCullough KD, Esch GL, Faris RA, Hixson DC, Smith GJ, Grisham JW: Evaluation of the differentiation potential of WB-F344 rat liver epithelial stem-like cells in vivo. Am J Pathol 1997, 151:353-359 [PMC free article] [PubMed] [Google Scholar]
- 73.Coleman WB, Wennerberg AE, Smith GJ, Grisham JW: Regulation of the differentiation of diploid and some aneuploid rat liver epithelial (stemlike) cells by the hepatic microenvironment. Am J Pathol 1993, 142:1373-1382 [PMC free article] [PubMed] [Google Scholar]
- 74.Englert C, Hou X, Maheswaran S, Bennett P, Ngwu C, Re GG, Garvin J, Rosner MR, Haber DA: WT1 suppresses synthesis of the epidermal growth factor receptor and induces apoptosis. EMBO J 1995, 14:4662-4675 [DOI] [PMC free article] [PubMed] [Google Scholar]
- 75.Werner H, Re GG, Drummond IA, Sukhatme VP, Rauscher FJ, Sens DA, Garvin AJ, LeRoith D, Roberts CT: Increased expression of the insulin-like growth factor I receptor gene, IGFIR, in Wilms’ tumor is correlated with the modulation of IGF1R promoter activity by the WT1 Wilms’ tumor gene product. Proc Natl Acad Sci USA 1993, 90:5828-5832 [DOI] [PMC free article] [PubMed] [Google Scholar]
- 76.Dey BR, Sukhateme VP, Roberts AB, Sporn MB, Rauscher FJ, Kim SJ: Repression of the transforming growth factor-beta 1 gene by the Wilms’ tumor suppressor WT1 gene product. Mol Endocrinol 1994, 8:592-602 [DOI] [PubMed] [Google Scholar]
- 77.Drummond IA, Madden SL, Rohwer-Nutter P, Bell GI, Sukhatme VP, Rauscher FJ: Repression of the insulin-like growth factor II gene by the Wilms’ tumor suppressor WT1. Science 1992, 257:674-678 [DOI] [PubMed] [Google Scholar]
- 78.Hewitt SM, Hamada S, McDonnell TJ, Rauscher FJ, Saunders GF: Regulation of the proto-oncogenes bcl-2 and c-myc by the Wilms’ tumor suppressor gene WT1. Cancer Res 1995, 55:5386-5389 [PubMed] [Google Scholar]
- 79.Fausto N, Webber EM: Liver regeneration. Arias IM Boyer JL Fausto N Jakoby WB Schachter D Shafritz DA eds. The Liver: Biology and Pathobiology. 1994, :pp 1059-1084 Raven Press, New York [Google Scholar]
- 80.Ledda GM, Sells MA, Yokoyama S, Lombardi B: Metabolic properties of isolated rat liver cell preparations enriched in epithelial cells other than hepatocytes. Int J Cancer 1983, 31:231-237 [DOI] [PubMed] [Google Scholar]
- 81.Mathis GA, Walls SA, D’Amico P, Gengo TF, Sirica AE: Enzyme profile of rat bile ductular epithelial cells in reference to the resistant phenotype in hepatocarcinogenesis. Hepatology 1989, 9:477-485 [DOI] [PubMed] [Google Scholar]
- 82.Sirica AE, Mathis GA, Sano A, Elmore LW: Isolation, culture, and transplantation of intrahepatic biliary epithelial cells and oval cells. Pathobiology 1990, 58:44-64 [DOI] [PubMed] [Google Scholar]
- 83.Gordon GJ, Coleman WB, Grisham JW: Induction of cytochrome P450 enzymes in the livers of rats treated with the pyrrolizidine alkaloid retrorsine. Exp Mol Pathol 2000, 69:17-26 [DOI] [PubMed] [Google Scholar]
- 84.Chung WG, Buhler DR: The effect of spironolactone treatment on the cytochrome P450-mediated metabolism of the pyrrolizidine alkaloid senecionine by hepatic microsomes from rats and guinea pigs. Toxicol Appl Pharmacol 1994, 127:314-319 [DOI] [PubMed] [Google Scholar]
- 85.Reid MJ, Lame MW, Morin D, Wilson DW, Segall HJ: Involvement of cytochrome P450 3A in the metabolism and covalent binding of 14C-monocrotaline in rat liver microsomes. J Biochem Mol Toxicol 1998, 12:157-166 [DOI] [PubMed] [Google Scholar]
- 86.Dalvi RR: Dose-related inhibition of the drug-metabolizing enzymes of rat liver by the pyrrolizidine alkaloid, monocrotaline. J Pharm Pharmacol 1987, 39:386-388 [DOI] [PubMed] [Google Scholar]
- 87.Vermeulen NPE: Role of metabolism in chemical toxicity. Ioannides C eds. Cytochromes P450: Metabolic and Toxicological Aspects. 1996, :pp 29-54 CRC Press, New York [Google Scholar]
- 88.Guengerich FP: The chemistry of cytochrome P450 reactions. Ioannides C eds. Cytochromes P450: Metabolic and Toxicological Aspects. 1996, :pp 55-76 CRC Press, New York [Google Scholar]
- 89.Morgan ET, Sewer MB, Iber H, Gonzalez FJ, Lee Y-H, Tukey RH, Okino S, Vu T, Yue-Hwa C, Sidhu JS, Omiecinski CJ: Physiological and pathophysiological regulation of cytochrome P450. Drug Metab Dispos 1998, 26:1232-1240 [PubMed] [Google Scholar]
- 90.Gonzalez FJ, Lee Y-H: Constitutive expression of hepatic cytochrome P450 genes. FASEB J 1996, 10:1112-1117 [DOI] [PubMed] [Google Scholar]
- 91.Hixson DC, Faris RA, Novikoff P: Antigenic clues to liver development, renewal, and carcinogenesis: an integrated model. Sirica AE eds. The role of cell types in hepatocarcinogenesis. 1992, :pp 151-182 FL, CRC Press, Boca Raton [Google Scholar]
- 92.Hixson DC, Chapman L, McBride A, Faris R, Yang L: Antigenic phenotypes common to rat oval cells, primary hepatocellular carcinomas and developing bile ducts. Carcinogenesis 1997, 18:1169-1175 [DOI] [PubMed] [Google Scholar]
- 93.Hixson DC, Brown J, McBride AC, Affigue S: Differentiation status of rat ductal cells and ethionine-induced hepatic carcinomas defined with surface-reactive monoclonal antibodies. Exp Mol Pathol 2000, 68:152-169 [DOI] [PubMed] [Google Scholar]