Abstract
The receptive fields for simple cells in visual cortex show a strong preference for edges of a particular orientation and display adjacent excitatory and inhibitory subfields. These subfields are projections from ON-center and OFF-center lateral geniculate nucleus cells, respectively. Here we present a single-cell model using ON and OFF channels, a natural scene environment, and synaptic modification according to the Bienenstock, Cooper, and Munro (BCM) theory. Our results indicate that lateral geniculate nucleus cells must act predominantly in the linear region around the level of spontaneous activity, to lead to the observed segregation of ON/OFF subfields.
The Bienenstock, Cooper, and Munro (BCM) theory of cortical plasticity (1) yields consequences that are in agreement with the observed response properties of visual cortical neurons in natural and various deprived visual environments. These response properties include orientation selectivity (2), ocular dominance (3, 4), and direction selectivity (5). The BCM theory allows modeling and theoretical analysis of various visual deprivation experiments, such as monocular deprivation (MD), binocular deprivation (BD), and reverse suture (RS), and is in agreement with many experimental results on visual cortical plasticity (6–9).
It has, further, been shown that the postulates of this theory [homosynaptic modification as a function of postsynaptic depolarization as well as the moving threshold–the crossover point between long-term depression (LTD) and long-term potentiation (LTP)] are consistent with experimental results on LTD and LTP (10–12).
In this paper, we extend the BCM theory to the analysis of ON-center and OFF-center retinal and LGN cells, and investigate whether BCM synaptic modification can account for the segregation of the ON/OFF subfields. There is evidence that the adjacent excitatory and inhibitory subfields (13) of orientation-selective cells in visual cortex are projections from ON-center and OFF-center retinal and LGN cells, respectively (14), and that the proper development of the cortical receptive fields requires activity [for review, see Fregnac and Imbert (15)].
We explore the segregation of the ON- and OFF-center LGN afferents, by using a model of a single cortical cell with inputs from ON and OFF LGN cells, and an environment composed of natural scenes. Our results indicate that there is a relation between the organization of simple receptive fields and the shape of the input distribution.
Methods
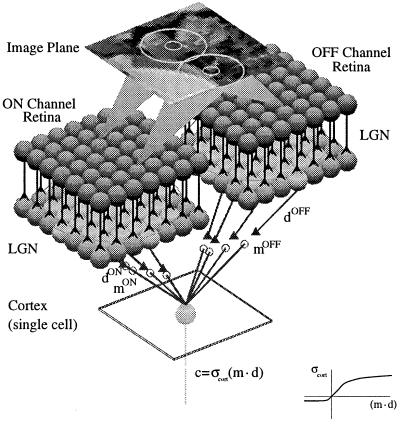
In our simulations of the receptive field development of single cells in visual cortex, the neuron receives input from two channels; one corresponds to ON-center lateral geniculate cells, and the other to OFF-center cells. See Fig. 1 for the visual environment, and Fig. 2 for the visual pathway in a (monocular) ON/OFF channel model.
Figure 1.
Visual environment. To model the visual environment, we use 12 gray-scale images of size 256 × 256 pixels; the figure shows three sample images. A circle of diameter 13 pixels (white circle in left image) defines the visual field or retinal patch of a simulated neuron in V1. In each step of the simulation, we sample a small part of the environment by randomly shifting the position of the circle. The inputs from this region of the visual field are then preprocessed by the retinal machinery and serve as input to the cortical cell.
Figure 2.
Visual pathway in a monocular ON/OFF channel model. The retina is composed of arrays of receptors (Image Plane) and ganglion cells (ON Channel Retina and OFF Channel Retina). Each ganglion-cell receptive field has an antagonistic center-surround structure that we model by convolving the images with difference-of-Gaussians filters (ON-center or OFF-center), with the biologically observed 3-to-1 ratio of the radii for the surround to the center (22). The ON and OFF pathways do not interact at the level of the LGN but converge in the cortex.
The two pathways (ON and OFF) do not interact at the level of the LGN but converge in the cortex (16). We represent the total input to the BCM neuron by d = [dON,dOFF], which is measured relative to the LGN spontaneous activity or some other baseline activity (see below), and the synaptic weights† by m = [mON,mOFF]. The response of the cortical cell is given by c = σcort(m⋅d), where σcort(⋅) is a rectifying sigmoid that sets the minimum and maximum values of the postsynaptic response (see Fig. 2 Inset) relative to spontaneous cortical activity.
We assume that the ON and OFF pathways have the same retinotopic organization and overlapping ganglion receptive fields. This assumption is consistent with the complete coverage of the visual field by both ON and OFF cells (18). The vectors dON and dOFF are then related according to
 |
1 |
where K is a constant, and the values Di represent the input pattern after retinal processing with an excitatory-center difference-of-Gaussians (DOG) filter. Note that the DOG filter is balanced so that uniform illumination of the ganglion/LGN receptive field leads to Di = 0 (diON = diOFF = K), which we call the spontaneous activity of the LGN.‡ The LGN activation function σ is given by
 |
where the lower cut-off Dmin is negative.
We use BCM synaptic modification (1) to simulate plasticity in the thalamo-cortical synapses. BCM postulates that potentiation of an active synapse occurs when the postsynaptic response exceeds a critical value—called the modification threshold (θM)—and depression occurs when postsynaptic activity falls below θM. For the ON/OFF channel model, we write
 |
 |
4 |
where φ = c(c − θM) and the modification threshold is given by
 |
5 |
Table 1 summarizes the BCM equations and parameters used in the simulations.
Table 1.
Summary of BCM equations and the parameters used in the simulation
| Equations | |
| Synaptic modification | ṁ = μφd |
| φ = c(c − θM) | |
θṀ
=  (c2 −
θM) (c2 −
θM) |
|
| Cortical output | c = σcort (m⋅d) |
| σcort (−∞) = −1 | |
| σcort (+∞) = 100 | |
| Parameters | |
| Retinal patch diameter | 13 pixels |
| Retinal DOG ratio | 1:3 |
| Initial synaptic weights | Random 0.0–0.1 |
| Initial threshold | θ0 = 0.7 |
| Learning rate | μ = 10−6 |
| Memory constant | τ = 300–1000 |
Results
We know from previous BCM simulations, with an ON channel only and total input d = dON = D, that the neuron develops receptive fields with adjacent excitatory and inhibitory bands, similar to the fields of simple cells found in striate cortex. Fig. 3 shows some typical examples of receptive fields or synaptic weights msingle from a “single-channel” model.
Figure 3.
Example of simple cell receptive fields in a “single-channel” model, where the total input is d = dON = D. The light areas represent excitatory regions, and the dark areas represent inhibitory regions.
In this section, we extend the previous work to study receptive field formation in the presence of both ON and OFF channels. We study two cases of Eq. 1, which we call “linear” and “non-linear,” respectively.
Linear Region.
In the linear region, the cortical neuron receives inputs from both ON and OFF channels with the condition that LGN cell activities satisfy −|Dmin| < Di < |Dmin| (see linear region in Fig. 5a). As before, LGN activities are measured relative to spontaneous activity. Eq. 1 then reduces to
 |
6 |
where Di are the input values after retinal preprocessing with an ON-center DOG filter. Note, in particular, that ON and OFF cells that see the same part of the retina display opposite responses to light of any intensity. As we shall see later, this fact has important consequences for the segregation of ON and OFF projections during development.
Figure 5.
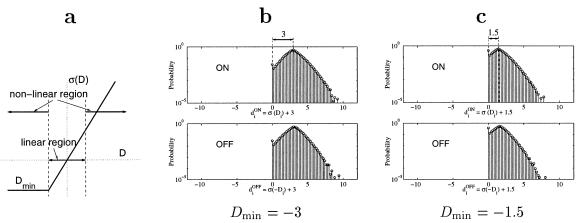
The magnitude of the lower cut-off Dmin can be interpreted as the difference between the spontaneous activity and the minimal activity of the LGN cells. (a) Linear vs. the non-linear working regions of the LGN cells. The cells operate in the linear region (“symmetric” responses) when −|Dmin| < Di < |Dmin|, and in the non-linear region (“non-symmetric” responses) when Di > |Dmin| or Di < −|Dmin|. (b and c) Probability distributions (y axis; log-scale) of inputs from ON and OFF cells when Dmin = −3 and Dmin = −1.5, respectively. Note that, whereas the input distributions are almost symmetrical around spontaneous activity for linear LGN cells (Fig. 4a), they are strongly asymmetrical for Dmin = −1.5.
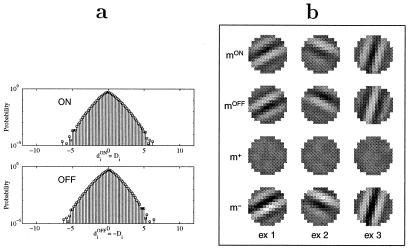
Fig. 4a shows the probability distributions of inputs from ON and OFF cells. Under the current assumptions on the visual environment and the retinal preprocessing, linear LGN responses are equivalent to distributions symmetric around the level of spontaneous LGN activity.
Figure 4.
LGN in the linear region, where diON = Di and diOFF = −Di. (a) Probability distributions (log-scale) of inputs from linear ON and OFF cells. Note that the distributions are almost symmetrical around spontaneous activity (di = 0). (b) Examples of final weight configurations mON, mOFF, m+, and m− (see text). Different columns (ex 1, ex 2, ex 3) represent results from simulations with different initial conditions and different sequences of inputs.
Fig. 4b shows the simulation results. The first two rows represent the synaptic weights mON and mOFF. The brightness codes for the strengths of the synaptic weights. In the simulation, we have allowed the synaptic weights to change polarity during learning.§ The weights could be interpreted as effective synapses in a mean-field approximation (17) of a network of BCM neurons, rather than single-cell synapses. In the figure, bright regions correspond to excitatory effective synapses, and dark regions represent inhibitory effective synapses. Because the net effect of the mean field is background inhibition, this result is consistent with having subregions of strong and weak (excitatory) thalamo-cortical connections, respectively.
The relation between mON and mOFF is perhaps more obvious in the third and fourth rows in Fig. 4b, where we have introduced the “sum” and “difference” configurations m+ and m−:
 |
7 |
We see that the summed configuration m+ lacks significant structure. Furthermore, the mean of m+ is around zero. The above indicates that miON ≈ −miOFF, i.e., the synapses from ON and OFF cells that see the same part of the retina become opposite in strength or density during development.
By analyzing the BCM equations, one can show that¶
 |
8 |
 |
9 |
where msingle is the weight configuration for a single channel model.‖ The relation predicts that (i) the final ON and OFF receptive fields display the same type of elongated subregions of strong and weak connections as in previous single-channel models, and (ii) subregions of strong ON synapses overlap subregions of weak OFF synapses and vice versa. These two predictions are in agreement with the simulation results in Fig. 4b. The results also agree with experimental findings, for example Reid and Alonso (14), that both the subregion organization and the orientation of simple receptive fields are well established by converging thalamic inputs. The simulation results are furthermore robust to random noise, inexact coincidence of ON/OFF fields, restricting the synaptic weights to positive values, and a shift in the “baseline level” for LGN activity.**
Non-Linear Region.
The segregation of ON and OFF thalamo-cortical projections obtained above follows from the assumption that ON and OFF geniculate cells that see the same part of the retina have opposite responses relative to spontaneous LGN activity (Eq. 6). Obviously, this assumption cannot be valid for light of any intensity, because the absolute LGN cell activity must be positive. For example, assume that the spontaneous activity is 14 Hz for all LGN cells. If an ON (OFF) cell fires with frequency 24 Hz, the OFF (ON) cell that sees the same part of the retina fires with frequency 4 Hz. However, light that leads to a response above 30 Hz of an ON (OFF) cell, will inhibit all activity of the corresponding OFF (ON) cell.
LGN cells operate in the linear region (“symmetric” responses) when −|Dmin| < Di < |Dmin|, and in the non-linear region (“non-symmetric” responses) when Di > |Dmin| or Di < −|Dmin| (see Fig. 5a). With the LGN activation function σ defined by Eq. 4, the magnitude of the lower cut-off Dmin can be interpreted as the difference between the spontaneous activity and the minimal activity of the LGN cells.
In the simulations below, we choose the minimal LGN activity as the “baseline” (i.e., d0 in Eq. 3). For robustness (see below), we also add Gaussian noise to the input for each synapse. The inputs are
 |
10 |
where niON(t) and niOFF(t) are independent Gaussian random numbers with mean zero and standard deviation SDn.
To investigate the effect of the non-linear region where responses are “non-symmetric,” we perform simulations with a cut-off at different values between Dmin = −3 and Dmin = −1.5. Note that, whereas the input distributions are almost symmetrical around spontaneous activity for linear cells (Fig. 4a), they are asymmetrical with this cut-off. Fig. 5 b and c shows the probability distributions of inputs from ON and OFF cells when Dmin = −3 and Dmin = −1.5, respectively.
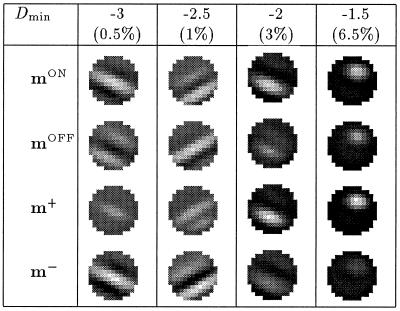
The results of simulations, for different values of Dmin are shown in Fig. 6. The noise level SDn = 0.7. One observes that a stronger asymmetry in the inputs qualitatively changes the results, from reversed ON/OFF configurations mON ≈ −mOFF or m+ ≈ 0 (see, for example, Dmin = −3) to equal ON/OFF configurations mON ≈ mOFF or m− ≈ 0 (see, for example, Dmin = −1.5).
Figure 6.
Simulations results for cut-off at different values of Dmin; the percentage shows the fraction of the inputs that are cut-off at Dmin. The noise level SDn = 0.7. The figure shows that a stronger asymmetry in the inputs yields a change in the results, from reversed ON/OFF configurations mON ≈ −mOFF or m+ ≈ 0 (see, for example, Dmin = −3) to equal ON/OFF configurations mON ≈ mOFF or m− ≈ 0 (see, for example, Dmin = −1.5).
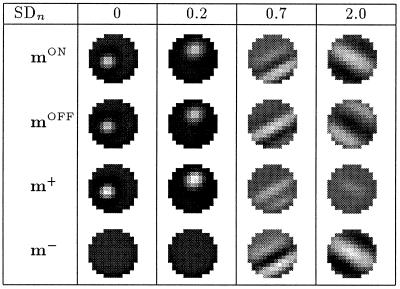
We have repeated the simulations for a range of different noise levels and found that the type of ON/OFF configuration (“reversed” or “equal”) depends on both the noise level SDn and the cut-off Dmin. If no noise is present, any cut-off in the inputs leads to “equal” weight configurations, i.e., no segregation of ON and OFF subfields. In the presence of noise, however, we obtain reversed weight configurations for almost symmetric inputs and equal configurations for very asymmetric inputs. As a rule, the model becomes less sensitive to an asymmetry in the LGN responses for larger noise levels, i.e., we can push the transition from “reversed” to “equal” weight configurations toward sharper cut-offs (larger values of Dmin) by increasing the noise level. Fig. 7 shows that ON and OFF afferents fail to segregate for a cut-off at Dmin = −2.5 when no or little noise is present (see, for example, SDn = 0.2). The same asymmetry, however, leads to segregated ON and OFF subfields for higher noise levels (see, for example, SDn = 0.7).
Figure 7.
Final weight configurations for a cut-off at Dmin = −2.5 and different noise levels SDn. We see that the ON and OFF afferents fail to segregate (mON ≈ mOFF or m− ≈ 0) when no or little noise, for example SDn ≤ 0.2, is present. The same asymmetry, however, leads to segregated ON and OFF subfields (mON ≈ −mOFF or m+ ≈ 0) for higher noise levels, for example SDn ≥ 0.7.
Discussion
Receptive fields of orientation-selective cells in visual cortex are composed of excitatory and inhibitory subfields connected to ON and OFF center retinal and LGN cells, respectively. Various theoretical ideas have been proposed to account for the manner in which this subfield segregation develops.
In this paper we show that BCM synaptic modification can account for the subfield segregation observed after eye opening if the input from LGN cells is almost symmetric about their level of spontaneous activity (the linear region as defined in Results). This result is robust to large levels of noise. A significant non-linearity in LGN responses can break the subfield segregation and can even effect orientation selectivity. The degree of non-linearity required for breaking the subfield segregation is inversely proportional to the degree of noise in LGN responses.
This observation suggests an interesting connection between the statistical distribution of LGN activity and the segregation of ON/OFF subfields that can be tested experimentally by examining the statistics of LGN neurons under natural viewing conditions. Two simple statistics would need to be extracted from such measurements: the noise level and the degree of non-linearity. These measurements would test the validity of BCM synaptic modification in ON/OFF segregation of simple receptive fields.
As a comparison, others (19–21) have modeled the segregation of ON-OFF subfields by using a model based on competition. These models, however, cannot be compared with the current work in a straightforward manner because they focus on the pre–eye-opening development of orientation selectivity. Furthermore, they start by constructing the correlation functions needed to obtain ON/OFF segregation (see refs. 20 and 21) for some of the constraints that are imposed by the requirement for ON/OFF segregation), rather than by using the correlations that arise from a natural environment and the preprocessing it undergoes in retina and LGN. The results of these models seem to depend critically on the details of the correlation functions, and a test for the validity of the models would here be to experimentally measure the ON and OFF correlation functions for realistic inputs.
These different views about the observed phenomenon of ON/OFF center subfield segregation provide an opportunity for further experimental tests (see, for example, above) to elucidate the situation.
The simulation results in this paper and others are reproducible by using the PLASTICITY SIMULATION PACKAGE available at the site http://www.cns.brown.edu/ibns/cooper/index.html.
Supplementary Material
Acknowledgments
This work was supported in part by the Charles A. Dana Foundation and the Office of Naval Research. A.B.L. was additionally supported by the Burroughs-Wellcome Graduate Research Fellowship.
Abbreviations
- BCM
Bienenstock, Cooper, and Munro
- LGN
lateral geniculate nucleus
Footnotes
Synaptic weights are interpreted as “effective” weights that incorporate the net effect of inhibition in a many-neuron system [see the mean-field theory of Cooper and Scofield (17)]. They can thus be both positive (excitatory) and negative (inhibitory).
 |
2 |
 |
3 |
However, restricting the weights to positive values by, for example, imposing hard bounds on the weight values, has no noticeable effect on the receptive field arrangement.
See Appendix B: Analysis of Subfield Segregation, which is published as supplementary data on the PNAS web site, www.pnas.org.
For the shifted inputs in Eq. 3, we get m+(t) = m+(t=0) + a small constant.
See Appendix A: Robustness of Results, which is published as supplementary data on the PNAS web site, www.pnas.org.
References
- 1.Bienenstock E L, Cooper L N, Munro P W. J Neurosci. 1982;2:32–48. doi: 10.1523/JNEUROSCI.02-01-00032.1982. [DOI] [PMC free article] [PubMed] [Google Scholar]
- 2.Law C, Cooper L. Proc Natl Acad Sci USA. 1994;91:7797–7801. doi: 10.1073/pnas.91.16.7797. [DOI] [PMC free article] [PubMed] [Google Scholar]
- 3.Shouval H, Intrator N, Law C C, Cooper L N. Neural Comput. 1996;8:1021–1040. doi: 10.1162/neco.1996.8.5.1021. [DOI] [PubMed] [Google Scholar]
- 4.Shouval H, Intrator N, Cooper L N. Vision Res. 1997;37:3339–3342. doi: 10.1016/s0042-6989(97)00087-4. [DOI] [PubMed] [Google Scholar]
- 5.Blais B, Cooper L N, Shouval H. Neural Comput. 2000;12:1057–1066. doi: 10.1162/089976600300015501. [DOI] [PubMed] [Google Scholar]
- 6.Clothiaux E E, Cooper L N, Bear M F. J Neurophysiol. 1991;66:1785–1804. doi: 10.1152/jn.1991.66.5.1785. [DOI] [PubMed] [Google Scholar]
- 7.Intrator N, Cooper L N. Neural Networks. 1992;5:3–17. [Google Scholar]
- 8.Blais B, Shouval H, Cooper L N. Proc Natl Acad Sci USA. 1999;96:1083–1087. doi: 10.1073/pnas.96.3.1083. [DOI] [PMC free article] [PubMed] [Google Scholar]
- 9.Rittenhouse C D, Shouval H Z, Paradiso M A, Bear M F. Nature (London) 1999;397:347–350. doi: 10.1038/16922. [DOI] [PubMed] [Google Scholar]
- 10.Dudek S M, Bear M F. Proc Natl Acad Sci USA. 1992;89:4363–4367. doi: 10.1073/pnas.89.10.4363. [DOI] [PMC free article] [PubMed] [Google Scholar]
- 11.Kirkwood A, Gold S M, Dudek J T, Aizenman C, Bear M F. Science. 1993;260:1518–1521. doi: 10.1126/science.8502997. [DOI] [PubMed] [Google Scholar]
- 12.Kirkwood A, Rioult M G, Bear M F. Nature (London) 1996;381:526–528. doi: 10.1038/381526a0. [DOI] [PubMed] [Google Scholar]
- 13.Jones J P, Palmer L A. J Neurophysiol. 1987;58:1187–1258. doi: 10.1152/jn.1987.58.6.1187. [DOI] [PubMed] [Google Scholar]
- 14.Reid R C, Alonso J. Nature (London) 1995;378:281–284. doi: 10.1038/378281a0. [DOI] [PubMed] [Google Scholar]
- 15.Frégnac Yves, Imbert M. Physiol Rev. 1984;64:325–434. doi: 10.1152/physrev.1984.64.1.325. [DOI] [PubMed] [Google Scholar]
- 16.Schiller P H. Nature (London) 1982;297:580–583. doi: 10.1038/297580a0. [DOI] [PubMed] [Google Scholar]
- 17.Cooper L N, Scofield C L. Proc Natl Acad Sci USA. 1988;85:1973–1977. doi: 10.1073/pnas.85.6.1973. [DOI] [PMC free article] [PubMed] [Google Scholar]
- 18.Kandel E R, Schwartz J H. Principles of Neural Science. New York: Elsevier; 1985. [Google Scholar]
- 19.Miller K D. J Neurosci. 1994;14:409–441. doi: 10.1523/JNEUROSCI.14-01-00409.1994. [DOI] [PMC free article] [PubMed] [Google Scholar]
- 20.Piepenbrock C, Ritter H, Obermayer K C. Neural Comput. 1997;9:959–970. doi: 10.1162/neco.1997.9.5.959. [DOI] [PubMed] [Google Scholar]
- 21.Erwin E, Miller K D. J Neurosci. 1998;18:9870–9895. doi: 10.1523/JNEUROSCI.18-23-09870.1998. [DOI] [PMC free article] [PubMed] [Google Scholar]
- 22.Linsenmeier R A, Frishman L J, Jakiela H G, Enroth-Cugell C. Vision Res. 1982;22:1173–1183. doi: 10.1016/0042-6989(82)90082-7. [DOI] [PubMed] [Google Scholar]
Associated Data
This section collects any data citations, data availability statements, or supplementary materials included in this article.


