

Abstract
The human BMI-1 and EZH2 polycomb group (PcG) proteins are constituents of two distinct complexes of PcG proteins with gene regulatory activity. PcG proteins ensure correct embryonic development by suppressing homeobox genes, and they also contribute to regulation of lymphopoiesis. The two PcG complexes are thought to regulate different target genes and probably have different tissue distributions. Altered expression of PcG genes is linked to transformation in cell lines and induction of tumors in mutant mice, but the role of PcG genes in human cancers is relatively unexplored. Using antisera specific for human PcG proteins, we used immunohistochemistry and immunofluorescence to detect BMI-1 and EZH2 PcG proteins in Reed-Sternberg cells of Hodgkin’s disease (HRS). The expression patterns were compared to those in follicular lymphocytes of the lymph node, the normal counterparts of HRS cells. In the germinal center, expression of BMI-1 is restricted to resting Mib-1/Ki-67− centrocytes, whereas EZH2 expression is associated with dividing Mib-1/Ki-67+ centroblasts. By contrast, HRS cells coexpress BMI-1, EZH2, and Mib-1/Ki-67. Because HRS cells are thought to originate from germinal center lymphocytes, these observations suggests that Hodgkin’s disease is associated with coexpression of BMI-1 and EZH2 in HRS cells.
Hodgkin’s disease (HD) is characterized by isolated Hodgkin and Reed-Sternberg (HRS) tumor cells, surrounded by a non-neoplastic infiltrate consisting of T cells, B cells, eosinophils, and plasma cells. 1 Two lines of evidence recently identified classical HRS cells as descendants of a germinal center (GC) B cell. In addition to other B-cell-specific genes, 2 HRS cells frequently express the B-cell-specific activator protein (BSAP) 3 and BCL-6, a marker for GC B cells. 4 Furthermore, HRS cells contain completed Ig H chain rearrangements. 5-7 These genes generally exhibit extensive somatic mutations, a characteristic of B lymphocytes that underwent antigen selection in secondary lymphoid tissue. 5,7 HRS cells have lost the ability to express B cell receptors owing to the presence of stop codons and crippling mutations in the Ig H chain gene. 8 B cells with such mutations are usually eliminated during the GC reaction, but HRS cells have escaped this fate. 7,9,10
The mechanism that underlies formation of HRS cells is unclear. Expression of oncogenes such as c-myc, c-raf, c-fos, and N-ras does not seem to be altered in HRS cells with respect to surrounding non-neoplastic cells. 11-13 Aberrant expression of tumor necrosis factor receptor (TNF-R) family members, 14,15 abnormalities in the apoptosis pathway, 15-17 the presence of Epstein-Barr virus, 18 nuclear accumulation of p53, 19 or down-regulation of CD99 20 may all contribute to the pathogenesis of HD.
Polycomb (PcG) genes 21,22 encode a new class of gene regulatory proteins that play a key role in regulation of lymphocyte development. 23-29 Targets of PcG proteins include homeobox genes 30,31 and genes contributing to regulation of the cell cycle, such as p16/Ink4a and p19/ARF. 32 PcG proteins function as large multimeric protein complexes. 33-37 Two distinct complexes were identified in humans. 31 One consists of the BMI-1, RING1, HPH1, HPH2 and HPC2 PcG proteins, and another contains the ENX/EZH2 and EED PcG proteins. 34-39 We have recently demonstrated that expression of these complexes, reflected by detection of BMI-1, RING1, EZH2, and EED, is mutually exclusive in GC B cells of the tonsil and dependent on the B cell differentiation stage. 29
In addition to a role in normal lymphocyte development, there is a clear connection between altered PcG gene expression and oncogenesis. Overexpression of various PcG genes, such as HPC2, RING1, and BMI-1, resulted in cellular transformation of cell lines or induction of lymphomas in mutant mice. 36,40-42 The role of PcG genes in human cancers, however, is relatively unexplored. In the current study we analyzed PcG expression in HRS cells and their normal counterparts, the follicular B cells in lymph nodes. We investigated the BMI-1 and EZH2 PcG proteins as representatives of the two human PcG complexes, and examined whether expression of BMI-1 and EZH2 is altered in HRS cells. We discovered that the majority of HRS cells coexpress BMI-1 and EZH2 in the nucleus, whereas expression of these proteins is clearly separated in normal follicular B cells. This suggests that HD is associated with coexpression of BMI-1 and EZH2 in HRS cells.
Materials and Methods
Human Tissue
Normal lymph nodes or lymph nodes from patients with HD, obtained after surgery, were immediately frozen or fixed in 10% buffered formalin and embedded in paraffin. HD cases were classified as nodular sclerosing (NS, n = 13), mixed cellularity (MC, n = 1), and, when the subtype could not be determined, not otherwise specified (NOS, n = 2). Lymph node tissue was obtained from patients at the time of diagnosis (performed on formalin-fixed, paraffin-embedded material during routine diagnostic workup procedures). One relapsed case was an NS subtype.
Immunohistochemical Detection of Human PcG Gene Expression
Expression of the BMI-1 and EZH2 PcG proteins was measured using the 6C9 mouse monoclonal antibody (anti BMI-1) and the polyclonal K358 rabbit antiserum (anti-EZH2). 37 Following deparaffinization, endogenous peroxidase was inhibited by incubation of the tissue sections for 30 minutes at room temperature in 0.3% H2O2 diluted in methanol. Antigens were retrieved by boiling for 10 minutes in citrate buffer (pH 6), followed by successive rinses in phosphate-buffered saline (PBS) containing 0.5% Triton (1 × 5 minutes), and PBS only (3 × 5 minutes). Slides were then incubated for 10 minutes in 0.1 mol/L glycine (diluted in PBS), and rinsed in PBS only (3 × 5 minutes). Before application of the primary antiserum or antibody, sections were incubated for 10 minutes in normal swine serum diluted 1:10 in PBS + 1% bovine serum albumin (BSA) or normal rabbit serum diluted 1:50 in PBS + 1% BSA. Secondary antisera were biotinylated goat-anti-mouse or biotinylated swine-anti-rabbit. Immunostaining was performed with 3-amino-9-ethylcarbazole (AEC) using the streptavidin-biotin complex/horseradish peroxidase (sABC-HRP) method and tyramine intensification. Sections were counterstained with hematoxylin. Photographs were taken with a Zeiss Axiophoto microscope (Thornwood, NY) and digitized using an Agfa duoscan scanner (Mortsel, Belgium).
Immunofluorescence Detection of BMI-1 and EZH2 Expression in Combination with CD30 and Mib-1/Ki-67
Tissue sections were fixed in 2% formaldehyde and endogenous peroxidase was inhibited as above. Following pre-incubation with 5% BSA, a combination of three primary antibodies was applied overnight at 4°C: anti BMI-1 (6C9; mouse IgG2b monoclonal antibody 37 ), anti EZH2 (K358; rabbit polyclonal antiserum 37 ), anti Ki67 (Mib-1; mouse IgG1 monoclonal antibody; Beckman Coulter, Fullerton, CA) or anti-CD30 (BerH2; mouse IgG1 monoclonal antibody; Dako, Glostrup, Denmark). Mib-1/Ki-67 was selected because expression of this nuclear proliferation antigen 43 was shown to be limited to BMI-1−/EZH2+ cells in GCs of the tonsil. 29 We included CD30 because it is specifically expressed by HRS cells 44,45 activated T cells, monocytes, and granulocytes (easily distinguished from HRS cells on the basis of morphology).
For double immunofluorescence, BMI-1 or Ki-67 were detected by biotinylated goat anti-mouse antiserum followed by streptavidin-cy3 (Jackson Immunoresearch, West Grove, PA). EZH2 was detected by swine-anti-rabbit Ig-FITC (Dako). For triple immunofluorescence, slides were incubated with three antibodies after blockade of nonspecific binding as described above. After rinsing, slides were incubated with either goat anti-mouse IgG2b or IgG1, linked to horseradish peroxidase (depending on the subclass of the primary antibody) in the presence of 5% normal human serum or normal goat serum. This was followed by addition of conjugated hydroxycouramine (1:1000; Molecular Probes, Eugene, OR) with tyramine, 46 producing blue fluorescence. For the green fluorescent signal, EZH2 was detected with fluorescein isothiocyanate-conjugated swine anti-rabbit (1:50). For the red fluorescence signal, BMI-1 or Ki-67 were detected using subclass-specific TRITC-conjugated goat anti-mouse IgG. All reagents were incubated for at least 30 minutes under standard conditions. After rinsing, slides were covered with Prolong (Molecular Probes). Analysis and photography was performed with a DMR microscope (Leica, St. Gallen, Switzerland); images were digitized using an Agfa duoscan scanner.
Results
We analyzed expression of the BMI-1 and EZH2 PcG proteins by immunohistochemistry in HRS cells of 19 HD cases (11 NS, 1 MC, 2 NOS, and 1 NS sample at relapse). Because HRS cells are viewed as the neoplastic variants of follicular B cells, 9,10 PcG gene expression patterns established in HRS cells were compared to those of follicular B cells in hyperplastic lymph nodes. We found that the majority of HRS cells exhibited nuclear staining for BMI-1 (Figure 1A) ▶ and EZH2 (Figure 1B) ▶ . This expression pattern was observed in all 15 HD samples (Table 1) ▶ and suggested that BMI-1 and EZH2 were expressed in the same nucleus of HRS cells. By contrast, the surrounding infiltrate expressed variable staining for BMI-1 and rarely expressed EZH2 (Figure 1, A and B) ▶ .
Figure 1.
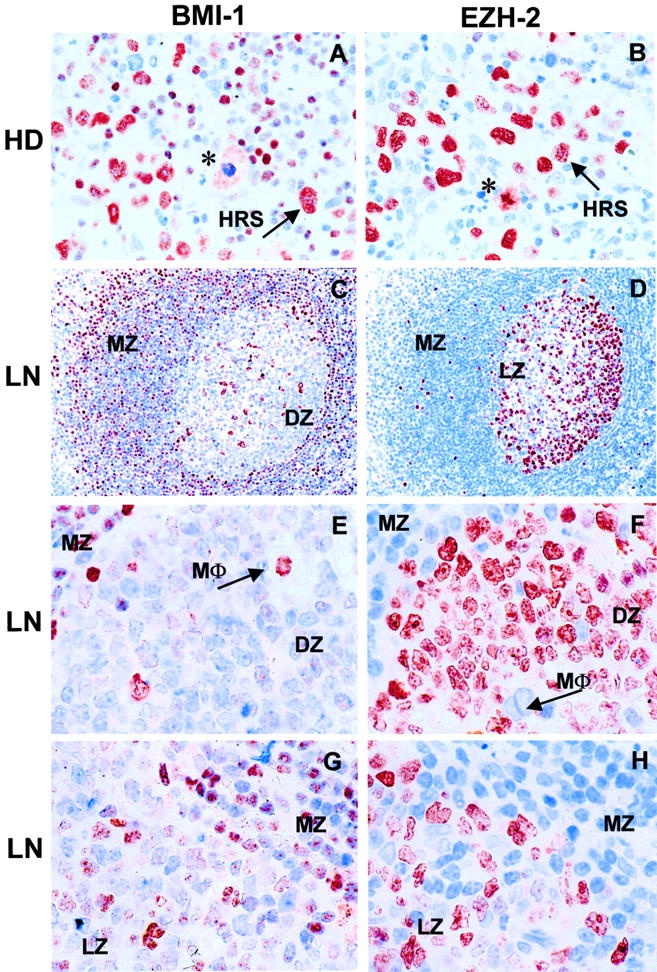
Immunohistochemical analysis of BMI-1 and EZH2 expression in HRS cells and germinal center follicular lymphocytes in the lymph node. A and B: Staining of Reed-Sternberg (HRS) cells for BMI-1 (A) and EZH2 (B). HRS cells express both BMI-1 and EZH2, whereas infiltrating lymphocytes stain for BMI-1 but not for EZH2. Note that dividing cells express BMI-1 in the cytoplasm, whereas EZH2 remains associated with condensed chromosomes (indicated by * in A and B). C, E, and G: Expression of BMI-1 in germinal centers of the lymph node. D, F, and H: Expression of EZH2 in germinal centers of the lymph node. C and D: Overview of lymph node germinal center. E and F: Detail of germinal center showing dark zone (DZ) and mantle zone (MZ). G and H: Detail of germinal center showing light zone (LZ) and MZ. Cb, centroblast; cc, centrocyte; LN, lymph node; MΦ, macrophage. Note that the mutually exclusive expression of BMI-1 and EZH2 is particularly notable in the MZ, DZ, and MΦ staining profiles (C−H), whereas HRS cells stain for both PcG proteins (A and B). Original magnifications, ×400 (A and B), ×200 (C and D), and ×630 (E−H).
Table 1.
BMI-1 and EZH2 Expression in Reed-Sternberg Cells of Hodgkin’s Disease
| Patient | HD subtype | Age | Sex | CD30 | BMI-1 | EZH2 |
|---|---|---|---|---|---|---|
| 1 | NS | 25 | m | + | + | + |
| 2 | MC | 71 | f | + | + | + |
| 3 | NS | 48 | m | + | + | + |
| 4 | NS | 33 | m | Nd | + | + |
| 5 | NS | 18 | m | + | + | + |
| 6 | NS | 19 | f | + | + | + |
| 7 | NS | 73 | f | + | + | + |
| 8 | NS | 57 | m | + | + | + |
| 9 | NS | 15 | f | Nd | + | + |
| 10 | NS | 37 | m | + | + | + |
| 11 | NS | 26 | f | Nd | + | + |
| 12 | NS | 18 | f | + | + | + |
| 13 | NS | 35 | m | + | + | + |
| 14 | NOS† | 27 | m | Nd | + | + |
| 15 | NOS | 13 | m | + | + | + |
| 16 | NS | 15 | m | + | + | + |
BMI-1 and EZH2 expression were determined in HRS cells by immunohistochemistry and immunofluorescence. HRS cells were identified on the basis of morphology and expression of CD30.
f, female; HD, Hodgkin’s disease; m, male; MC, mixed cellularity; Nd, not done; NOS, not otherwise specified; NS, nodular sclerosing. Material of patient 16 was obtained at relapse.
†Interfollicular/partial involvement.
Expression of BMI-1 and EZH2 in HRS cells contrasted with the staining patterns in normal lymph nodes, where detection of these proteins appeared mutually exclusive. Expression of BMI-1 was primarily found in the light zone (LZ) and at variable levels in the mantle zone (MZ), whereas dark zone (DZ) cells were generally negative (Figure 1, C, E, and G) ▶ . By contrast, EZH2 expression was mainly found in the DZ, whereas fewer cells expressed EZH2 in the LZ and rarely in the MZ (Figure 1, D, F, and H) ▶ . Follicular EZH2−/BMI-1+ cells had a centrocyte appearance (Figure 1, E and G) ▶ , whereas follicular EZH2+/BMI-1− expressing cells resembled centroblasts (Figure 1, F and H) ▶ . We previously demonstrated that a minority of the BMI-1+ cells are T cells. 29 Macrophages were BMI-1+ and did not express EZH2 (Figure 1, E and F) ▶ . BMI-1 and EZH2 expression patterns were similar in germinal centers of lymph nodes from variable sites of the body (mediastinal, inguineal, axillar) or in extranodal lymphoid tissue (data not shown).
BMI-1 and EZH2 expression were further explored by double and triple immunofluorescence, which allowed us to determine BMI-1 and EZH2 expression in relation to other markers, such as CD30 and Mib-1/Ki-67 (see Materials and Methods). We first confirmed coexpression of BMI-1 and EZH2 in HRS cells by performing double staining for BMI-1 and EZH2. Indeed, HRS-like cells with giant nuclei expressed both BMI-1 (Figure 2A) ▶ and EZH2 (Figure 2B) ▶ ; combination of these signals confirmed double expression of these PcG proteins in the same nucleus (Figure 2C) ▶ . We then determined that BMI-1+/EZH2+ cells expressed CD30 (Figure 2, D ▶ -F), identifying these cells as HRS cells. Note that the majority of infiltrating cells express BMI-1+, (Figure 2, A, C, D, and F) ▶ but are generally EZH2− (Figure 2, B, C, E, and F) ▶ . This included activated CD30+ lymphocytes (Figure 2, B and E) ▶ . In addition, occasionally observed BMI-1+/EZH2− cells with large nuclei probably represent macrophages, because such cells are CD30− (Figure 2F ▶ , see also Figure 1, B and E ▶ ). The mutually exclusive expression pattern of BMI-1 and EZH2 in infiltrating lymphocytes resembled the expression profile of follicular B cells. Follicular EZH2 expression (Figure 2G) ▶ was separated from BMI-1 expression (Figure 2H) ▶ , with few double positive (yellow) cells detectable in the region where DZ and LZ meet (Figure 2I) ▶ .
Figure 2.
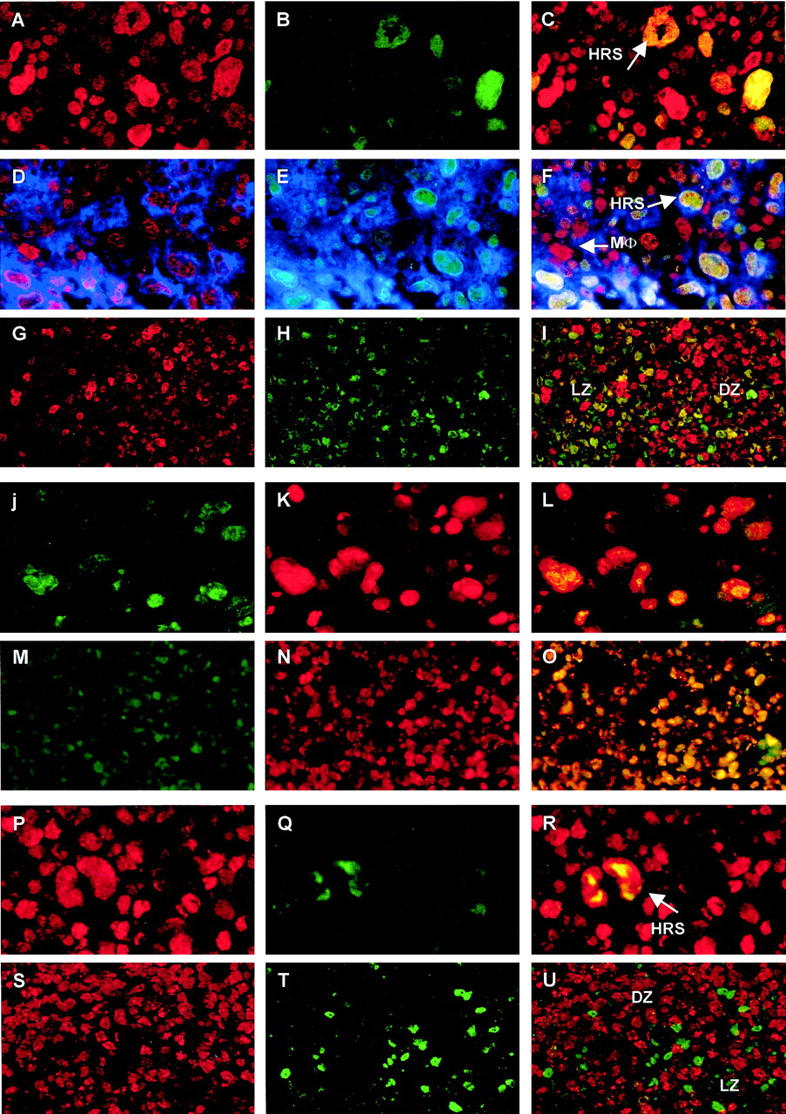
A−I: Expression of BMI-1 and EZH2 in HRS cells (A−F) and LN (G−I). BMI-1 (A and D; red fluorescence) and EZH2 (B and E; green fluorescence) are detected in HRS cells, whereas infiltrating lymphocytes are BMI-1+ (A and B) and generally do not express EZH2 (B and E). Coexpression of BMI-1 and EZH2 produces a yellow nuclear signal (C and F). These nuclei belong to HRS cells since these express CD30 (blue signal in D−F). Occassional EZH2-expressing cells with a compact nucleus also express CD30 (E), but are BMI-1−; these are probably activated lymphocytes. Note that EZH2+ lymphocytes in the infiltrate may be remaining centroblasts from lymph node follicles. CD30−/BMI-1+ cells with a large nucleus are probably macrophages (MΦ in F). In follicular lymphocytes (G−I), BMI-1 is mainly detected in the LZ (G), whereas EZH2 is primarily detected in the DZ (H). Coexpression of BMI-1 and EZH2 is sometimes observed at the interface of LZ and DZ, but occurs at a very low frequency (I). Expression of EZH2 and Mib-1/Ki-67 in HRS cells (J−L) and LN (M−O): Expression of EZH2 occurs in both HRS cells (J; green fluorescence) and LN centroblasts situated in the DZ (M), and coincides with detection of Mib-1/Ki-67 (K and N). Combination of the red and green fluorescent signal produces yellow nuclei (L and O), supportive of Mib-1/Ki-67 and EZH2 coexpression in HRS cells and centroblasts. Expression of BMI-1 and Mib-1/Ki-67 in HRS cells and LN: BMI-1 expression occurs in HRS cells and the surrounding infiltrate (P). HRS cells also express Mib-1/Ki-67 (Q, green fluorescence), producing a yellow signal in the HRS cell when red and green fluorescence are combined (R). By contrast, BMI-1 (S, red fluorescence) and Mib-1/Ki-67 expression (T, green fluorescence) are separated in follicular lymphocytes (U) and infiltrating lymphocytes surrounding an HRS cell (R). For abbreviations, see Figure 1 ▶ legend. Original magnifications, ×400.
Previous experiments indicated that expression of Mib-1/Ki-67 in lymphoid follicles of the tonsil is limited to EZH2+ centroblasts, whereas BMI-1+ follicular lymphocytes did not express Mib-1/Ki-67. 29 We next questioned to what extent expression of BMI-1 and EZH2 in HRS cells coincided with Mib-1/Ki-67 expression, and whether these patterns were reflected by follicles in lymph nodes. We found that Mib-1/Ki-67 was expressed in HRS cells irrespective of BMI-1 or EZH2 expression. Mib-1/Ki-67 was detectable in both EZH2+ (Figure 2, J ▶ -L) and BMI-1+ (Figure 2, P ▶ -R) HRS cells. By contrast, Mib-1/Ki-67 expression was clearly separated from BMI-1 expression in follicular lymphocytes of the lymph node: whereas EZH2+ follicular lymphocytes also expressed Mib-1/Ki-67 (Figure 2, M ▶ -O), Mib-1/Ki-67 was not detected in BMI-1+ follicular cells (Figure 2, S ▶ -U).
Discussion
PcG proteins have a regulatory role in various processes, including embryonic development, hematopoiesis, and cell cycle control. 21-32 Several recent studies demonstrated that these proteins are also involved in oncogenesis. The mouse Bmi-1 PcG gene was characterized as an oncogene that down-regulates p16/Ink4a and p19/ARF and collaborates with c-myc to produce lymphomas. 41,42 Similarly, overexpression of the RING1 PcG gene resulted in transformation and induction of tumors, and coincided with up-regulation of c-jun and c-fos. 36 Although one study noted that a subset of human mantle cell lymphomas with blastoid involvement exhibited amplification of BMI-1, 47 to date no other study has addressed the possible involvement of PcG genes in human cancers. In the current study we demonstrate that the human BMI-1 and EZH2 PcG genes are coexpressed in the nucleus of HRS cells. This pattern stands in sharp contrast to BMI-1 and EZH2 expression in follicular B cells, which is mutually exclusive in the majority of these cells. Because double expression of BMI-1 and EZH2 is rarely detected in follicular lymphocytes, and the majority of HRS cells expresses both proteins, we conclude that coexpression of BMI-1 and EZH2 is associated with the transformed state of the HRS cell.
The various stages of GC B cell development, 48 from mantle cell to centroblast to centrocyte, are associated with distinct changes in PcG gene expression profile 29 (and this study). BMI-1 is expressed in Mib-1/Ki-67− resting mantle cells and centrocytes, whereas EZH2 is detected primarily in rapidly dividing Mib-1/Ki-67+ centroblasts. The transition of resting B cells to dividing centroblasts appears associated with loss of BMI-1 expression and acquisition of EZH2 expression, whereas differentiation of centroblasts to centrocytes coincides with a reverse pattern. Our interpretation of these findings is that expression of BMI-1 and EZH2 is subject to strict regulation, and mutually exclusive in the majority of normal follicular B cells. This distinct PcG expression pattern is most likely related to the fact that BMI-1 and EZH2 proteins typify different PcG complexes. The BMI-1 complex also contains the RING1, HPH1, HPH2, and HPC2 PcG proteins, whereas EZH2 is associated with the EED PcG protein in another complex. 34-39 The various PcG complexes probably have different target genes, 31 and this could explain why the differentiation status of the follicular B cell correlates with differential expression of BMI-1 and EZH2. Experiments in mutant mice indicated that loss of BMI-1 resulted in inhibition of B cell progenitor cell division, whereas loss of EED was associated with increased proliferation. 27 Because BMI-1 and EED belong to different complexes, this suggests that an intricate balance between these PcG complexes is essential for lymphoid cell proliferation.
This balance appears disturbed in HD because HRS cells exhibit irregular expression patterns of BMI-1, EZH2, and Mib-1/Ki-67 in comparison to follicular lymphocytes. Although expression of BMI-1 is separated from EZH2 in the vast majority of follicular lymphocytes in tonsil and lymph nodes, these proteins are coexpressed in the nucleus of HRS cells. Secondly, Mib-1/Ki-67 is only detected in EZH2+ normal follicular lymphocytes, whereas BMI-1+ cells do not express Mib-1/Ki-67. By contrast, Mib-1/Ki-67 is expressed in BMI-1+ HRS cells. The mechanism underlying these patterns is unclear, and could result from a failure to down-regulate EZH2 and Mib-1/Ki-67, an increased or induced expression of BMI-1, or a combination of these two possibilities. Whatever the mechanism, coexpression of BMI-1 and EZH2 in the presence of Mib-1/Ki-67 is a strong indication that deregulation of the cell cycle in HRS cells is reflected by irregular expression of PcG genes. Whether disturbance of PcG expression resulted in cellular transformation (or whether it is the consequence of this process) remains to be determined.
In conclusion, we demonstrated that the BMI-1 and EZH2 PcG genes are coexpressed in the nuclei of HRS cells, whereas their expression is highly regulated and mutually exclusive during GC B cell differentiation. This suggests that HD is associated with deregulation of PcG protein expression. Together with the results obtained by others in different tumor models, our study warrants further investigation of human PcG genes as candidate factors that contribute to lymphomagenesis.
Footnotes
Address reprint requests to Frank M. Raaphorst, VU University Hospital, Dept. Pathology, Room PA-001, De Boelelaan 1117, 1081 HV Amsterdam, The Netherlands. E-mail: fm.raaphorst@azvu.nl.
References
- 1.Cossman J, Messineo C, Bagg A: Reed-Sternberg cell: survival in a hostile sea. Lab Invest 1998, 78:229-235 [PubMed] [Google Scholar]
- 2.Cossman J, Annunziata CM, Barash S, Staudt L, Dillon P, He WW, Ricciardi-Castagnoli P, Rosen CA, Carter KC: Reed-Sternberg cell genome expression supports a B cell lineage. Blood 1999, 94:411-416 [PubMed] [Google Scholar]
- 3.Foss HD, Reusch R, Demel G, Lenz G, Anagnostopoulos I, Hummel M, Stein H: Frequent expression of the B cell-specific activator protein in Reed-Sternberg cells of classical Hodgkin’s disease provides further evidence for its B cell origin. Blood 1999, 94:3108-3113 [PubMed] [Google Scholar]
- 4.Carbone A, Gloghini A, Gaidano G, Franceschi S, Capello D, Drexler HG, Falini B, Dalla-Favera R: Expression status of BCL-6 and syndecan-1 identifies distict histogenic subtypes of Hodgkin’s disease. Blood 1998, 92:2220-2228 [PubMed] [Google Scholar]
- 5.Tamaru J, Hummel M, Zemlin M, Kalvelage B, Stein H: Hodgkin’s disease with a B cell phenotype often shows a VDJ rearrangement and somatic mutation in the VH genes. Blood 1994, 84:708-715 [PubMed] [Google Scholar]
- 6.Kamel OW, Chang PP, Hsu FJ, Dolezal MV, Warnke RA, van de Rijn M: Clonal VDJ recombination of the immunoglobulin heavy chain gene by PCR in classical Hodgkin’s disease. Am J Clin Pathol 1995, 104:419-423 [DOI] [PubMed] [Google Scholar]
- 7.Kanzler H, Küppers R, Hansmann ML, Rajewski K: Hodgkin and Reed-Sternberg cells in Hodgkin’s disease represent the outgrowth of a dominant tumor clone derived from (crippled) germinal center B cells. J Exp Med 1996, 184:1495-1505 [DOI] [PMC free article] [PubMed] [Google Scholar]
- 8.Jox A, Zander T, Küppers R, Irsch J, Kanzler H, Kornacker M, Bohlen H, Diehl V, Wolf J: Somatic mutations within the untranslated regions of rearrenged Ig genes in a case of classical Hodgkin’s disease as a potential cause for the absence of Ig in the lymphoma cells. Blood 1999, 93:3964-3972 [PubMed] [Google Scholar]
- 9.Kuppers R: Identifying the precursors of Hodgkin and Reed-Sternberg cells in Hodgkin’s disease: role of the germinal center in B cell lymphomagenesis. J Acquir Immune Defic Syndr 1999, 21:S74-S79 [PubMed] [Google Scholar]
- 10.Stein H, Hummel M: Cellular origin and clonality of classic Hodgkin’s lymphoma: immunophenotypic and molecular studies. Semin Hematol 1999, 36:233-241 [PubMed] [Google Scholar]
- 11.Mitani S, Sugawara I, Shiku H, Mori S: Expression of c-myc oncogene product and ras family oncogene products in various human malignant lymphomas defined by immunohistochemical techniques. Cancer 1988, 62:2085-2093 [DOI] [PubMed] [Google Scholar]
- 12.Jucker M, Schaadt M, Diehl V, Poppema S, Jones D, Tesch H: Heterogeneous expression of proto-oncogenes in Hodgkin’s disease-derived cell lines. Hematol Oncol 1990, 8:191-204 [DOI] [PubMed] [Google Scholar]
- 13.Benharroch D, Yermiahu T, Geffen DB, Prinsloo I, Gopas J, Segal S, Aboud M: Expression of c-myc and c-ras oncogenes in the neoplastic and non-neoplastic cells of Hodgkin’s disease. Eur J Haematol 1995, 55:178-183 [DOI] [PubMed] [Google Scholar]
- 14.Gruss HG, Dower SK: Tumor necrosis factor ligand superfamily: involvement in the pathology of malignant lymphomas. Blood 1995, 85:3378-3404 [PubMed] [Google Scholar]
- 15.Messineo C, Jamerson MH, Hunter E, Braziel R, Bagg A, Irving SG, Cossman J: Gene expression by single Reed-Sternberg cells: pathways of apoptosis and activation. Blood 1998, 91:2443-2451 [PubMed] [Google Scholar]
- 16.Brink AA, Oudejans JJ, van den Brule AJ, Kluin PM, Horstman A, Ossenkoppele GJ, van Heerde P, Jiwa M, Meijer CJLM: Low p53 and high bcl-2 expression in Reed-Sternberg cells predicts poor clinical outcome for Hodgkin’s disease: involvement of apoptosis resistance? Mod Pathol 1998, 11:376-383 [PubMed] [Google Scholar]
- 17.Chu WS, Aguilera NS, Wei MQ, Abbondanzo SL: Antiapoptotic marker Bcl-X(L), expression on Reed-Sternberg cells of Hodgkin’s disease using a novel monoclonal marker, YTH-2H12. Hum Pathol 1999, 30:1065-1070 [DOI] [PubMed] [Google Scholar]
- 18.Oudejans JJ, Jiwa NM, Meijer CJLM: Epstein-Barr virus in Hodgkin’s disease: more than just an innocent bystander. J Pathol 1997, 181:353-356 [DOI] [PubMed] [Google Scholar]
- 19.Doglioni C, Pelosio P, Mombello A, Scarpa A, Chilosi M: Immunohistochemical evidence of abnormal expression of the antioncogene-encoded p53 phosphoprotein in Hodgkin’s disease and CD30+ anaplastic lymphomas. Hematol Pathol 1991, 5:67-73 [PubMed] [Google Scholar]
- 20.Kim SH, Choi EY, Shin YK, Kim TJ, Chung DH, Chang SI, Kim NK, Park SH: Generation of cells with Hodgkin’s and Reed-Sternberg phenotype through downregulation of CD99 (Mic2). Blood 1998, 11:4287-4295 [PubMed] [Google Scholar]
- 21.Simon J: Locking in stable states of gene expression: transcriptional control during Drosophila development. Curr Opin Cell Biol 1995, 7:376-385 [DOI] [PubMed] [Google Scholar]
- 22.Pirrotta V: Polycombing the genome: PcG, trxG and chromatin silencing. Cell 1998, 93:333-336 [DOI] [PubMed] [Google Scholar]
- 23.van der Lugt NMT, Domen J, Linders K, van Roon M, Robanus-Maandag E, te Riele H, van der Valk M, Deschamps J, Sofroniew M, van Lohuizen M, Berns A: Posterior transformation, neurological abnormalities, and severe hematopoietic defects in mice with targeted deletion of the BMI-1 proto-oncogene. Genes Dev 1994, 8:757-769 [DOI] [PubMed] [Google Scholar]
- 24.Alkema MJ, Jacobs H, van Lohuizen M, Berns A: Pertubation of B and T cell development and predisposition to lymphomagenesis in EμBMI1 transgenic mice require the BMI-1 RING finger. Oncogene 1997, 15:899-910 [DOI] [PubMed] [Google Scholar]
- 25.Akasaka T, Tsuji K, Kawahira H, Kanno M, Harigaya K, Hu L, Ebihara Y, Nakahata T, Tetsu O, Taniguchi M, Koseki H: The role of mel-18, a mammalian polycomb group gene, during Il-7-dependent proliferation of lymphocyte precursors. Immunity 1997, 7:135-146 [DOI] [PubMed] [Google Scholar]
- 26.Lessard J, Baban S, Sauvageau G: Stage-specific expression of polycomb group genes in human bone marrow cells. Blood 1998, 91:1216-1224 [PubMed] [Google Scholar]
- 27.Lessard J, Schumacher A, Thorsteindottir U, van Lohuizen M, Magnuson T, Sauvageau G: Functional antagonism of the Polycomb-groupgenes eed and Bmi 1 in hemopoietic cell proliferation. Genes Dev 1999, 13:2691-2703 [DOI] [PMC free article] [PubMed] [Google Scholar]
- 28.Tetsu O, Ishihara H, Kanno R, Kamiyasu M, Inoue H, Tokuhisha T, Taniguchi M, Inoue H, Tokuhisa T, Taniguchi M, Kanno M: Mel-18 negatively regulates cell cycle progression upon B cell antigen receptor stimulation through a cascade leading to c-myc/cdc25. Immunity 1998, 9:439-448 [DOI] [PubMed] [Google Scholar]
- 29.Raaphorst FM, van Kemenade FJ, Fieret JH, Hamer KM, Satijn DPE, Otte AP, Meijer CJLM: Polycomb gene expression patterns reflect distinct B cell differentiation stages in human germinal centers. J Immunol 2000, 164:1-4 [DOI] [PubMed] [Google Scholar]
- 30.Gould A: Functions of mammalian polycomb group and trithorax group related genes. Curr Opin Gen Develop 1997, 7:488-494 [DOI] [PubMed] [Google Scholar]
- 31.Satijn DPE, Otte AP: Polycomb group protein complexes: do different complexes regulate distinct target genes? Biochim Biophys Acta 1999, 1447:1-16 [DOI] [PubMed] [Google Scholar]
- 32.Jacobs JJL, Kieboom K, Marino S, DePinho RA, van Lohuizen M: The oncogene and polycomb-group gene Bmi-1 regulates cell proliferation and senescence through the ink4a locus. Nature 1999, 397:164-168 [DOI] [PubMed] [Google Scholar]
- 33.Alkema MJ, Bronk M, Verhoeven E, Otte AP, van’t Veer LJ, Berns A, van Lohuizen M: Identification of Bmi-1-interacting proteins as constituents of a multimeric mammalian Polycomb complex. Genes Dev 1997, 11:226–240 [DOI] [PubMed]
- 34.Gunster MJ, Satijn DPE, Hamer KM, den Blaauwen JL, de Bruijn D, Alkema MJ, van Lohuizen M, van Driel R, Otte AP: Identification and characterization of interactions between the vertebrate Polycomb-group protein BMI-1 and human homologues of polyhomeotic. Mol Cell Biol 1997, 17:2326-2335 [DOI] [PMC free article] [PubMed] [Google Scholar]
- 35.Satijn DPE, Gunster MJ, van der Vlag J, Hamer KM, Schul W, Alkema MJ, Saurin AJ, Freemont PS, van Driel R, Otte AP: RING1 is associated with the polycomb group protein complex and acts as a transcriptional repressor. Mol Cell Biol 1997, 17:4105-4113 [DOI] [PMC free article] [PubMed] [Google Scholar]
- 36.Satijn DPE, Otte AP: RING1 interacts with multiple Polycomb-group proteins and displays tumorigenic activity. Mol Cell Biol 1999, 19:57-68 [DOI] [PMC free article] [PubMed] [Google Scholar]
- 37.Sewalt RGAB, van der Vlag J, Gunster MJ, Hamer KM, den Blaauwen JL, Satijn DPE, Hendrix T, van Driel R, Otte AP: Characterization of interactions between the mammalian polycomb-group proteins EZH21/EZH2 end EED suggests the existence of different mammalian polycomb-group protein complexes. Mol Cell Biol 1998, 18:3586-3595 [DOI] [PMC free article] [PubMed] [Google Scholar]
- 38.Schoorlemmer J, Marcos-Gutierrez C, Were F, Martinez R, Garcia E, Satijn DPE, Otte AP, Vidal M: Ring1A is a transcriptional repressor that interacts with the Polycomb-M33 protein and is expressed at rhombomere boundaries in the mouse hindbrain. EMBO J 1997, 16:5930-5942 [DOI] [PMC free article] [PubMed] [Google Scholar]
- 39.van Lohuizen M, Tijms M, Voncken JW, Schumacher A, Magnuson T, Wientjens E: Interaction of the mouse polycomb-group (PcG) proteins ENX1 and ENX2 with Eed: indication for separate PcG complexes. Mol Cell Biol 1998, 18:3572-3579 [DOI] [PMC free article] [PubMed] [Google Scholar]
- 40.Satijn DPE, Olson DJ, van der Vlag J, Hamer KM, Lambrechts C, Masselink H, Gunster MJ, Sewalt RGAB, van Driel R, Otte AP: Interference with the expression of a novel human polycomb protein, hPc2, results in cellular transformation and apoptosis. Mol Cell Biol 1997, 17:6076-6086 [DOI] [PMC free article] [PubMed] [Google Scholar]
- 41.van Lohuizen M, Verbeek S, Scheijen B, Wientjens E, van der Gulden H, Berns A: Identification of cooperating oncogenes in Eμ-myc transgenic mice by provirus tagging. Cell 1991, 65:737-752 [DOI] [PubMed] [Google Scholar]
- 42.Jacobs JJL, Scheijen B, Voncken JW, Kieboom K, Berns A, van Lohuizen M: Bmi-1 collaborates with c-Myc in tumorigenesis by inhibiting c-Myc-induced apoptosis via INK4a/ARF. Genes Dev 1999, 13:2678-2690 [DOI] [PMC free article] [PubMed] [Google Scholar]
- 43.Grogan TM, Lippman SM, Spier CM, Slymen DJ, Rybski JA, Rangel CS, Richter LC, Miller TP: Independent prognostic significance of a nuclear proliferation antigen in diffuse large cell lymphomas as determined by the monoclonal antibody Ki-67. Blood 1989, 71:1157-1160 [PubMed] [Google Scholar]
- 44.Schwab U, Stein H, Gerdes J, Lemke H, Kirchner H, Schaadt M, Diehl V: Production of a monoclonal antibody specific for Hodgkin and Reed-Sternberg cells cells of Hodgkin’s disease and a subset of normal lymphoid cells. Nature 1982, 299:65-67 [DOI] [PubMed] [Google Scholar]
- 45.Smith CA, Gruss HJ, Davis T, Anderson D, Farrah T, Baker E, Sutherland GR, Brannan CI, Copeland NG, Jenkins NA: CD30 antigen, a marker for Hodgkin’s lymphoma, is receptor whose ligand defines an emerging family of cytokines with homology to TNF. Cell 1993, 73:1349-1360 [DOI] [PubMed] [Google Scholar]
- 46.Hopman AH, Ramaekers FC, Speel EJ: Rapid synthesis of biotin-, digoxigenin-, trinitrophenyl-, and fluorochrome-labeled tyramides and their application for In situ hybridization using CARD amplification. J Histochem Cytochem 1998, 46:771-777 [DOI] [PubMed] [Google Scholar]
- 47.Beà S, Ribas M, Hernández JM, Bosch F, Pinyol M, Hernández L, García JL, Flores T, González M, López-Guillermo A, Piris MA, Cardesa A, Montserrat E, Miró R, Campo E: Increased number of chromosomal imbalances and high-level DNA amplifications in mantle cell lymphoma are associated with blastoid variants. Blood 1999, 93:4365-4374 [PubMed] [Google Scholar]
- 48.Tarlinton D: Germinal centers: form and function. Curr Opin Immunol 1998, 10:245-251 [DOI] [PubMed] [Google Scholar]