

Abstract
To examine the process of liver repopulation by transplanted hepatocytes, we developed transgenic mice carrying a mouse major urinary protein-urokinase-type plasminogen activator fusion transgene. Expression of this transgene induced diffuse hepatocellular damage beginning at 3 weeks of age, and homozygous mice supported up to 97% parenchymal repopulation by healthy donor hepatocytes transplanted into the spleen. Using this transplantation model, we determined that 1) a mean of 21% of splenically injected hepatocytes engraft in liver parenchyma; 2) a mean of 6.6% of splenically injected hepatocytes (or one-third of engrafted cells) can give rise to proliferating hepatocyte foci; 3) transplanted cells in proliferating foci display an initial cell-doubling time of 28 hours, and focus growth continues through a mean of 12 cell doublings; 4) hepatocytes isolated from young and aged adult mice display similar focus repopulation kinetics; 5) the extent of repopulated parenchyma remains stable throughout the life of the recipient mouse; and 6) tetraploid and octaploid hepatocytes can support clonal proliferation.
The liver is a large, unpaired organ that provides multiple metabolic functions critical for the maintenance of homeostasis. Although mitotically quiescent in the normal adult animal, liver cells can be induced to proliferate by a variety of stimuli, most importantly those causing damage to existing parenchyma. 1-4 In this way, liver mass can be restored to a functionally appropriate level after toxic or infectious damage despite its typically low rate of cell turnover. Liver cell proliferation after injury in humans and animals can take two forms. The first is micronodular hyperplasia. 3,4 Micronodular hyperplasia primarily involves hepatocytes and is observed in response to injuries that cause fibrosis, which distorts the lobule. This form of regeneration often produces abnormal hepatic architecture and poorly functioning parenchyma, and typically does not reverse signs of clinical disease. 3,4 The second is diffuse proliferation or regeneration, involving hepatocytes and nonparenchymal cells, generally observed in response to hepatic injury in which lobular architecture is preserved. In diffuse regeneration, most or all hepatic cells replicate until lost or damaged liver mass is restored. 1,2 This is followed by tissue reorganization that recreates architecturally normal liver lobules. Diffuse regeneration also follows surgical loss of liver mass. In fact, partial hepatectomy in rodents, a surgical procedure that typically involves removal of two-thirds of the liver, produces a wave of synchronized dividing cells and has become an established experimental technique to examine the molecular mechanisms underlying cell cycle regulation in vivo. 1,2,5,6
Several experimental animal model systems recently have been developed that permit detailed examination of the cellular basis of hepatic regeneration. 7 Each model requires induction of hepatocyte injury, which produces an environment conducive to proliferation of healthy transplanted hepatocytes. The first model involved targeting of a urokinase-type plasminogen activator (uPA) transgene to hepatocytes using the albumin (AL) enhancer/promoter. 8,9 AL-uPA transgenic mice displayed diffuse vacuolization within hepatocyte rough endoplasmic reticulum that increased in severity with age and was accompanied by sporadic hepatocyte death. Remarkably, transgene DNA was deleted from a small fraction of hepatocytes, which then clonally proliferated once released from the toxic effects of uPA expression. Progeny of these cells appeared as reddish foci in the otherwise pale transgene-expressing liver beginning at ∼2 weeks of age, and by 2 to 3 months of age the hepatic parenchyma was replaced by healthy, transgene-deficient hepatocytes. 9 Furthermore, this process of clonal hepatic repopulation could be reproduced after splenic transplantation of healthy donor cells isolated from a normal mouse liver into young transgenic recipients. Transplanted cells underwent up to 14 cell doublings in recipient liver to produce small foci of donor-derived hepatocytes that subsequently became integrated into host parenchyma. 10 These results demonstrated the effectiveness of a crude liver cell preparation at repopulating damaged parenchyma, a medically important finding.
This approach was extended through the use of fumarylacetoacetate hydrolase (FAH)-deficient mice. The FAH gene, which encodes an enzyme in the tyrosine catabolism pathway, was disrupted in embryonic stem cells, and these cells were used to generate mice. 11 FAH-null mice died as neonates because of liver dysfunction. However, they could be rescued with 2-(2-nitro-4-trifluoro-methylbenzyol)-1,3-cyclohexanedione, which prevents the accumulation of toxic metabolites in the tyrosine catabolism pathway. 11 Transplanted normal hepatocytes were able to repopulate the liver and restore FAH activity in FAH-null mice that had been removed from 2-(2-nitro-4-trifluoro-methylbenzyol)-1,3-cyclohexanedione. 12 This system was used to demonstrate that the replicative capacity of adult mouse liver cells extends to at least 77 cell doublings, using serial host-to-host transplantation of a marked donor cell population. 13 Thus, it seems that at least a subset of liver cells must not be subject to typical constraints on cellular longevity. 14
The most recent model involves administration to rats of the pyrrolizidine alkaloid retrorsine (12,18-dihydroxysenecionan-11,16-dione), followed by partial hepatectomy. This model, like those described above, may permit near-total replacement of liver parenchyma by donor cells, but in this case in rat. 15 Collectively, these three models provide experimental tools that can be used to address medically important issues relating to the replicative and differentiation potential of selected populations of liver cells.
Our objective for this study was to explore in detail both the process of focal hepatic repopulation that follows hepatocyte transplantation and the cells that can participate in this process. To accomplish this, we modified the uPA model to overcome two limitations associated with the AL-uPA transgene: first, the frequent neonatal hemorrhaging accompanying uPA-induced hypofibrinogenemia, 8 and second, the need to transplant cells into very young recipients so that these donor cells could compete effectively with endogenous transgene-deficient hepatocytes during repopulation. 10 We describe below the characteristics of a new uPA transgenic mouse model, and our use of that model to address 1) the engraftment frequency and kinetics of repopulation of diseased liver by donor hepatocytes, 2) the influence of donor cell age on liver repopulation, 3) the long-term fate of donor-derived parenchyma, and 4) the proliferative capacity of donor hepatocyte populations of different ploidy.
Materials and Methods
Animal Procedures
Mice were housed and maintained in accordance with The Guide for the Care and Use of Laboratory Animals in AAALAC-accredited facilities. All experimental procedures were approved by the Animal Care and Use Committee of the School of Veterinary Medicine, University of Wisconsin-Madison. Certain transgenic lines used in these studies have been assigned the following genetic designations: MUP-uPA line 350-2, TgN(MupPlau)1Eps; MT-nLacZ line 379-4, TgN(Mt1nLacZ)4Eps; MT-hPAP line 456-3, TgN(Mt2ALPP)3Eps; and R26-hPAP line 808-6, TgN(R26ALPP)5Eps.
Clinical Chemistry
Blood was obtained from anesthetized MUP-uPA transgenic mice by heart puncture, and plasma samples were analyzed for albumin, total protein, and alanine aminotransferase using a Vitros 250 Chemistry Analyzer (Ortho Clinical Diagnostics, Raritan, NJ).
Generation of MUP-uPA Transgenic Mice
The MUP-uPA transgene was generated by joining the mouse major urinary protein (MUP) promoter 16 to a previously constructed genomic coding sequence from the mouse uPA gene that carried the 3′ noncoding region and polyadenylation sequence from the human growth hormone gene 8 (Figure 1) ▶ . The parental MUP plasmid was a pUC18 derivative containing the MUP promoter sequence terminating in the first exon at +29 and flanked by a unique NdeI site upstream and by a KpnI site downstream within a polylinker. The 2.5-kb MUP promoter element was excised with NdeI and KpnI, then ligated into the NdeI/KpnI-cut plasmid vector puPA-human growth hormone/Nde. 8 The resulting plasmid, pMUP-uPA, was digested with NdeI and NotI, and the excised transgene DNA was microinjected into fertilized C57BL/6 or FVB strain mouse eggs using standard methods. 17 Transgenic offspring were identified by polymerase chain reaction, using a forward probe specific for uPA, 5′-GCGATTCTGGAGGACCGCTTATC-3′, and a reverse probe specific for human growth hormone, 5′-TTAGGACAAGGCTGGTGGGCACTG-3′. Twenty-five μl of reaction mixture containing genomic DNA from tail was subjected to the following conditions: 1) 92°C for 2 minutes; 2) 35 cycles of: 45 seconds at 92°C, 1 minute at 60°C, and 1 minute at 72°C; and 3) 72°C for 5 minutes. Transgene DNA displayed an amplified product band of 300 bp on an agarose gel. To measure transgene expression, serum from MUP-uPA transgenic mice was subjected to zymographic analysis as described previously. 8 This method detects increases in serum uPA associated with production and release of uPA by transgene-expressing hepatocytes.
Figure 1.

MUP-uPA transgene construct, containing the MUP enhancer/promoter, the entire mouse uPA genomic coding sequence, and the 3′ human growth hormone-untranslated region with polyadenylation (pA) signal.
Generation of Hepatocyte Donor Mice
The following transgene constructs used to mark donor hepatocytes were separately injected into fertilized C57BL/6 and FVB mouse eggs. The metallothionein (MT)-nLacZ transgene, encoding nuclear-localized β-galactosidase, has been described previously. 10 MT-nLacZ transgenic mice were identified by polymerase chain reaction analysis using the forward probe 5′-CAGAGCGGGTAAACTGGCTCGGATTAG-3′ and the reverse probe 5′-GACACCAGACCAACTGGTAATGGTAGC-3′. Twenty-five μl of reaction mixture containing genomic DNA from tail was subjected to the following conditions: 1) 94°C for 3 minutes, 2) 35 cycles of: 30 seconds at 94°C, 1 minute at 55°C, and 1 minute for 72°C; and 3) 72°C for 7 minutes. Transgene DNA displayed an amplified band of 400 bp on an agarose gel. The human placental alkaline phosphatase (hPAP)-coding region was used to construct two additional transgenes. The first also used the MT promoter fused to hPAP. MT-hPAP transgenic mice were identified by polymerase chain reaction, using the forward probe 5′-CTGATGAATGGGAGCAGTGGTGGAATG-3′ and the reverse probe 5′-GCAGACACTCTATGCCTGTGTGGAG-3′ (these recognize simian virus 40 DNA, which contributes the 3′ noncoding region with polyadenylation signal to the transgene). Reaction conditions were the same as used to identify MUP-uPA transgenic mice. Transgene DNA displayed an amplified band of 360 bp on an agarose gel. The second hPAP transgene used the promoter isolated from the ROSA 26 mouse insertion site (R26). 18,19 R26-hPAP transgenic mice were identified by enzyme histochemistry. Tail blood was blotted onto filter paper, allowed to air-dry, then samples were heated to 65°C for 30 minutes in alkaline-phosphatase buffer (pH 9.5) containing 0.1 mol/L Tris-HCl, 0.1 mol/L NaCl, 5 mmol/L MgCl2, and incubated overnight at 37°C in alkaline-phosphatase buffer plus 0.17 mg/ml 5-bromo-4-chloro-3-indolyl phosphate (Sigma Chemical Co., St. Louis, MO). Transgenic mouse blood displayed a blue reaction product. Because hPAP is stable in paraffin-embedded tissue, this marker was used in most transplantation studies. The nuclear localized β-galactosidase was more readily detectable in single cells, so this was used to mark donor cells when tissues were collected 3 days after transplantation.
Liver Cell Isolation and Transplantation
Hepatocytes were isolated from nLacZ- or hPAP-marked transgenic mice to facilitate identification of donor hepatocytes in recipient mice. Donor hepatocytes were isolated using a modified two-step ethylenediaminetetraacetic acid/collagenase protocol. 20,21 Mice were anesthetized deeply, and the liver was perfused via the portal vein with Hanks’ buffer containing 0.5 mmol/L ethylenediaminetetraacetic acid, then 1 mg/ml collagenase A ( #1088 793; Boehringer Mannheim, Indianapolis, IN) in Hanks’ buffer with 5 mmol/L CaCl2 and 0.27 mg/ml trypsin inhibitor (T-9253; Sigma). Each solution was infused for ∼7 minutes at 5 ml/min. All solutions were kept at 37°C and bubbled continuously with sterile filtered 100% O2. Livers then were placed into a Petri dish containing L15 medium (Life Technologies, Inc., Rockville, MD), and gently teased apart with forceps. The resulting slurry was passed through a 65-μm nylon mesh (Small Parts, Inc., Miami Lakes, FL), the filtrate was centrifuged at 4°C for 1 minute at 440 × g, and the pellet was resuspended in cold L15. The concentration of viable large cells (hepatocytes) was determined by trypan blue exclusion using a hemacytometer. Cells were maintained at 4°C until transplantation. Approximately 80% of the cells isolated using this method are hepatocytes. 22
Hepatocytes were transplanted via intrasplenic injection within 4 hours of isolation. 10 Recipient mice were anesthetized with Avertin (ICN Biochemicals, Plainview, NY), the spleen was exteriorized through a small left flank incision, a 26-gauge needle on a Hamilton syringe (product #81041) was introduced into the spleen, and 10 μl of the cell suspension was discharged slowly. The spleen was returned to the abdominal cavity and the incision site was closed with suture and wound clips. 10 Unless otherwise noted, the total cell number transplanted into each recipient was 1 to 5 × 10⁵. To assure histocompatibility between donor cells and recipient mice, all recipients unless otherwise noted were (C57BL/6×FVB) F1 hybrids, which accept donor cells of either parental genotype.
Detection and Quantitation of Donor Cell Hepatic Repopulation
To identify nLacZ-marked donor cells, recipient mice were administered 0.1 mg/kg cadmium intraperitoneally to induce expression of the MT-nLacZ transgene, then 16 to 20 hours later liver was collected and fixed in 4% paraformaldehyde at 4°C for 1 hour, rinsed for 90 minutes with a detergent cocktail containing 0.1 mol/L sodium phosphate buffer (pH 7.3), 2 mmol/L MgCl2, 0.01% sodium deoxycholate, and 0.0002% Nonidet P-40 (ICN Biomedicals Inc., Irvine, CA), then incubated overnight at 37°C in the dark in the detergent cocktail plus 0.16% ferricyanide, 0.21% ferrocyanide, 0.1% 5-bromo-4-chlor-3-indolyl-β-D-galactoside (X-gal; United States Biochemical, Cleveland, OH), and 2.5% dimethyl sulfoxide. 10 Transgene-expressing cells displayed a blue reaction product. For some studies, livers were frozen in OCT compound (Fisher Scientific, Pittsburgh, PA), and cryostat sections were analyzed on a slide to detect nLacZ-containing cells. To identify hPAP-marked donor cells, recipients of MT-hPAP-marked cells were given an intraperitoneal injection of 0.1 mg/kg cadmium, then 16 to 20 hours later tissue was collected and fixed at 4°C in 4% paraformaldehyde for 2 hours. R26-hPAP mice do not require pretreatment with cadmium. Samples were stained for the presence of hPAP using enzyme histochemistry as described previously for tail blood dots. All samples were stored in 70% ethanol. For some studies, fixed, paraffin-embedded, and sectioned livers were analyzed on a slide using the method described above to detect hPAP-containing cells.
To measure the percentage of hepatic surface area occupied by blue-staining donor cell foci, we used computer-assisted image analysis using a color video camera (Dage-MTI, Inc., Michigan City, IN) and Image-Pro software (Media Cybernetics, Silver Spring, MD). This analysis compared blue-stained liver surface area to total liver surface area, generating a value for percent repopulation by donor cells. Recipient livers analyzed in this way were selected from several experiments to establish a repopulation series, consisting of 14 livers with repopulation ranging from 2 to 80%. These livers were used as standards against which to determine percent surface staining of additional samples. Percent surface staining was estimated independently by two observers for most remaining livers by visual comparison with the liver standards. Estimates then were averaged. Nine samples evaluated in this manner were subsequently re-analyzed via computer-assisted analysis to determine the accuracy of this approach. Visual estimates using the standards and computer measurements differed only by 3.4 ± 2.8% (X ± SD).
To determine whether the percent of surface area occupied by donor cells reflected the total liver volume occupied by donor cells, 40 liver tissue sections from separate lobes of 10 recipient mice were mounted on slides, stained to identify donor cells, then imaged as described above to determine the percent of cross-sectional area occupied by donor-derived parenchyma. For each section this value was compared to the percent of the section perimeter occupied by blue-staining donor cells. The absolute difference between area and surface measures was 7.1 ± 6.7%. However, area values were distributed both higher and lower than surface values, so that mean donor-derived cross-sectional area was 51% and mean surface perimeter occupied by donor cells was 49% in these samples. In general, for the least repopulated quartile, mean perimeter measures tended to overestimate mean area staining (21% versus 18%), whereas for the most repopulated quartile, mean perimeter measures tended to underestimate mean area staining (73% versus 79%). Based on this data, we conclude that percent of liver surface area occupied by donor parenchyma provides a good estimate of total liver repopulation.
The cross-sectional area occupied by single blue-staining donor clones was determined on the liver surface under low-power magnification by measuring the major axes (a, b), then calculating area (of an oval) using the formula A = π[1/4(a + b)]2.
To measure the fraction of transplanted cells that engrafted in liver after splenic transplantation, 11-μm cryostat sections of the left, right, and caudate liver lobes of recipient mice that had received MT-nLacZ-marked donor cells 3 days before sacrifice were stained to detect nuclear β-galactosidase activity. The number of donor cells visible per cryostat section was counted, this number was reduced by 21% to account for nuclei that bridge adjacent tissue sections (as determined by examination of adjacent 11-μm cryostat sections from four livers), and the corrected number was divided by section volume (11 μm times section area, which was measured using computer-assisted image analysis). This value (donor cells per unit volume) was multiplied by liver mass to give donor cells per liver.
Next, the fraction of transplanted donor cells capable of expanding as foci was determined using the method of Moore et al, 23 which is reported to account specifically for the error introduced by random cross-sectioning of foci in thin tissue sections. Cryostat sections of the left, right, and caudate liver lobes of recipient mice that had received MT-nLacZ-marked donor cells 14 days before sacrifice were stained to detect β-galactosidase activity. These sections were used to count the number of donor foci present per unit cross-sectional liver area and to measure the radii of donor foci using r = 1/4(a + b), where a and b are the major axes. These data were used to calculate the number of foci per cm 3 of liver using the formula N = (1/r1 + 1/r2 + 1/r3 + … + 1/rn)/(πSA), where rn is the radius of the nth donor cell focus in cm and SA is the surface area of the liver section examined in cm2. Finally, focus number per cm 3 of liver was multiplied by liver weight in grams to determine total number of foci per liver. 10 This method could not be used to determine the fraction of engrafted cells at 3 days after transplantation because the diameters being measured must be larger than the section thickness.
Flow Cytometric Separation of Hepatocyte Ploidy Subpopulations
Approximately 5 × 10 6 hepatocytes were isolated as described above, then suspended in 2 ml of L15 medium containing 10 μg/ml Hoechst dye (Sigma), 10 μg/ml propidium iodide (PI) (Sigma), 10% fetal bovine serum, and 1% insulin-transferrin-selenium-X (Life Technologies, Inc., Grand Island, NY). Cells were kept at 37°C for 15 minutes before sorting, then maintained at 4°C while sorting. Cells were sorted by a FACStarPLUS (Becton Dickinson) equipped with an argon ion Innova 90 (Coherent) laser tuned to 488 nm and a Crypton Innova 90 (Coherent) laser tuned to multiline UV. Signals for PI were logarithmically amplified and acquired through a 630/30 optical filter. Hoechst signal was amplified linearly and collected through a 360/60 optical filter. Data were acquired and analyzed using CellQuest software (Becton Dickinson, San Jose, CA). The fluorescent characteristics of the total cell population were displayed on a dot plot as height of the PI signal versus forward scatter (FSC), allowing us to select, or gate, live hepatocytes (PI is excluded from live cells). The live hepatocyte population was displayed on a dot plot of Hoechst fluorescent area, a measure of DNA content, versus Hoechst fluorescent width, a measure of relative cell size. Gates were established around three generally discrete populations of hepatocytes that differed in DNA content, and each gated population was sorted into separate tubes. Cell concentration and viability of sorted cell populations was determined using trypan blue exclusion and a hemacytometer, then cells were transplanted separately into recipient mice as described above. Viability at this stage measured between 50 and 74% for each subpopulation of cells.
Isolated nuclei from nonsorted hepatocytes and splenic lymphocytes were prepared by suspending cells in phosphate-buffered saline (without Ca2+ and Mg2+) at pH 7.4 containing 1 mmol/L ethylenediaminetetraacetic acid and 0.1% bovine serum albumin with 1 mg/ml RNase A, 33 μg/ml PI, and 0.2% Igepal for at least 15 minutes at room temperature. One half of the nonsorted hepatocyte population then was spiked with lymphocyte nuclei to provide a diploid nucleus standard. Nuclear extracts were analyzed by FACScan (Becton Dickinson) and DNA analysis was performed by ModFit LT software, version 2.0 (Verity Software House, Topsham, Maine). In two studies, to determine the purity of the cell populations after the initial sort, a second sort was performed on each population using the methods described above. Additional Hoechst dye and PI were added to each cell population before the second sort. In two studies, cells were sorted directly onto microscope slides to allow determination of the numbers of hepatocyte clumps and nonparenchymal cells present in each sorted population.
Results
Generation and Characterization of MUP-uPA Transgenic Mice
The mouse MUP gene is expressed in hepatocytes, but expression does not initiate until mice are 2 to 4 weeks old. Expression of this gene also is higher in male animals, although this difference is less pronounced in animals carrying transgenes that use this promoter. 16 We anticipated that uPA expression would be delayed in MUP-uPA relative to AL-uPA transgenic mice, thereby eliminating uPA-mediated neonatal lethality and permitting more efficient repopulation by donor cells introduced into older transgenic recipient mice. Injection of the MUP-uPA construct into fertilized mouse eggs produced 22 FVB founder mice and nine C57BL/6 founder mice (Table 1) ▶ . At birth, founder mice were indistinguishable from nontransgenic littermates. In particular, perinatal hemorrhage was not observed. Typically, livers in mice in MUP-uPA lineages generated in either strain displayed a lobular pattern of lesion development by 1 month of age, with centrilobular cells being affected most severely. Several lineages, however, displayed diffuse lesions. One lineage of the latter type generated in the C57BL/6 background, designated 350-2, was used in all transplantation studies described below.
Table 1.
MUP-uPA Transgenic Founder Mouse Summary
| Genotype | Number of mice | Observation |
|---|---|---|
| FVB | 4 | Produced no positive transgenic offspring |
| 3 | Died by 6 weeks of age displaying diffuse edema | |
| 1 | Died by 6 weeks of age displaying pale liver | |
| 8 | Offspring displayed lobular pattern of hepatic lesions* | |
| 6 | Offspring displayed edema and/or diffuse hepatic lesions* | |
| C57BL/6 | 4 | Produced no positive transgenic offspring |
| 3 | Offspring displayed lobular pattern of hepatic lesions* | |
| 2 | Offspring displayed edema and/or diffuse hepatic lesions* |
*All surviving offspring displayed eventual repopulation of liver by normal-appearing hepatocytes.
Livers of line 350-2 MUP-uPA transgenic mice appeared normal at 2 weeks of age, but between 3 and 4 weeks of age became slightly pale compared to nontransgenic littermate control liver. Multiple small red foci became visible on the surface of transgenic mouse liver between 4 and 5 weeks of age. By 8 weeks of age, the livers were entirely red, but had a rough, nodular surface. Microscopically, between 3 and 4 weeks of age foci of normal appearing hepatocytes first became visible in a background of small hepatocytes containing multiple small vacuoles in the cytoplasm, and these foci of normal-appearing hepatocytes gradually increased in size and eventually replaced the entire parenchyma. Consistent with the onset and progression of lesions, serum alanine aminotransferase activity, an indicator of hepatocyte damage, began to increase at 4 weeks of age, peaked at 5 weeks, and returned to normal levels by 13 weeks of age (Figure 2A) ▶ . Serum total protein and albumin concentrations remained normal in transgenic mice throughout this period (data not shown). Transgene expression was not associated with preweaning lethality; 48 out of a group of 102 weaned offspring of a mating between heterozygous MUP-uPA mice and nontransgenic mice carried the transgene, close to the expected 50%. To identify age-related changes in transgene expression, uPA zymography was performed on serum from line 350-2 transgenic mice (Figure 2B) ▶ . Serum uPA concentrations were similar in transgenic and nontransgenic mice at both 2 weeks and 9 weeks of age, but elevated in transgenic versus nontransgenic mice at 4 weeks of age. By comparison, uPA levels were increased at birth in AL-uPA transgenic mice, then gradually decreased to control levels after 1 month of age. 8
Figure 2.
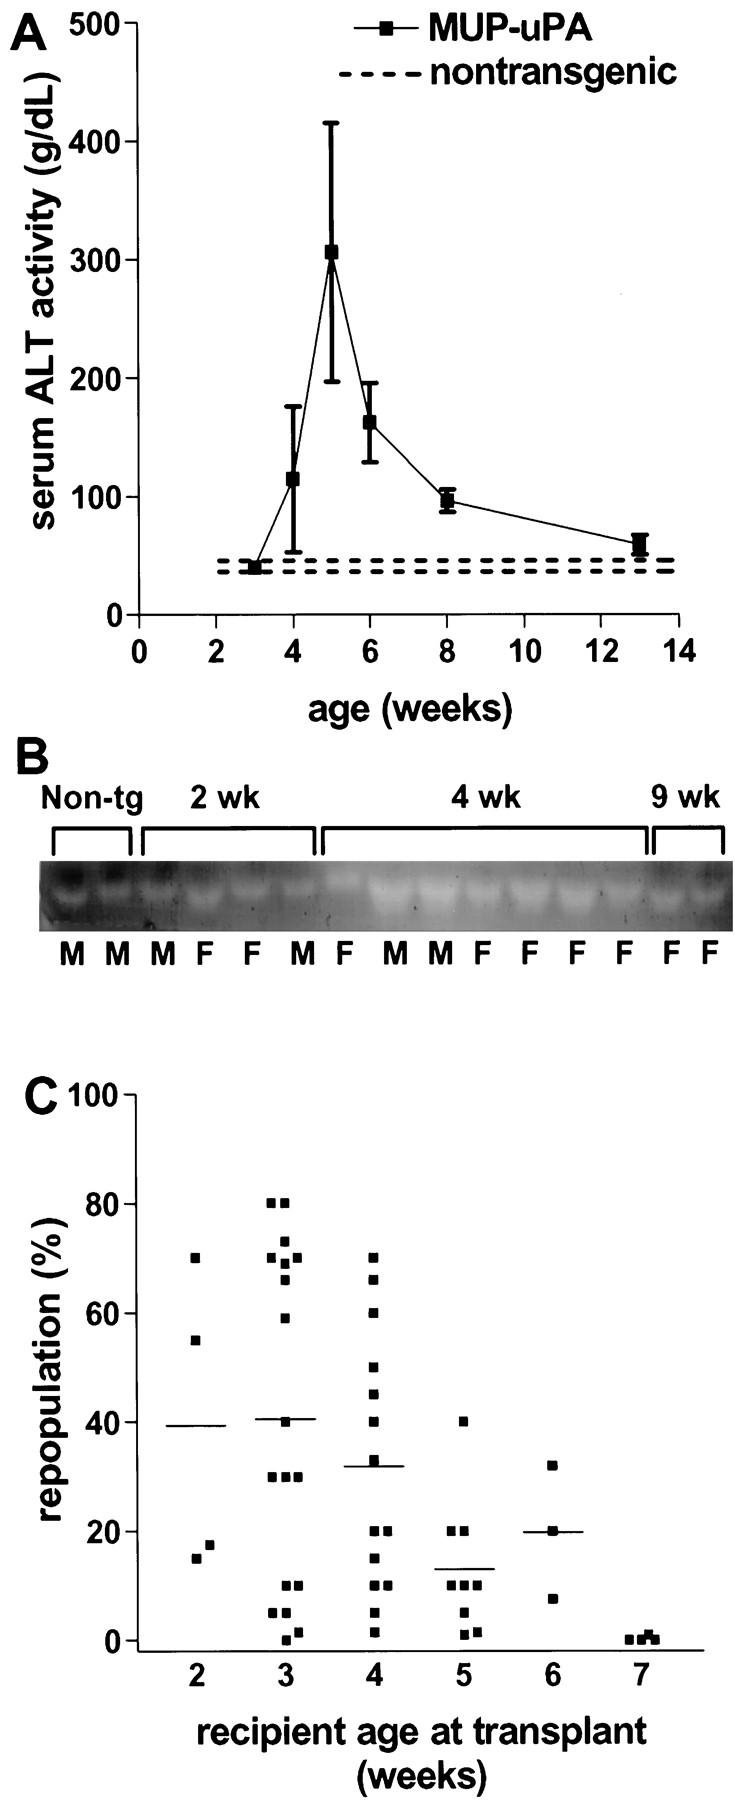
Liver disease and donor cell repopulation in MUP-uPA transgenic mice. A: Serum alanine aminotransferase activity in MUP-uPA transgenic mice. All values except those at 3 and 13 weeks are significantly elevated relative to pooled controls (P < 0.03, unpaired t-test). Each point for transgenic mice represents the mean ± SD of three to seven samples. Dashed lines indicate the two standard deviation range for values from nontransgenic littermate control mice (n = 5). B: Zymographic analysis of uPA in mouse serum as a function of mouse age. The intensity of each band is proportional to the amount of uPA catalytic activity present in that sample. Non-tg: serum from 4-week-old nontransgenic control mice. Letters below each lane indicate female (F) or male (M). C: Extent of repopulation by donor hepatocytes in MUP-uPA transgenic mice as a function of recipient age. Each point represents one mouse liver. Bars indicate mean values.
In other lines, lesion pathogenesis was similar, although in some the completion of repopulation by normal-appearing hepatocytes occurred at a later age. In these lines, a variable fraction of young MUP-uPA transgenic mice developed low plasma protein, displayed diffuse subcutaneous and internal edema, and had to be sacrificed (edema also was reported in some AL-uPA transgenic mice 9 ). Interestingly, this phenotype was modified by genetic background. Line 350-2 transgenic mice were generated in the C57BL/6 strain. After two generations of backcrossing into the FVB strain, several transgenic mice displayed subcutaneous edema. Conversely, backcrossing into C57BL/6 of one line of edema-prone MUP-uPA transgenic mice originally generated in the FVB strain reduced the incidence of edema to zero in the first and all subsequent backcross generations. Also like AL-uPA mice, older MUP-uPA transgenic animals frequently developed hepatic neoplasms. 24 In each of seven lines of transgenic mice examined in detail, hepatic tumors were observed with latencies of 9 to 26 months. For most lines, similar lesions were observed in both males and females.
To determine whether MUP-uPA transgenic mice could support repopulation by transplanted healthy hepatocytes, 1 to 5 × 10 5 hPAP- or nLacZ-marked donor hepatocytes were transplanted into MUP-uPA recipients that were between 2 and 7 weeks of age. Recipient mice were sacrificed 8 weeks later, livers were stained histochemically, and the extent of donor cell repopulation was quantitated. As in AL-uPA mice, repopulation was highly variable among MUP-uPA recipients regardless of gender, but ranged up to 80% in young recipients (Figure 2C) ▶ . Mice 5 weeks of age or older at the time of hepatocyte transplantation displayed less extensive donor cell repopulation (Figure 2C) ▶ , as expected given the greater extent of competing endogenous parenchymal repopulation present at these ages. Finally, in a separate experiment, five recipient C57BL/6 mice homozygous for the MUP-uPA transgene displayed 93 ± 3.4% repopulation by donor cells, suggesting that endogenous cell competition is reduced in homozygotes (also reported for homozygous AL-uPA recipient mice 25 ).
Donor Cell Engraftment and Replication Competence
We used MUP-uPA transgenic mice to examine several biological characteristics of hepatocyte transplantation. To measure the fraction of transplanted cells engrafting in host liver parenchyma, 1.6 × 10 5 nLacZ-marked donor hepatocytes were transplanted into spleens of 4-week-old MUP-uPA mice. Three days later, recipients were sacrificed, livers were weighed, and cryostat sections of liver were incubated with X-gal to identify donor cells in parenchyma (at this stage present as singlets or adjacent doublets). The number of blue-stained cells per section was used to determine the total number of engrafted donor cells per liver, as described in Methods. As presented in Table 2 ▶ , for two experiments a mean of 21% of the cells introduced into spleen engrafted into liver parenchyma. To determine the fraction of engrafted cells capable of replicating and expanding into foci, livers of additional recipients from these studies were collected at 2 weeks after transplantation, by which time significant donor focus growth had occurred. Similar analysis demonstrated that a mean of 6.6% of the transplanted cells gave rise to multicellular foci, indicating that approximately one-third of engrafted cells survived and proliferated (Table 2) ▶ .
Table 2.
Donor Cell Engraftment and Replicative Potential
| Time of analysis (after transplantation) | No. of recipients | Percentage of viable transplanted cells identified in parenchyma as cells (day 3) or as foci (day 14)* X±SD (range) |
|---|---|---|
| Day 3 | 10 | 21 ± 14 (5–49) |
| Day 14 | 8 | 6.6 ± 8.5 (0.9–27) |
*Calculations performed as outlined in Methods. Results represent pooled data from two experiments using separate donor cell populations transplanted at 1.6 × 10⁵ cells per recipient.
Rate and Persistence of Donor Cell Hepatic Reconstitution
To assess the rate of donor hepatocyte focal repopulation, we transplanted hPAP-marked hepatocytes isolated from 2- to 4-month-old transgenic mice into MUP-uPA recipients, then collected and histochemically stained recipient livers at 1, 2, 4, and 8 weeks after transplant. The surface cross-sectional area of 50 donor-derived hepatic foci was measured for each recipient at each time point. As illustrated in Figure 3 ▶ and Table 3 ▶ , focus expansion continued through 8 weeks after transplant. The mean focus cross-sectional area at each time after transplant was converted into mean focus volume, and this was used to estimate donor cell-doubling time 10 and cumulative cell doublings (Table 3) ▶ . Mean cell-doubling time was shortest during the first 2 weeks, corresponding to the maximal rate of focus expansion. By 8 weeks after transplant donor cells had undergone a mean of 12.2 cell doublings. Note that focus cross-sectional area was variable (Figure 3) ▶ . However, this variability could be explained by relatively small differences in cumulative cell doublings. Also, any focus initiating from a transplanted hepatocyte doublet could begin with a growth advantage. Interestingly, transplanted hepatocyte foci derived from 18- or 23-month-old donor mice displayed a rate of increase in mean cross-sectional area similar to that measured for young donor cells (Figure 3) ▶ .
Figure 3.

Rate of donor cell hepatic reconstitution. Solid triangles indicate the cross-sectional area of donor-derived foci after transplantation of hepatocytes isolated from 2- and 4-month-old hPAP transgenic donors (pooled data from two experiments). Area was measured on the liver surface, not on sectioned tissue. It therefore represents true focus cross-sectional area, and will not be biased by random cross-sectioning of foci. Each data point represents the mean ± SEM of cross-sectional area of 50 donor-derived foci from each of four to eight recipient mice. Solid squares indicate the cross-sectional area of donor-derived foci after transplantation of hepatocytes isolated from 18- and 23-month-old MT-hPAP transgenic donors (pooled data from two experiments). Each data point represents the mean ± SEM of cross-sectional area of 50 donor-derived foci from each of three to seven recipient mice. At 2, 4, and 8 weeks, data points are offset for ease of visualization.
Table 3.
Transplanted Hepatocyte Cell-Doubling Characteristics
| Time after transplant | Mean focus area (mm2)* | Mean focus volume (mm3)† | Mean cell number‡ | Cumulative cell doublings§ | Mean cell doubling time |
|---|---|---|---|---|---|
| 1 week | 0.007 | 0.00048 | 58 | 5.8 | 29 hours |
| 2 weeks | 0.04 | 0.0062 | 760 | 9.5 | 45 hours |
| 4 weeks | 0.09 | 0.020 | 2,400 | 11.2 | 200 hours |
| 8 weeks | 0.13 | 0.040 | 4,900 | 12.2 | 670 hours |
*Data for mean focus cross-sectional area taken from Figure 3 ▶ for 2- to 4-month-old donor cell preparations.
†V = 4/3πr3, taking r as [A/π]1/2, where A is mean focus cross-sectional area.
‡Calculated by dividing mean focus volume by mean hepatocyte volume (8.2 × 10⁻⁶ mm3 for a 25-μm-diameter hepatocyte; modified from Sandgren et al 9 ).
§Number of cell doublings needed to produce the mean cell number entered in column 4 from a single progenitor cell (assumes no cell death).
Calculated by dividing the number of hours in each posttransplant interval by the number of cell doublings for that interval.
Livers of MUP-uPA recipient mice were collected 18 months after transplant and stained to detect donor cells. From 12 experiments using different donor cell preparations, 36 of 44 recipient mice displayed evidence of donor cell foci, and retained up to 85% repopulation, illustrating the persistence of transplanted cells. Liver sections also were stained histochemically for hPAP to examine the morphology and organization of donor-derived hepatic parenchyma. Donor-derived hepatocytes were integrated into the hepatic lobule, and could be identified in all zones (Figure 4) ▶ . In general, margins between donor and endogenous parenchyma remained discrete, suggesting that cellular organization in repopulated liver is highly stable.
Figure 4.
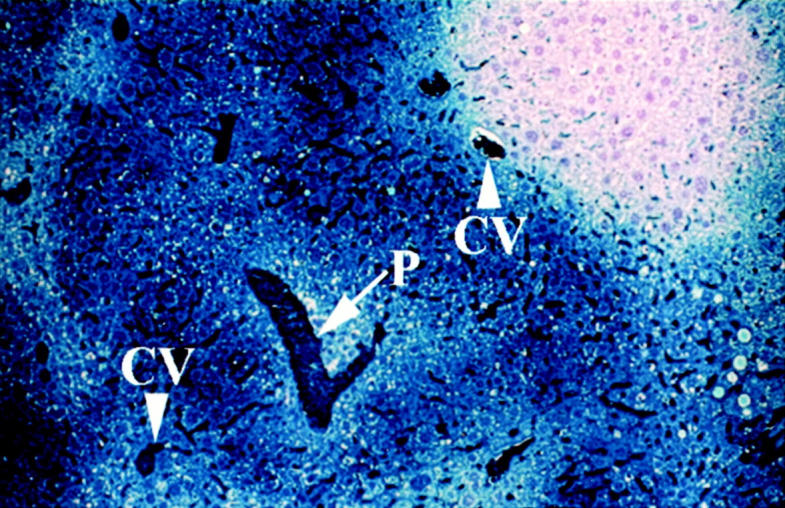
Microscopic appearance of donor-derived liver at 18 months after transplant. MT-hPAP-labeled hepatocytes were transplanted into a MUP-uPA transgenic mouse. The recipient mouse was sacrificed 18 months later, and the paraffin-embedded, sectioned liver was stained on a slide to identify hPAP-labeled donor cells. Arrow indicates portal triad (P). Arrowheads indicate central veins (CV). Notice that donor-derived parenchyma constitutes all zones of the hepatic lobule, and that the margin between donor (blue) and endogenous (unstained) parenchyma remains sharp. Original magnification, ×100.
Repopulation by Hepatocyte Subpopulations of Different Ploidy
Beginning in young adulthood, average hepatocyte DNA content gradually increases because of polyploidization. 26 This is accomplished both by development of polyploid nuclei and binuclearity. Diploid hepatocytes become a minority. Our finding that 33% of engrafted cells could mitotically expand as foci in recipient livers suggested that higher ploidy classes of hepatocytes are likely to participate in repopulation. However, we could not rule out differences in cell survival or engraftment between classes after transplantation of unfractionated liver cell preparations. Therefore, we sought to determine the ability of cells from three major ploidy classes to engraft and proliferate after transplantation into MUP-uPA transgenic recipients. The method of cell subpopulation isolation is illustrated in Figure 5 ▶ . In all cases, the diploid cell population was numerically the smallest, whereas tetraploid cells comprised the largest population (Figure 5B) ▶ . Identity of the lowest peak (M2) with a diploid population was confirmed by spiking a population of nonsorted hepatocyte nuclei with splenic cell nuclei (almost all diploid) and observing the increase in nuclei number at the M2 peak (data not shown). The remaining subpopulations displayed two and four times greater Hoechst fluorescent-staining intensity, as expected for tetraploid and octaploid cell populations, respectively. In two experiments, the isolated subpopulations were sorted a second time to assess the accuracy of the initial sort (Figure 5C ▶ and Table 4 ▶ ). In addition, in four experiments we microscopically examined sorted cell populations on slides to determine the number of contaminating nonparenchymal cells or hepatocyte doublets (Table 5) ▶ . As illustrated in Tables 4 and 5 ▶ ▶ , subpopulations were highly enriched (>90%) for hepatocytes of the expected ploidy. Finally, in two of these experiments the isolated diploid, tetraploid, and octaploid hepatocyte subpopulations were separately transplanted into MUP-uPA recipient mice (Table 6) ▶ . Although focus number in individual recipients varied widely, as observed previously after transplantation of crude cell preparations, each group of sorted cells gave rise to clonal hepatic foci. Analysis of surface cross-sectional area of donor-derived hepatic foci revealed similarity among subpopulations for this measure of donor cell growth potential (Table 6) ▶ , although nonsorted cells produced slightly larger foci (corresponding to one additional cell doubling by this stage), perhaps associated with a delay in initiation of repopulation by sorted cells or the presence of cell doublets in the nonsorted cell population.
Figure 5.
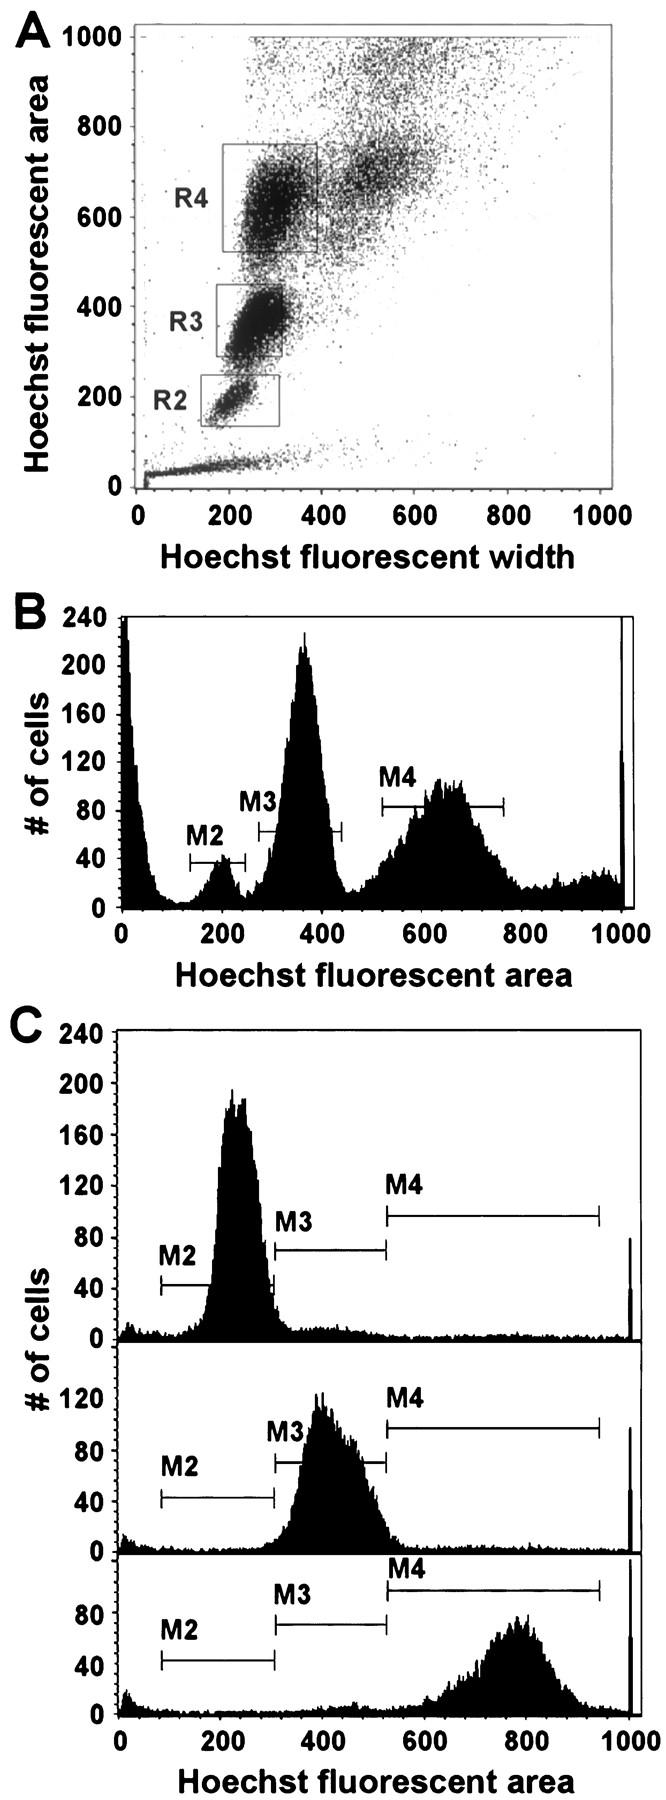
Flow cytometric analysis of a live donor hepatocyte population from a 5-month-old hPAP transgenic donor. A: Acquisition dot plot showing three relatively distinct populations of viable hepatocytes. The gated subpopulations of hepatocytes were designated as R2, R3, and R4, corresponding to diploid, tetraploid, and octaploid, respectively (see text). Note that, as expected for a mouse of this age, the diploid cell population is a minority representing 5.6% of all gated cells. In contrast, tetraploid and octaploid cells accounted for 49% and 44% of the gated populations, respectively. The population of very small particles in the lower left-hand corner of the plot is thought to represent cellular debris. The population of very large cells to the right of R4 is highly enriched for cell doublets, as determined by microscopic examination of cells isolated from this region (data not shown). B: Acquisition histogram showing three distinct peaks. The M2, M3, and M4 populations correspond to the R2, R3, and R4 populations in the acquisition dot plot. Note that fluorescent areas of M3 and M4 are two and four times as large as the M2 population fluorescent area, respectively. C: Acquisition histogram of resorted live donor hepatocyte subpopulations. Top, middle, and bottom panels represent the resort of the original M2, M3, and M4 live hepatocyte subpopulations, respectively. Hoechst dye was re-added to the cell populations before the second sort, so that Hoechst fluorescent areas of the original and resorted cell populations are not precisely equivalent. During the resort, each population was collected separately and for a variable length of time, so the number of cells in each resort population is not proportional to the fraction of that population in the original sort.
Table 4.
Resort Composition of Hepatocyte Ploidy Subpopulations*
| Experiment no. | Subpopulation | Percentage gated in resort as | ||
|---|---|---|---|---|
| Diploid (M2) | Tetraploid (M3) | Octaploid (M4) | ||
| 1 | Diploid | 98.6 | 1.2 | 0.1 |
| Tetraploid | 4.0 | 91.3 | 4.7 | |
| Octaploid | 0.8 | 7.4 | 91.8 | |
| 2 | Diploid | 92.9 | 5.7 | 1.4 |
| Tetraploid | 1.2 | 95.0 | 3.8 | |
| Octaploid | 0.7 | 3.1 | 96.2 | |
*Data is extracted from acquisition histograms of resorted live donor hepatocyte subpopulations, as shown in Figure 5C ▶ for experiment 2. Gates were established on the Hoechst fluorescent area axis at points of maximal resorted cell population overlap, setting limits for the diploid, tetraploid, and octaploid populations.
Table 5.
Microscopic Composition of Hepatocyte Ploidy Subpopulations
| Experiment no.* | Subpopulation | Percentage nonparenchymal cells X±SD | Percentage doublets† X±SD |
|---|---|---|---|
| 3, 4 | Diploid‡ | 4.7 | 7.3 |
| Tetraploid | 2.6 ± 0.2 | 8.1 ± 0.4 | |
| Octaploid | 2.7 ± 2.5 | 6.5 ± 1.8 | |
| 5, 6 | Diploid | ND§ | ND |
| Tetraploid | 2.9 ± 0.2 | 2.2 ± 1.6 | |
| Octaploid | 0.4 ± 0.4 | 3.2 ± 0.9 |
*Cells isolated in experiments 3 and 4 were transplanted into MUP-uPA recipient mice and assessed for repopulation efficiency (Table 6) ▶ .
†Cells isolated in experiments 3 and 4 were held in Eppendorf tubes until the experiment’s end, so that postsort clumping could have occurred. Cells isolated in experiments 5 and 6 were sorted directly onto microscope slides. Thus, measured values from experiments 5 and 6 should provide a more accurate measure of the true percent of cell clumping that is present immediately after sorting using this cell isolation approach.
‡Data for the diploid subpopulation available only from experiment 3.
§ND, not determined because the diploid cell population was too low in these cell preparations to permit accurate isolation.
Table 6.
Repopulation Characteristics of Hepatocyte Ploidy Subpopulations*
| Cell population | Viable cell number transplanted (range) | Number of recipients with foci/number recipients | Percentage of transplanted cells yielding foci X±SD (range)† | Focus cross-sectional area (mm2) X±SEM‡ |
|---|---|---|---|---|
| Unsorted | 9–18 × 103 | 3 /4 | 1.8 ± 2.2 (0.1–4.5) | 0.13 ± 0.03 |
| Diploid | 11 × 103 | 2 /2 | 1.9 ± 2.3 (0.2–3.5) | 0.07 ± 0.02 |
| Tetraploid | 11–16 × 103 | 5 /8 | 2.3 ± 3.2 (0.2–7.8) | 0.09 ± 0.02 |
| Octaploid | 8–19 × 103 | 6 /8 | 5.7 ± 6.3 (0.1–13) | 0.06 ± 0.01 |
*Pooled data from two experiments (3 and 4 from Table 5 ▶ ). Livers were collected and analyzed 6 weeks after transplant.
†Calculated for recipients that displayed donor cell foci. To compare repopulation efficiency among different hepatocyte subpopulations, two measurements were recorded. First, total surface focus number was counted for all recipient livers. Second, for a subset of recipients that displayed successful staining of liver cross sections for hPAP-marked donor foci (one receiving unsorted cells and two each receiving either diploid, tetraploid, or octaploid cells), total liver focus number was determined as described in Methods. From these seven mice, a ratio of total liver foci to surface focus number (6.8) was established, and this was used to calculate total liver foci for the remaining mice. Data were normalized by expressing total focus number as a percent of transplanted viable cells.
‡Calculated as described for Figure 3 ▶ .
Discusssion
Previous studies have shown that freshly isolated or cryopreserved transplanted hepatocytes can repopulate damaged hepatic parenchyma 10,12-15,25,27 . Our findings now demonstrate that 1) ∼21% of transplanted hepatocytes engraft in liver (similar to previous reports of 5 or 15% 10,28 ), and one-third of engrafted cells retain the ability to replicate into foci; 2) cells isolated from young adults and mice near the end of their life span display similar repopulation kinetics, undergoing ∼12 cell doublings before replication stops; 3) hepatocytes in different ploidy subpopulations can participate in this process; and 4) the extent of reconstituted donor parenchyma is stable as recipient mice age (although the rate of cell turnover in donor parenchyma was not assessed). Based on these observations, we suggest that a large fraction of adult hepatocytes can function as clonogens, supporting at least 12 cell doublings after transplantation into an appropriate host environment.
The studies using sorted cells are particularly relevant to conclusions regarding hepatocyte clonogenicity, although sorting of live hepatocytes by ploidy is not an established methodology. We therefore took several approaches to evaluate the composition of resulting subpopulations. First, in these studies, resorting indicated that the initial populations were >90% pure for the selected ploidy class (Table 4) ▶ , establishing the extent of reproducibility of this approach. Second, even after sorting there can be contamination of the isolated subpopulations by nonparenchymal cells or hepatocyte doublets (which may be sorted as though they were singlets of higher ploidy). As indicated in Table 5 ▶ , the extent of contamination generally is <10%, consistent with the value for resort purity. Sorting also requires chemical treatments, physical manipulations, and time ex vivo, each of which could affect cell viability or regenerative capacity.
Despite these limitations, our data support the conclusion that multiple hepatocyte ploidy classes can serve as progenitors for regenerating hepatocyte foci in damaged liver. First, in these experiments, 2 to 6% of transplanted sorted cells gave rise to foci in recipient livers. If contaminating nonparenchymal cells (generally <3%) were the source of all hepatocyte foci, then most to all of these nonparenchymal cells would have to possess stem cell-like characteristics, far higher than the expected frequency of putative nonparenchymal hepatic stem cells. 29 Of course, because nonparenchymal cell contamination was present in each population, we cannot exclude the possibility that some foci were derived from these cells. Second, it also is unlikely that contaminating doublets of lower cellular ploidy (2 to 8%) generated all foci. Each subpopulation was highly enriched for cells of the appropriate ploidy, and the repopulation efficiencies of each subpopulation were similar to one another and to nonsorted cells. If only contaminating cell doublets could give rise to foci after transplantation of higher ploidy subpopulations, the resulting donor focus number would have been reduced dramatically (by 12- to 50-fold), in contrast to what we observed. Finally, mean focus cross-sectional areas were comparable for each sorted donor subpopulation, indicating similar cell-doubling capacity of progenitor cells of each type. The question remains open whether the ultimate doubling capacity of cells within each different hepatocyte ploidy subpopulation could attain more than 77 cell doublings, as reported by Overturf et al 13 after serial transplantation of unfractionated liver cells, or whether only a subset of liver cells will approach immortality. However, whatever the answer to that question, our findings clearly indicate that transplantation of either crude or fractionated liver cell preparations should be adequate for most proposed therapeutic uses.
Donor cell-derived parenchyma also persisted in a panlobular distribution throughout recipient life span, indicating that maintenance of viable parenchyma does not require the contribution of a nonhepatocytic stem cell population. We note, however, that this finding cannot exclude a role for nonhepatocytic stem cells in normal liver cell turnover. There is experimental support for the existence of facultative liver stem cells in adult liver, most likely associated with Canals of Herring. 29 Under conditions of hepatic injury coupled with hepatocyte mitoinhibition, stem cell progeny may proliferate and differentiate into new hepatocytes. There also have been suggestions that this cell lineage may give rise to hepatocytes in normal liver. 30 However, if activated to proliferate in MUP-uPA mice, cells in this lineage could express the transgene once they initiated the program of hepatocyte differentiation. At that time, they may be eliminated by uPA-mediated toxicity, and any requirement for additional hepatocytes would be met by replication of existing hepatocytes. This outcome would preserve the donor-specific character of parenchyma in repopulated regions of the liver.
In certain ways, focal hepatocyte repopulation after hepatocyte transplantation resembles the diffuse hepatic proliferation that follows two-thirds partial hepatectomy. Most or all viable hepatocytes proliferate in response to the as yet unidentified signal(s) of hepatic insufficiency, the cell-doubling time is approximately equivalent (29 to 45 hours in this study), and proliferation stops after restoration of normal liver mass. Similar repopulation kinetics were observed in the retrorsine/partial hepatectomy rat model. 15 There also are several important differences. Regeneration after partial hepatectomy requires only one to two cell doublings by remaining hepatocytes to replace lost liver mass, and cell proliferation occurs within the microenvironment of existing hepatic lobules. Subsequent tissue reorganization to restore normal hepatic architecture involves intralobular proliferation and movement of nonparenchymal cells to reestablish appropriate spacing between hepatocytes, biliary epithelial cells, and sinusoids. In contrast, posttransplant repopulation is focal and, when associated with single progenitor cells, clonal. The process starts with many fewer proliferating cells (3 × 10 5 transplanted hepatocytes represents ∼0.3% of adult hepatocyte number), and cell proliferation continues through 12 or more cell doublings. Proliferating transplanted cells grow focally by expansion within parenchyma, so in this sense the process resembles micronodular hyperplasia associated with cirrhosis. 3,4 Although the consequences of these differences are not all apparent, it is clear that focal repopulation will require more time. 31 Nevertheless, the long-term outcome of both focal and diffuse regeneration is the same: restoration of architecturally and functionally normal liver.
The MUP-uPA transgenic mouse model provides an efficient experimental system with which to study hepatic repopulation. AL-uPA transgenic mice were used originally to demonstrate that transplanted healthy donor liver cells could focally repopulate diseased mouse liver. MUP-uPA transgenic mice share certain characteristics with their AL-uPA predecessors. First, hepatocyte-specific expression of uPA is hepatotoxic. Second, the diseased liver eventually is replaced through the expansion of small foci composed of normal-appearing parenchyma which, in AL-uPA transgenic mice, have been shown to lack transgene expression. 9 In AL-uPA transgenic mice, transgene expression initiates in fetal liver, producing a selective growth advantage for healthy cells throughout early liver development. Deletion of the AL-uPA transgene from hepatocytes can occur at any time during this period, and is followed by clonal replication of the transgene-deficient cells. 9 Consequently, the repopulating nodules are of widely varied size, ranging from <1 mm to almost 1 cm in 5-week-old mice. In contrast, the selective growth advantage should not be present until ∼3 weeks of age in MUP-uPA transgenic mice. Surprisingly, this later initiation of lesion development in MUP-uPA transgenic mice was not associated with a delay in repopulation of parenchyma by normal-appearing hepatocytes. Instead, at this age we observed simultaneous appearance of multiple small, uniformly sized foci of normal-appearing hepatocytes that rapidly became confluent. This is consistent with the presence in 3-week-old mice of a subset of hepatocytes that lack the ability to express the transgene, and which then begin to proliferate at the onset of transgene expression in neighboring cells. The net effect is parenchymal replacement by lesion-free cells that no longer produce uPA at 2 to 3 months of age in mice carrying either transgene construct. Third, both transgenic mouse models can support extensive although highly variable parenchymal repopulation by healthy donor hepatocytes. There are several likely causes of the variation in repopulation. The rate of replacement of damaged parenchyma by endogenous healthy cells is not identical among recipients carrying uPA transgenes. Thus, variation in the extent of competing endogenous regenerating parenchyma can influence the extent of donor cell repopulation. Also, during cell delivery, there can be leakage of transplant solution from the spleen, resulting in loss of donor cells. Injecting a small volume of solution minimizes splenic damage and cell leakage. Other aspects of the process, including transit of cells from spleen to liver, engraftment, and subsequent focal expansion also may vary among recipients. However, in both models, homozygous recipients support up to 100% repopulation by donor cells. The MUP-uPA model does provide several important advantages relative to AL-uPA mice. First, neonatal lethality is not observed in MUP-uPA transgenic mice because of the later onset of hepatic transgene expression. Second, donor hepatocytes can be transplanted into 3- to 4-week-old MUP-uPA mice, providing easier surgical manipulation and better recipient survival (cells transplanted into younger recipients likely remain mitotically quiescent until the initiation of transgene expression at 3 weeks). Finally, in contrast to AL-uPA transgenic mice, MUP-uPA transgenic mice can be maintained on an inbred background. This expands the opportunity to examine the biology of chimeric livers under conditions in which both host and donor genotypes can be controlled.
Acknowledgments
We thank Dr. William Held for providing the cloned MUP promoter, Dr. Robert Auerbach for discussions regarding cell sorting, Meg Bowden for assistance with computer image analysis, Kathy Schell and Kristin Elmer for assistance with flow cytometry, and Dr. William Kisseberth for generating R26-hPAP transgenic mice.
Footnotes
Address reprint requests to Eric P. Sandgren, University of Wisconsin-Madison, School of Veterinary Medicine, 2015 Linden Dr. West, Madison, WI 53706. E-mail: sandgren@svm.vetmed.wisc.edu.
Supported by National Institutes of Health grants RO1-ES07671, RO1-DK49787 (to E. P. S.), and RO1-HL47826 (to J. L. D.) and grant 2 T32 ES7015-21 from the National Institute of Environmental Health Sciences (to T. C. W.).
References
- 1.Michalopoulos GK, DeFrances MC: Liver regeneration. Science 1997, 276:60-66 [DOI] [PubMed] [Google Scholar]
- 2.Fausto N, Webber E: Liver regeneration. Arias IM Boyer JL Fausto N Jakoby WB Schachter D Shafritz DA eds. The Liver Biology and Pathobiology. 1994, :pp 1059-1084 Raven Press Ltd., New York [Google Scholar]
- 3.Hall P (Ed): Alcoholic liver disease. Pathological Spectrum of Alcoholic Liver Disease. Boston, Edward Arnold, 1995, pp 41–68
- 4.Millward-Sadler GH, Wright R, Arthur M: Wright’s liver and biliary disease. Friedman SL Millward-Sadler GH Arthur M eds. Liver Fibrosis and Cirrhosis. 1992, :pp 822-881 W. B. Saunders Company Ltd., Philadelphia [Google Scholar]
- 5.Higgins G, Anderson R: Experimental pathology of the liver: I. Restoration of the liver of the white rat following partial surgical removal. Arch Pathol 1931, 12:186-202 [Google Scholar]
- 6.Taub R: Liver regeneration 4: transcriptional control of liver regeneration. FASEB J 1996, 10:413-427 [PubMed] [Google Scholar]
- 7.Braun KM, Sandgren EP: Liver disease and compensatory growth: unexpected lessons from genetically altered mice. Int J Dev Biol 1998, 42:935-942 [PubMed] [Google Scholar]
- 8.Heckel JL, Sandgren EP, Degen JL, Palmiter RD, Brinster RL: Neonatal bleeding in transgenic mice expressing urokinase-type plasminogen activator. Cell 1990, 62:447-456 [DOI] [PubMed] [Google Scholar]
- 9.Sandgren EP, Palmiter RD, Heckel JL, Daugherty CC, Brinster RL, Degen JL: Complete hepatic regeneration after somatic deletion of an albumin-plasminogen activator transgene. Cell 1991, 66:245-256 [DOI] [PubMed] [Google Scholar]
- 10.Rhim JA, Sandgren EP, Degen JL, Palmiter RD, Brinster RL: Replacement of diseased mouse liver by hepatic cell transplantation. Science 1994, 263:1149-1152 [DOI] [PubMed] [Google Scholar]
- 11.Grompe M, Lindstedt S, Al-Dhalimy M, Kennaway NG, Papaconstantinou J, Torres-Ramos CA, Ou CN, Finegold M: Pharmacological correction of neonatal lethal hepatic dysfunction in a murine model of hereditary tyrosinaemia type I. Nat Genet 1995, 10:453-460 [DOI] [PubMed] [Google Scholar]
- 12.Overturf K, Al-Dhalimy M, Tanguay R, Brantly M, Ou CN, Finegold M, Grompe M: Hepatocytes corrected by gene therapy are selected in vivo in a murine model of hereditary tyrosinaemia type I. Nat Genet 1996, 12:266-273 [DOI] [PubMed] [Google Scholar]
- 13.Overturf K, Al-Dhalimy M, Ou CN, Finegold M, Grompe M: Serial transplantation reveals the stem-cell-like regenerative potential of adult mouse hepatocytes. Am J Pathol 1997, 151:1273-1280 [PMC free article] [PubMed] [Google Scholar]
- 14.Fausto N: Hepatocytes break the rules of senescence in serial transplantation studies. Is there a limit to their replicative capacity? Am J Pathol 1997, 151:1187-1189 [PMC free article] [PubMed] [Google Scholar]
- 15.Laconi E, Oren R, Mukhopadhyay DK, Hurston E, Laconi S, Pani P, Dabeva MD, Shafritz DA: Long-term, near-total liver replacement by transplantation of isolated hepatocytes in rats treated with retrorsine. Am J Pathol 1998, 153:319-329 [DOI] [PMC free article] [PubMed] [Google Scholar]
- 16.Held WA, Mullins JJ, Kuhn NJ, Gallagher JF, Gu GD, Gross KW: T antigen expression and tumorigenesis in transgenic mice containing a mouse major urinary protein/SV40 T antigen hybrid gene. EMBO J 1989, 8:183-191 [DOI] [PMC free article] [PubMed] [Google Scholar]
- 17.Brinster RL, Chen HY, Trumbauer ME, Yagle MK, Palmiter RD: Factors affecting the efficiency of introducing foreign DNA into mice by microinjecting eggs. Proc Natl Acad Sci USA 1985, 82:4438-4442 [DOI] [PMC free article] [PubMed] [Google Scholar]
- 18.Kisseberth WC, Brettingen NT, Lohse JK, Sandgren EP: Ubiquitous expression of marker transgenes in mice and rats. Dev Biol 1999, 214:128-138 [DOI] [PubMed] [Google Scholar]
- 19.Zambrowicz BP, Imamoto A, Fiering S, Herzenberg LA, Kerr WG, Soriano P: Disruption of overlapping transcripts in the ROSA beta geo 26 gene trap strain leads to widespread expression of beta-galactosidase in mouse embryos and hematopoietic cells. Proc Natl Acad Sci USA 1997, 94:3789-3794 [DOI] [PMC free article] [PubMed] [Google Scholar]
- 20.Klaunig JE, Goldblatt PJ, Hinton DE, Lipsky MM, Chacko J, Trump BF: Mouse liver cell culture. I. Hepatocyte isolation. In Vitro 1981, 17:913-925 [DOI] [PubMed] [Google Scholar]
- 21.Berry MN, Friend DS: High-yield preparation of isolated rat liver parenchymal cells: a biochemical and fine structural study. J Cell Biol 1969, 43:506-520 [DOI] [PMC free article] [PubMed] [Google Scholar]
- 22.Braun KM, Sandgren EP: Cellular origin of regenerating parenchyma in a mouse model of severe hepatic injury. Am J Pathol 2000, 157:561-569 [DOI] [PMC free article] [PubMed] [Google Scholar]
- 23.Moore MR, Drinkwater NR, Miller EC, Miller JA, Pitot HC: Quantitative analysis of the time-dependent development of glucose-6-phosphatase-deficient foci in the livers of mice treated neonatally with diethylnitrosamine. Cancer Res 1981, 41:1585-1593 [PubMed] [Google Scholar]
- 24.Sandgren EP, Palmiter RD, Heckel JL, Brinster RL, Degen JL: DNA rearrangement causes hepatocarcinogenesis in albumin-plasminogen activator transgenic mice. Proc Natl Acad Sci USA 1992, 89:11523-11527 [DOI] [PMC free article] [PubMed] [Google Scholar]
- 25.Rhim JA, Sandgren EP, Palmiter RD, Brinster RL: Complete reconstitution of mouse liver with xenogeneic hepatocytes. Proc Natl Acad Sci USA 1995, 92:4942-4946 [DOI] [PMC free article] [PubMed] [Google Scholar]
- 26.Brodsky WY, Uryvaeva IV: Cell polyploidy: its relation to tissue growth and function. Int Rev Cytol 1977, 50:275-332 [DOI] [PubMed] [Google Scholar]
- 27.Jamal HZ, Weglarz TC, Sandgren EP: Cyropreserved mouse hepatocytes retain regenerative capacity in vivo. Gastroenterology 2000, 118:390-394 [DOI] [PubMed] [Google Scholar]
- 28.Ponder KP, Gupta S, Leland F, Darlington G, Finegold M, DeMayo J, Ledley FD, Chowdhury JR, Woo SL: Mouse hepatocytes migrate to liver parenchyma and function indefinitely after intrasplenic transplantation. Proc Natl Acad Sci USA 1991, 88:1217-1221 [DOI] [PMC free article] [PubMed] [Google Scholar]
- 29.Sell S, Ilac Z: Liver Stem Cells. 1997. R. G. Landes Bioscience, Austin
- 30.Sigal SH, Brill S, Fiorino AS, Reid LM: The liver as a stem cell and lineage system. Am J Physiol 1992, 263:G139-G148 [DOI] [PubMed] [Google Scholar]
- 31.Braun KM, Degen JL, Sandgren EP: Hepatocyte transplantation in a model of toxin-induced liver disease: variable therapeutic effect during replacement of damaged parenchyma by donor cells. Nat Med 2000, 6:320-326 [DOI] [PubMed] [Google Scholar]