

Abstract
Recent evidence has implicated complement in renal transplant injury and identified the kidney as a source of complement components. We therefore investigated the local gene expression of complement component C3, pivotal to complement activation pathways and a mediator of inflammatory injury, in a rat renal transplant model. By reverse transcriptase-polymerase chain reaction, the expression of C3 mRNA increased in two phases. The first phase coincided with post-ischemic injury over 2 days post-transplantation and was localized by in situ hybridization to vessels and glomerular mesangial cells in allogeneic and syngeneic (control) kidney transplants. In allografts only, a second phase was found in tubular epithelial cells, glomerular parietal cells, vessel walls and some infiltrating cells, which peaked on day 4 together with rapid influx of leukocytes, tubule cell damage, the induction of interleukin-2 and interferon-γ mRNA, and the up-regulation of tumor necrosis factor-α and interleukin-1β mRNA in the graft. In vitro studies showed that interleukin-2 and interferon-γ up-regulate C3 production in renal tubule cells. We conclude that post-ischemic injury led to transient up-regulation of glomerular expression of C3 mRNA. Subsequent cellular rejection was associated with tubulointerstitial/glomerular parietal cell expression of C3 mRNA. This differential expression of local C3, immediately post-transplant or associated with acute rejection, may have implications for putative therapeutic complement inhibition in clinical transplantation.
Complement components, especially complement component C3, are important pro-inflammatory and immunoregulatory molecules 1 that are activated and deposited during episodes of acute renal transplant rejection. 2-4 Although C3 is produced mainly in the liver, smaller quantities are also produced in other tissues, including the kidney. 5 Primary cell culture studies and in situ mRNA analysis have identified a number of renal cell types capable of C3 synthesis, including glomerular and tubular cells. 6-8
Local production of C3 by renal cells can be up-regulated by cytokines; increased renal synthesis of C3 occurring in inflammatory diseases, such as immune complex nephritis, 9 interstitial nephritis, 9 and cellular transplant rejection. 10 Infiltrating macrophages and monocytes potentially also contribute to local C3 production. C3 of both donor and recipient origin is expressed in renal transplants, 11 and is found deposited on tubules and blood vessel walls in renal allografts biopsied during rejection episodes. 12
In vitro analysis has shown that the lymphocyte-derived proinflammatory cytokines interleukin (IL)-2 and interferon (IFN)-γ stimulate human renal tubular epithelial cells to produce C3. 13 Because both these proinflammatory cytokines are expressed in clinical and experimental renal allografts, it is possible that enhanced production of C3 under the influence of these cytokines could contribute to the inflammatory response against the graft. Additionally, C3 mRNA has been detected by reverse transcriptase-polymerase chain reaction (RT-PCR) in rat renal allografts within 3 hours after transplantation. 14 Although that study did not identify the cellular source of C3 mRNA, C3 expression occurred before overt infiltration by lymphocytes, implying donor origin, and before the expression of inflammatory cytokines such as IL-1, IL-2, and IFN-γ. The regulatory signals underlying C3 mRNA expression in vivo, and the identity of the cells producing C3 locally, whether infiltrating or resident, remained obscure.
Our hypothesis was that local production of C3 in acute renal allograft rejection occurs mainly in renal tubules and is up-regulated by pro-inflammatory cytokines produced within the graft. To test this we examined the site of C3 mRNA expression and the relationships between C3, IL-2, IFN-γ, tumor necrosis factor (TNF)-α, and IL-1β mRNA expression throughout the time course of acute allograft rejection in a rat model of MHC class I and II mismatched renal transplantation. We show that C3 production occurs in a site and time-dependent fashion, which could be partly explained by a coincident increase in mRNA expression for proinflammatory cytokines IL-2, IFN-γ, TNF-α, and IL-1β as transplanted tissues became infiltrated with leukocytes.
Materials and Methods
Renal Transplantation
Orthotopic renal allografts from Lewis (RT11) to DA (RT1a) rats, and isografts from DA (RT1a) to DA (RT1a) rats (purchased from Harlan Olac, Bicester, UK) were transplanted using the technique of Fabre et al. 15 Recipients were sacrificed at days 1 to 5 post-transplantation (n = 4 in each group/day). The transplanted kidney was removed and processed for histopathology, frozen section immunohistochemistry, and in situ hybridization as described previously. 16
Histology
Kidney tissue was processed and embedded in paraffin. Sections 2 μm thick were stained for hematoxylin and eosin. The histological grading of acute transplant rejection was performed using the Banff schema. 17
Immunohistochemistry for C3
Cryostat sections (4 μm) of transplanted and normal rat kidneys were fixed in cold acetone and stained using horseradish peroxidase (HRP)-conjugated anti-rat C3 mAb (The Binding Site, Birmingham, UK) with the method previously described. 16
In Situ Hybridization
Rat C3 mRNA was detected by in situ hybridization on frozen sections according to the method of Furusu et al. 8 Briefly, 4-μm frozen sections of rat kidney tissues were cut and mounted on glass slides coated with 3-aminopropyltriothoxysylane (Sigma, St Louis, MO). Sections were fixed with 4% paraformaldehyde in phosphate buffered saline and then protein digested using hydrochloric acid and proteinase K (Sigma) to increase permeability of reactants. After this prehybridization treatment, sections were hybridized with DIG-labeled sense and anti-sense oligonucleotide probes corresponding to bases 46–70 of rat C3 cDNA, as previously described, 18 in the prehybridization buffer. After washing with 0.75% BRIJ (Sigma) in 2× and 0.5× standard saline citrate, DIG-labeled probe was visualized by immunohistochemical staining using a HRP-conjugated anti-DIG mAb (see below).
Immunohistochemistry for in Situ Probe Visualization
After the sections were pre-incubated with a blocking solution of 20% normal swine serum (DAKO, High Wycombe, UK), 5% fetal bovine serum (JRH, Lenexa, KS), and 5% bovine serum albumin (Wako, Osaka, Japan) in PBS, sections were incubated with murine anti-DIG mAb (Boehringer Mannhein Biochemica, Mannheim, Germany) to associate with any bound DIG-labeled probe and then reacted with HRP-conjugated goat anti-mouse Ig mAb (DAKO) and HRP-conjugated rabbit anti-goat Ig mAb (DAKO). Color was developed using 3,3-diaminobenzidine/tetrahydrochloride and hydrogen peroxide. Finally, sections were counterstained with methyl green and mounted. Cells with a clearly stained cytoplasm or stained with a perinuclear pattern were identified as C3 mRNA-positive. Conversely, C3 mRNA-negative cells were stained with methyl green only. To evaluate the specificity of the assay, control experiments using a pretreatment with RNase or a competitive study using a sense probe were undertaken as previously described. 8 The scoring used to evaluate the sections was as follows: negative, −; very weak, ±; weak, +; moderate, ++; strong, +++.
RT-PCR
Using the method of Chomczynski and Sacchi, 19 RNA was extracted from portions of frozen renal cortex and cDNA was synthesized. Oligonucleotide primers for rat β-actin, IFN-γ, TNF-α, and IL-1β and C3 were produced using published sequences (Table 1) ▶ , and primers for rat IL-2 were designed using Oligo-4 software. All primer pairs were synthesized by Life Sciences (Paisley, UK). All amplifications were performed using 30 cycles and a primer annealing temperature of 65°C, in duplicate. Using cDNA reflecting 1.5 μg total RNA in a 25-μl reaction volume, and 3 U Taq Polymerase (Promega, Southampton, UK), reaction conditions with these primer pairs were as detailed in Table 1 ▶ , and chosen to ensure amplification in the linear phase. By densitometric analysis, the amount of IL-2, IFN-γ, IL-1β, TNF-α, and C3 transcripts at each day post-transplant was expressed as a percentage of the amplified β-actin transcript, to provide semiquantitative relative expression data. No PCR product was detected using water or non-reverse-transcribed RNA as template (not shown).
Table 1.
Oligonucleotide Primers Used in RT-PCR
| Transcript | Oligonucleotide sequence | Size (bp) | [MgCl2] mmol/L | Primer (pmol) | Ref. |
|---|---|---|---|---|---|
| β-actin-1 | 5′-TTG TAA CCA ACT GGG ACG ATA TGG-3′ | 764 | 1.5 | 6.25 | 14 |
| β-actin-2 | 5′-GAT CTT GAT CTT CAT GGT GCT AGG | ||||
| IL-2-1 | 5′-CAT GTA CAG CAT GCA GCT CGC ATC C-3′ | 410 | 1.0 | 12.5 | |
| IL-2-2 | 5′-CCA CCA CAG TTG CTG GCT CAT CAT C-3′ | ||||
| IFN-γ-1 | 5′-ATC TGG AGG AAC TGG CAA AAG GAC GC-3′ | 288 | 1.5 | 12.5 | 14 |
| IFN-γ-2 | 5′-CTT AGG CTA GAT TCT GGT GAC AGC-3′ | ||||
| TNFα-1 | 5′-GCC TCC GCA TCC CAC CTT TG-3′ | 396 | 1.5 | 12.5 | 26 |
| TNFα-2 | 5′-GCG GGT GAC TTC TTT GGC GT-3′ | ||||
| IL-1β-1 | 5′-CCA GGA TGA TGA CCC AAG CA-3′ | 519 | 1.5 | 12.5 | 26 |
| IL-1β-2 | 5′-TCC CGA CCA TTG CTG TTT CC-3′ | ||||
| C3-1 | 5′-GAC CTG CGA CTG CCC TAC TCT-3′ | 272 | 1.5 | 12.5 | 27 |
| C3-2 | 5′-CTG ATG AAG TGG TTG AAG ACG G-3′ |
IL-2 and IFN-γ Stimulation of Cultured Renal Tubular Cells
Immortalized rat renal proximal tubular epithelial cells (106) (PTEC; ECACC, Salisbury, UK) were stimulated with 300 U of recombinant human IL-2 (Promega) or 500 U IFN-γ (Promega) as previously described 20 for 6, 12, 24, and 48 hours. After incubation, RNA was extracted and cDNA synthesized. The resulting product was used as a template for semiquantitative PCR, as described above, for rat C3 gene expression.
Results
Time Course for the Histopathological Injury
Acute tubular necrosis (ATN), characteristic of ischemia/reperfusion injury, developed in all transplanted organs, characterized principally by tubular cytoplasmic thinning. In isografts and allografts at day 1 such ATN was mild, but it was more prevalent by day 2 post-transplantation (Figure 1) ▶ . Isografts demonstrated structural recovery from day 3 post-transplantation. In the allografts, progressive infiltration with leukocytes occurred from day 1, initially around glomeruli and perivascular bundles, with a marked increase at day 4. This was accompanied by invasion of the interstitium and renal tubules. By day 5, allografts exhibited gross infiltration and thrombosis, interstitial hemorrhage, and patchy infarction, fulfilling grade III acute rejection of the Banff schema (Figure 1) ▶ .
Figure 1.
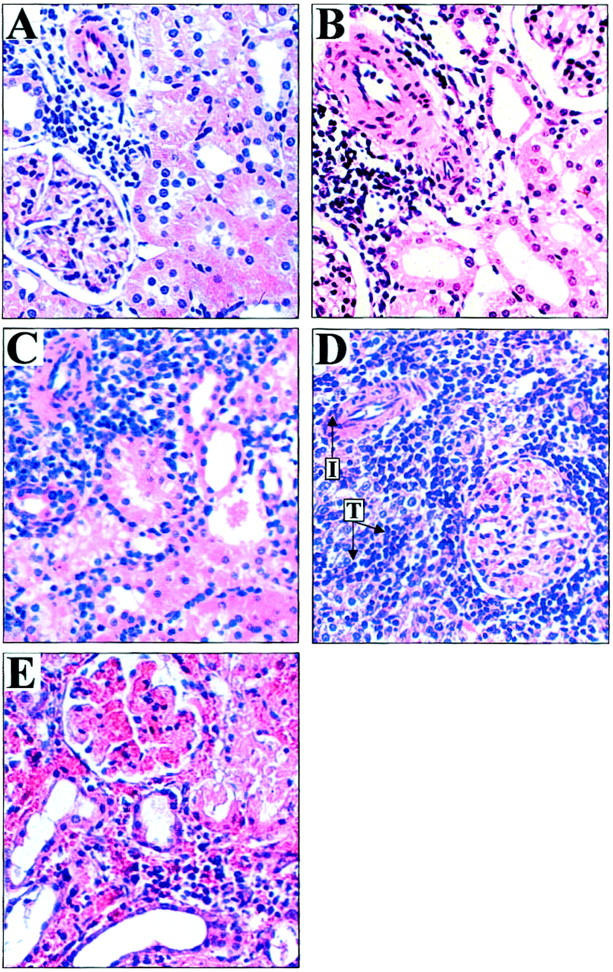
The histopathology of renal allograft rejection. Lewis to DA renal allograft pathology by H&E staining (×250). By day 1 post-transplant (A), thinning of tubules indicative of acute tubular necrosis (ATN) was the predominant pathological lesion. These changes peaked in severity at day 2 (B) and were present in syngeneic grafts (not shown) and therefore indicative of ischemia/reperfusion injury. By day 3 (C) allografted organs were recovering from ATN but showed increasing perivascular and periglomerular infiltration by leukocytes. On day 4 (D) a marked increase in leukocyte infiltration was seen accompanied by tubulitis (T) and vascular inflammation (I). At day 5 (E), grafts showed severe tubulitis, hemorrhage, thrombosis, and infarction. At this point tissues were judged to have reached Banff Grade III severe acute rejection.
Expression of C3 mRNA in Rejecting and Non-Rejecting Grafts
RT-PCR studies on rat renal transplants showed an immediate increase in C3 mRNA expression in both isografts and allografts. In isografts, this was followed by a gradual return to baseline (Figure 2) ▶ . In allografts there was a second rise in C3 mRNA expression. This biphasic pattern of mRNA expression was confirmed in two independent series of rat experiments. The second, allograft-specific peak corresponded with the marked influx of leukocytes between days 3 and 4 post-transplantation, as previously characterized. 21 In situ hybridization using a probe for rat C3 mRNA was performed on renal isografts and allografts harvested at days 1–5 post-transplantation. In normal rat kidney, few cells expressing C3 mRNA were observed in glomeruli or in the tubulointerstitium, as illustrated in Figure 3 ▶ and summarized in Table 2 ▶ . In both isografts and allografts on days 1 and 2 post-transplantation, C3 mRNA staining increased in glomeruli in a predominantly mesangial distribution (Figure 3 ▶ and Table 2 ▶ ). There was patchy, weak tubular expression of C3. These changes coincided with the first peak of C3 expression detected by RT-PCR. Controls using saturating concentrations of unlabeled homologous oligonucleotide probes competitively inhibited labeled probes, and no staining was found using DIG-labeled C3 sense probe.
Figure 2.

C3 mRNA expression in allografts and isografts by RT-PCR. Representative bands of β-actin and C3 RT-PCR from rat renal allografts and isografts are shown. The graph shows the basal expression of C3 in normal kidney (day 0) up-regulated in allografts ( ) and isografts (- - ▴- - ) by day 1 post-transplant. This initial peak declined by day 3 in both groups. In allografts alone a second phase of C3 mRNA expression was detected which peaked at day 4 (n = 4/day ± SEM, performed in duplicate).
Figure 3.
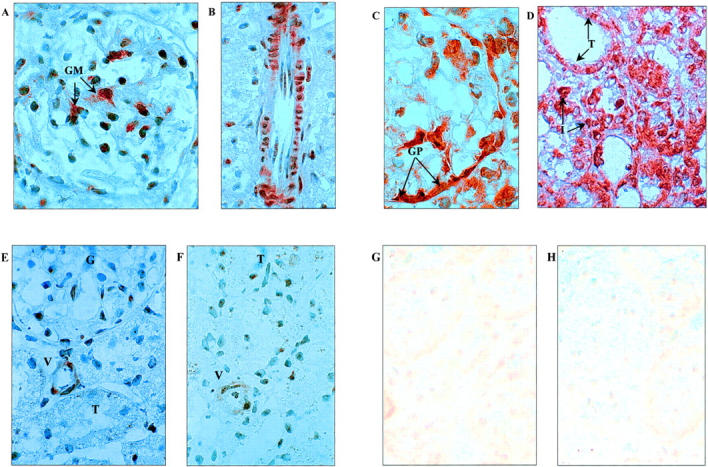
Detection of C3 mRNA by in situ hybridization (original magnification, ×1000). Day 2 syngeneic grafts showed dense staining of C3 mRNA in glomeruli (A) with a glomerular mesangial cell distribution (GM), and in smooth muscle cells of arterial vessel walls (B). A similar staining pattern was found in allogeneic organs at day 2 (not shown). In allografted kidneys at day 4, dense staining for C3 mRNA was found in glomerular parietal cells (C) of the Bowman’s capsule (GP), as well as tubule cells (T) and in some infiltrating cells (I), (D). In syngeneic kidneys at day 4 however (E), staining was very weak in glomeruli (G), tubules (T), and vessels (V), compared to allogeneic tissue and similar to that found in normal kidney (F). Negative controls were performed using sense probe on transplanted tissues. Representative negative control photomicrographs are shown for day 4 in allografts (G) and isografts (H) and showed low background staining.
Table 2.
Results of in Situ Hybridization for C3 mRNA in Transplanted Kidneys
| Syngeneic grafts | Allogeneic grafts | |||||||||
|---|---|---|---|---|---|---|---|---|---|---|
| Mes | GPEC | Tub | Inf | Ves | Mes | GPEC | Tub | Inf | Ves | |
| Day 0 | −/+ | − | − | − | −/+ | −/+ | − | − | − | −/+ |
| Day 2 | ++ | + | −/+ | − | ++ | ++ | + | −/+ | −/+ | ++ |
| Day 4 | + | −/+ | − | − | + | ++ | +++ | +++ | ++ | ++ |
Localization of C3 mRNA was examined from day 1 to day 5 post-transplant. The table shows expression in normal rat kidney (day 0) and at day 2 and day 4 post-transplantation, corresponding to the peaks of expression detected by RT-PCR.
Mes, mesangial cell; GPEC, glomerular parietal epithelial cell; Tub, tubular epithelial cell; Inf, infiltrating cell; Ves, vessel.
Between days 3 and 5 post-transplantation, staining for C3 mRNA diminished in syngeneic grafts. By contrast, staining persisted in the vascular smooth muscle cells of arterial walls in allogeneic kidneys at day 4 and 5, with an increased staining of C3 mRNA in renal tubule epithelial cells, infiltrating cells, and the Bowman’s capsule. These changes in C3 mRNA expression in day 4 and 5 rejecting kidneys were associated with the second, allograft-specific peak of C3 mRNA detected by RT-PCR.
Regulation of C3 mRNA Expression by Cytokines
To determine the kinetics of mRNA expression for IL-2, IFN-γ, TNF-α, and IL-1β in relation to C3, we performed analysis by RT-PCR on the same transplanted tissues (Figure 4) ▶ . In the allogeneic grafts, there was induction of IL-2 mRNA expression from as early as day 1 post-transplant, with a marked increase by day 3. IFN-γ mRNA expression was evident from day 3 post-transplant, peaking on day 4 and corresponding to the gross expansion of the infiltrating cell population. No expression of IL-2 or IFN-γ was detected in isografts or in normal rat kidney tissue. In contrast, a basal level of mRNA expression for IL-1β and TNF-α was detected in normal rat kidney and was significantly up-regulated in allografts only after day 3 post-transplant. Expression for mRNA of these cytokines in isograft tissues varied around baseline but was not significantly increased compared to normal tissue controls.
Figure 4.

The expression of pro-inflammatory cytokines by RT-PCR in transplanted kidneys. By RT-PCR, no IL-2 (A) or IFN-γ (B) gene expression was detected in normal (day 0) renal tissue or in syngeneic kidney transplants. In allogeneic grafts IL-2 gene expression peaked at day 3 post-transplant, whereas IFN-γ gene transcription was detected from day 3, peaking at day 4 post-transplant. Expression of TNF-α (C) and IL-1β (D) was detected in normal tissues and, although varied, did not increase significantly in isografted tissues by Student’s t-test at any day post-transplant. Expression for TNF-α and IL-1β did increase coincidentally with the peak of cell-mediated rejection at days 4 and 5 post-transplantation. The data are expressed as a percentage of β-actin gene expression by RT-PCR (n = 4/day ± SEM, performed in duplicate). mRNA expression in normal and isografted organs, - -▴- - ; mRNA expression in allografted tissu1s, - - ▪ - -.
To demonstrate that rat renal epithelial cells respond to IL-2 and IFN-γ by up-regulating transcription of C3, we carried out in vitro stimulation studies using these cytokines, since the mRNA expression data described above implied a temporal relationship with C3 mRNA expression in allografted tissues. The analysis focused on these two cytokines because they were not detected in isografts and presumably in allografted tissues were derived from the population of infiltrating leukocytes. The results of these studies (Figure 5) ▶ showed that IL-2 and IFN-γ up-regulated C3 mRNA expression in rat renal PTEC. IFN-γ stimulation of PTEC increased C3 mRNA expression as early as 6 hours, whereas IL-2 increased C3 mRNA at 24 hours post-stimulation.
Figure 5.

The stimulation of C3 gene expression by PTEC using IL-2 and IFN-γ. Representative PCR bands of β-actin and C3 in cultured rat renal PTEC are shown after stimulation with IL-2 ( ) or IFN-γ (- - ▪ - -) that in transplanted tissues are derived from the infiltrating population of leukocytes. The graph shows the rapid up-regulation of C3 mRNA after IFN-γ stimulation, and the later effect of IL-2 on C3 mRNA expression. The data are expressed as a percentage of β-actin expression (experiments performed in triplicate, mean ± SEM).
Discussion
This study defines the pattern of C3 mRNA expression in experimental renal transplants throughout the period from immediate engraftment to severe (Banff Grade III) allograft rejection, and its relationship with other immunological and nonimmunological factors. We observed increased cortical C3 mRNA expression consistently in two distinct phases: an initial post-ischemic phase and a second, allograft-specific phase occurring at the height of graft infiltration and tubule invasion, and the synthesis of cytokines IFN-γ and IL-2.
The first phase was immediate and corresponded with the period of post-ischemic injury, resulting in mild acute tubular necrosis. The induction of C3, mainly in glomerular and vascular structures during this phase, was probably a manifestation of ischemia/reperfusion injury, since these changes were present in both iso- and allografts. Nagano et al 14 reported the rapid induction of C3 mRNA in a non-transplant model of renal ischemia/reperfusion injury, peaking within the first 24 hours of reperfusion, although that study did not localize C3 mRNA expression. It seems likely, therefore, that glomerular and vascular induction of C3 was a response to ischemia/reperfusion damage in the present experiments. The changes in C3 mRNA expression appeared to resolve over 48 hours in the absence of any antigenic stimulus, ie, in isografted kidneys.
The mechanism of C3 induction in ischemic kidney remains obscure. It is known from several studies that post-ischemic injury induces the expression of a number of molecules with immunological activity, such as IL-2, IFN-γ, TNF-α, and IL-1β, measured here. Such cytokines are capable of up-regulating C3 gene expression in renal cells. However, the time course for the induced or up-regulated expression of these genes in allografted tissues occurred after the initial increase in C3 gene expression in the first 2 days of this study. It is, therefore, likely that the post-ischemic induction of C3 mRNA was independent of the induction of these pro-inflammatory cytokines. The ability of mesangial and glomerular epithelial cells to secrete C3 in culture is well recognized. 22 It remains to be seen if hypoxia (plus or minus reperfusion) itself is able to up-regulate mesangial C3 gene expression.
The second peak of C3 mRNA was restricted to allograft tissue and was partly explained by the influx of leukocytes. Characteristically for this model of acute allograft rejection, the leukocyte infiltrate is composed mainly of macrophages and lymphocytes in approximately equal proportions. 21 Macrophages have been shown to secrete complement products in tissue culture under resting conditions and when activated by a variety of stimuli. 23 The present findings demonstrate that C3 mRNA staining during rejection was partly associated with the cellular infiltrate in allografted organs.
However, the striking finding in the allograft cortex was the inducement of renal epithelial cells to express C3, both in the lining of the Bowman’s capsule and in renal tubule cells during the rapid phase of leukocyte invasion. Brooimans and colleagues previously showed that cultured human PTEC exposed to IL-2 and IFN-γ secrete C3. 13 The present findings confirm these observations in rat PTEC. The kinetic analysis of C3 synthesis in cytokine stimulated PTEC, and of intragraft expression of IL-2 and IFN-γ mRNAs, are consistent with the paracrine induction of C3 gene expression in renal epithelial cells by infiltrating lymphocytes. Presumably parietal epithelial synthesis of C3 in Bowman’s capsule was induced in a similar manner, noting that the cellular infiltrate first appears in a periglomerular distribution, in this model 16 and in human allograft rejection.
The parallels with human allograft rejection are notable. In a cross-sectional analysis, Andrews et al 10,24 reported up-regulation of C3 mRNA in 13 of 15 clinical renal transplant biopsies showing acute cellular rejection. In subsequent analysis, with donors of a different C3 allotype to recipients, donor allotype-specific staining of C3 with monoclonal antibody HAV 4–1 demonstrated C3 protein expression predominantly in tubule epithelial cells, in a basolateral cytoplasmic distribution, with minor staining of glomerular mesangial and capillary cells. Infiltrating cells were only stained with non-allotype-specific anti-C3 sera. The dual origin of C3 (donor and recipient) in both rodent and human renal allografts is thus apparent, with donor epithelium as the predominant source in rejecting grafts.
Together, these data depict a chronological and topographical sequence of intrinsic C3 synthesis in rat and human renal allograft tissue. Immediately post-transplant, mechanisms associated with ischemia/reperfusion injury transiently up-regulate C3 gene expression in glomeruli and vessels. During acute rejection, a more widespread capability to produce C3 occurs, possibly in response to cytokine release, and is associated with graft destruction. It seems likely that local production of C3 in and around the tubules would exacerbate such an inflammatory response. A variety of mechanisms exist whereby the split products C3a and C3b, or subsequently C5a, stimulate inflammatory or immune functions of cells via specific cell surface receptors, or lead to formation of the membrane attack complex with consequent injury to tubule epithelial cells. 25 The relative importance and therapeutic implication of local complement secretion versus leakage of circulating products into damaged tissue remain to be established. We intend to address these questions in the future using C3 gene-disrupted mice in our transplant models.
Figure .

Figure .

Footnotes
Address reprint requests to Dr. Julian R. Pratt, Guy’s Hospital Renal Laboratory, 5th floor, Thomas Guy House, London SE1 9RT UK. E-mail: julian.pratt@kcl.ac.uk.
References
- 1.Erdei A, Fust G, Gergely J: The role of C3 in the immune response. Immunol Today 1991, 12:332-337 [DOI] [PubMed] [Google Scholar]
- 2.Mathew M, Bolton WK: Linear C3 deposits on the tubular basement membrane in renal allograft biopsies. Am J Kidney Dis 1988, 12:121-125 [DOI] [PubMed] [Google Scholar]
- 3.Feucht HE, Schneeberger H, Hillebrand G, Burkhardt K, Weiss M, Reithmuller G, Land W, Albert E: Capillary deposition of C4d complement fragment and early renal graft loss. Kidney Int 1993, 43:1333-1338 [DOI] [PubMed] [Google Scholar]
- 4.Feucht HE, Felber E, Gokel MJ, Hillebrand G, Nattermann U, Brockmeyer C, Held E, Reithmuller G, Land W, Albert E: Vascular deposition of complement-split products in kidney allografts with cell-mediated rejection. Clin Exp Immunol 1991, 86:464-470 [DOI] [PMC free article] [PubMed] [Google Scholar]
- 5.Morgan BP, Gasque P: Extrahepatic complement biosynthesis: where, when and why? Clin Exp Immunol 1997, 107:1-7 [DOI] [PMC free article] [PubMed] [Google Scholar]
- 6.Passwell J, Schreiner GF, Nonaka M, Beuscher HU, Colten HR: Local extrahepatic expression of complement genes C3, factor B, C2, and C4 is increased in murine lupus nephritis. J Clin Invest 1988, 82:1676-1684 [DOI] [PMC free article] [PubMed] [Google Scholar]
- 7.Miyazaki M, Abe K, Koji T, Furusu A, Ozono Y, Harada T, Nakane PK, Yagame M, Endoh M, Nomoto Y, Sakai H: Intraglomerular C3 synthesis in human kidney detected by in situ hybridization. J Am Soc Nephrol 1996, 7:2428-2433 [DOI] [PubMed] [Google Scholar]
- 8.Furusu A, Miyazaki M, Koji T, Abe K, Ozono Y, Harada T, Nakane PK, Hara K, Kohno S: Involvement of IL-4 in human glomerulonephritis: an in situ hybridization study of IL-4 mRNA and IL-4 receptor mRNA. J Am Soc Nephrol 1997, 8:730-741 [DOI] [PubMed] [Google Scholar]
- 9.Sacks SH, Zhou W, Andrews PA, Hartley B: Endogenous complement C3 synthesis in immune complex nephritis. Lancet 1993, 342:1273-1274 [DOI] [PubMed] [Google Scholar]
- 10.Andrews PA, Pani A, Zhou W, Sacks SH: Local transcription of complement C3 in human allograft rejection. Evidence for a pathogenic role and correlation to histology and outcome. Transplantation 1994, 58:637–640 [DOI] [PubMed]
- 11.Andrews PA, Finn JE, Lloyd CM, Zhou W, Mathieson PW, Sacks SH: Expression and tissue localization of donor-specific complement C3 synthesized in human renal allografts. Eur J Immunol 1995, 25:1087-1093 [DOI] [PubMed] [Google Scholar]
- 12.Andrews PA, Zhou W, Sacks SH: Tissue synthesis of complement as an immune regulator. Mol Med Today 1995, 1:202-207 [DOI] [PubMed] [Google Scholar]
- 13.Brooimans RA, Stegmann AP, van Dorp WT, van der Ark AA, van der Woude FJ, van Es LA, Daha MR: Interleukin 2 mediates stimulation of complement C3 biosynthesis in human proximal tubular epithelial cells. J Clin Invest 1991, 88:379-384 [DOI] [PMC free article] [PubMed] [Google Scholar]
- 14.Nagano H, Nadeau KC, Takada M, Kusaka M, Tilney NL: Sequential cellular and molecular kinetics in acutely rejecting renal allografts in rats. Transplantation 1997, 63:1101-1108 [DOI] [PubMed] [Google Scholar]
- 15.Fabre J, Lim SH, Morris PJ: Renal transplantation in the rat: details of a technique. Aust N Z J Surg 1971, 41:69-75 [PubMed] [Google Scholar]
- 16.Pratt JR, Hibbs MJ, Laver AJ, Smith RA, Sacks SH: Effects of complement inhibition with soluble complement receptor-1 on vascular injury and inflammation during renal allograft rejection in the rat. Am J Pathol 1996, 149:2055-2066 [PMC free article] [PubMed] [Google Scholar]
- 17.Solez K, Axelsen RA, Benediktsson H, Burdick JF, Cohen AH, Colvin RB, Croker BP, Droz D, Dunnill MS, Halloran PF: International standardization of criteria for the histologic diagnosis of renal allograft rejection: the Banff working classification of kidney transplant pathology. Kidney Int 1993, 44:411-422 [DOI] [PubMed] [Google Scholar]
- 18.Sasaki O, Zhou W, Miyazaki M, Abe K, Koji T, Verroust P, Tsukasaki S, Ozono Y, Harada T, Nakane PK, Kohno S, Sacks SH: Intraglomerular C3 synthesis in rats with passive Heymann nephritis: Am J Pathol 1997, 151:1249–1256 [PMC free article] [PubMed]
- 19.Chomczynski P, Sacchi N: Single-step method of RNA isolation by acid guanidinium thiocyanate-phenol-chloroform extraction. Anal Biochem 1987, 162:156-159 [DOI] [PubMed] [Google Scholar]
- 20.Zhou W, Campbell RD, Martin J, Sacks SH: Interferon-gamma regulation of C4 gene expression in cultured human glomerular epithelial cells. Eur J Immunol 1993, 23:2477-2481 [DOI] [PubMed] [Google Scholar]
- 21.Pratt JR, Hibbs MJ, Laver AJ, Smith RA, Sacks SH: Allograft immune response with sCR1 intervention. Transplant Immunol 1996, 4:72-75 [DOI] [PubMed] [Google Scholar]
- 22.Sacks SH, Zhou W, Pani A, Campbell RD, Martin J: Complement C3 gene expression and regulation in human glomerular epithelial cells. Immunology 1993, 79:348-354 [PMC free article] [PubMed] [Google Scholar]
- 23.Lappin DF, Birnie GD, Whaley K: Interferon-mediated transcriptional and post-transcriptional modulation of complement gene expression in human monocytes. Eur J Biochem 1990, 194:177-184 [DOI] [PubMed] [Google Scholar]
- 24.Andrews PA, Finn JE, Mathieson PW, Sacks SH: Molecular analysis of C3 allotypes related to transplant outcome in human renal allografts. Transplantation 1995, 60:1342-1346 [PubMed] [Google Scholar]
- 25.Morgan BP: Physiology and pathophysiology of complement: progress and trends. Crit Rev Clin Lab Sci 1995, 32:265-298 [DOI] [PubMed] [Google Scholar]
- 26.Siegling A, Lehmann M, Platzer C, Emmrich F, Volk HD: A novel multispecific competitor fragment for quantitative PCR analysis of cytokine gene expression in rats. J Immunol Methods 1994, 177:23-28 [DOI] [PubMed] [Google Scholar]
- 27.Sheerin NS, Zhou W, Adler S, Sacks SH: TNF-alpha regulation of C3 gene expression and protein biosynthesis in rat glomerular endothelial cells. Kidney Int 1997, 51:703-710 [DOI] [PubMed] [Google Scholar]