

Abstract
Cytochrome c oxidase or complex IV, catalyzes the final step in mitochondrial electron transfer chain, and is regarded as one of the major regulation sites for oxidative phosphorylation. This enzyme is controlled by both nuclear and mitochondrial genomes. Among its 13 subunits, three are encoded by mitochondrial DNA and ten by nuclear DNA. In this work, an RNA interference approach was taken which led to the generation of mouse A9 cell derivatives with suppressed expression of nuclear-encoded subunit IV (COX IV) of this complex. The amounts of this subunit are decrease by 86% to 94% of normal level. A detail biosynthetic and functional analysis of several cell lines with suppressed COX IV expression revealed a loss of assembly of cytochrome c oxidase complex and, correspondingly, a reduction in cytochrome c oxidase-dependent respiration and total respiration. Furthermore, dysfunctional cytochrome c oxidase in the cells leads to a compromised mitochondrial membrane potential, a decreased ATP level, and failure to grow in galactose medium. Interestingly, suppression of COX IV expression also sensitizes the cells to apoptosis. These observations provide the evidence of the essential role of the COX IV subunit for a functional cytochrome c oxidase complex and also demonstrate a tight control of cytochrome c oxidase over oxidative phosphorylation. Finally, our results further shed some insights into the pathogenic mechanism of the diseases caused by dysfunctional cytochrome c oxidase complex.
Keywords: Mitochondria, Cytochrome c oxidase complex, RNA interference, Subunit IV of complex IV, Complex IV assembly, Mitochondrial respiration, Mitochondrial membrane potential, ATP synthesis, Apoptosis
Introduction
Mammalian cytochrome c oxidase (COX) is the terminal complex (complex IV) of the electron transfer chain. It catalyzes the transfer of electrons from ferrocytochrome c to molecular oxygen, converting the latter to water. The protein complex has 13 different subunits with a total molecular weight of 204,000 daltons. The enzyme is active as a dimer. The three biggest subunits, COX I, II and III, encoded by the mitochondrial genome, form the functional core of the enzyme complex [1]. The rest of ten subunits and more than two dozen identified cytochrome c oxidase-specific regulatory genes are all encoded by nuclear genes [2]. However, the function of each subunit, particularly those encoded by the nuclear genome, and the molecular mechanism of the regulation on the activity of this important protein complex are largely unknown.
Cytochrome c oxidase complex has also been suggested as a major regulation site for oxidative phosphorylation [3]. Despite the seemingly large excess of both mitochondrial DNA (mtDNA) and its transcription activity [4], a relative low reserve of cytochrome c oxidase capacity has been reported in a variety of mammalian cell types [5].
Deficiency in the activity of cytochrome c oxidase has been associated with a wide range of human disorders, and is one of the most frequent causes of mitochondrial defects [2]. The clinical phenotypes include stroke, cardioencephalomyopathy, hepatic failure and Leigh’s syndrome [6]. Most of the mutations described so far were heteroplasmic forms in mtDNA encoded subunits and nuclear-encoded cytochrome c oxidase complex assembly factors. Surprisingly mutations in nuclear-encoded subunits have not reported in association with mitochondrial disorders [6].
In the present work, we generated several cell lines with decreased expression of subunits 4 of cytochrome c oxidase complex (COX IV). Blue-native gel analysis on respiratory complexes, determination on respiration and mitochondrial membrane potential, as well as ATP level have shown COX IV is essential for the assembly and function of cytochrome c oxidase complex, probably at the threshold of around 40% of COX IV protein synthesis. Our results also further indicate that cytochrome c oxidase complex exerts a tight control on mitochondrial function.
Materials and methods
Cell lines and media
All the cell lines used in the present work were grown in monolayer culture. The cell line A9 (ATCC CCL-1.4) is a derivative of the L mouse fibroblast cell line [7]. Cells were grown in Dulbecco’s modified Eagle’s medium (DMEM) supplemented with 10% fetal bovine serum (FBS).
Reduced expression of COXIV by RNAi
The short hairpin (sh)RNA oligonucleotides of COX IV were designed according to BD Knockout RNAi System User Manual. A pair of oligonucleotides containing 19-nt sequence starting from nt 320 of COX IV were synthesized as complementary antiparallel oligonucleotides with a loop sequences and Xho1 compatible ends. The oligonucleotides were: ACCTCAGAGCTTCGCCGAGATGAATCAAGAGTTCATCTCGGCGAAGCTCTTTTTTC and GAAAAAAGAGCTTCGCCGAGATGAACTCTTGATTCATCTCGGCGAAGCTCTG. According to the same manual, the oligos were annealed and ligated into a pSIREN-DNR vector. The recombinant pSIREN-DNR-COX IV was transfected to mouse A9 cells with Lipofectamine 2000 (Invitrogen).Transfectants were selected in a medium containing 8 μg/ml puromycin and 5 μg/ml uridine. The suppression of COXIV expression was confirmed by western blot and immunodetection with antibody MS407 (Mitosciences), and antibody against core 2 subunit of complex III, MS304 (Mitosciences) was used as a control. Western blot was preformed according to the protocol provided by the manufacturer.
Mitochondrial protein synthesis
To measure the rate of mitochondrial protein synthesis, pulse-labeling experiments with [35S]methionine were performed according to protocol described previously [8]. Samples of 2×10⁶ cells of the desired type were plated on 10 cm cell culture dishes, incubated overnight, washed with methionine-free DMEM, and then incubated for 7 min at 37 °C in 4 ml of the same medium containing 100 μg/ml of the cytoplasmic translational inhibitor emetine. Thereafter, [35S]methionine [0.2 mCi (1175 Ci/mmol)] was added, and the cells were incubated for 30 min. The labeled cells were lysed and 70 μg of protein were electrophoresed through an SDS-polyacrylamide gel (15-20% exponential gradient).
Blue-Native Gel electrophoresis
Mitochondria protein concentration was measured by Bradford method. Blue-Native PAGE (BN-PAGE) [9, 10] was used for separation of respiratory complexes on 5-13% polyacrylamide gradient gels. 50 μg of mitochondrial proteins were loaded on a minigel of 1.5 0 82 mm (Bio-Rad). The gels were run for 30 min at 40 V and then at 80 V until the dye reached the end of the gel. The protein complexes were detected by in gel staining for cytochrome c oxidase activity, 1.0 mg/mL DAB (3,3′-diaminobenzidine), 24 units/mL catalase, 1 mg/mL cytochrome c, and 75 mg/mL sucrose in 20 mM Tris-HCL was used to incubate the gel for 3 h., and by western blot and immunodetection with antibodies MS304, against complex III core 2 subunit, for complex III and MS404 (Mitosciences), against COX I, for cytochrome c oxidase.
O2 Consumption measurements
The measurements were carried out in two chambers of an YSI Model 5300 Biological Oxygen Monitor. The fresh medium was replaced one day before the measurements. Determination of the O2 consumption rate in intact cells was carried out on ∼5 × 10⁶ cells in Tris-based, Mg2+, Ca2+-deficient (TD) buffer (0.137 M NaCl, 5 mM KCl, 0.7 mM Na2HPO4, 25 mM Tris-HCl, pH 7.4 at 25 °C), as previously described [11]. After recording the basal respiration, 1 μM FCCP was added to measure the maximal respiration. For measurements of cytochrome c oxidase complex-dependent O2 consumption rate in digitonin-permeabilized cells [12], about 5 × 10⁶ cells were resuspended in 1 ml of buffer (20 mM HEPES pH 7.1, 10 mM MgCl2, 250 mM sucrose), and then 100 μg of digitonin (1 μl of a 10% solution in dimethyl sulfoxide) in 1 ml of buffer were added. After incubation for 1 min at room temperature, the cell suspension was diluted with 8 ml of buffer. The cells were rapidly pelleted and resuspended in respiration buffer (20 mm HEPES pH 7.1, 250 mM sucrose, 2 mM KPi, 10 mM MgCl2, and 1.0 mM ADP). The substrates, 5 mM ascorbate and 10 mM N,N,N′,N′-tetramethyl-p-phenylenediamine (TMPD) (adjusted to ∼pH 7.0 with NaOH) were added with Hamilton syringes.
Mitochondrial membrane potential analysis
The measurement was adapted from the method described by Wong and Cotopassi [13]. Cells were washed with phosphate buffered saline (PBS) and then incubated with 50 nM TMRM in the HBSS buffer in 5% CO2/95% air at 37 °C for 10 min. The cells (5 × 10⁵/well) were placed in 48 well and measured and recorded in a Perkin Elmer 1000 multiwell fluorescence plate with temperature maintained at 37 °C at Ext 540 nm and Em 620 nm.
ATP Determination
ATP Determination kit from Invitrogen (A22066) was utilized. Cells were grown in 60 mm dish to about 80% confluent, and then harvested. About 1 106 cells were washed twice with 1 ml of cold PBS, and then resuspended in 1 ml of Boiling Buffer (100 mM Tris, 4 mM EDTA). Those cells were then heated at 100 °C for 5 min, centrifuge at 10,000 g for 1 min. The background luminescence was measured with 100 μl of the standard reaction solution in the luminometer, and the standard curve was also generated. 10 μl of samples to the 100 μl standard reaction solution and the results were recorded. To measure ATP synthesis in presence of oligomycin, cells were incubated with 15 μg/ml oligomycin for 20 min before harvest.
Growth measurements
Multiple identical samples of 2 × 10⁴ were grown for 6 days on 6-well plates in the appropriate medium [DMEM, which contains 4.5 mg/ml glucose and 0.11 mg/ml pyruvate, or DMEM lacking glucose and containing 0.9 mg/ml galactose and 0.5 mg/ml pyruvate [14], both supplemented with 10% dialyzed FBS], and counted on a daily basis.
Apoptosis assay
For the evaluation of apoptosis, cells were grown on the cover glass in 6 well plates and were treated with 500 nM staurosphorine for 6 h prior to analysis. Cells were washed three times with PBS and were fixed with 70% Ethanol. Fixed cells were washed again with PBS and stained with 4,6-diamidino-2-phenylindole (DAPI, 1 μg/ml, Sigma) for 30 min. The number of DAPI stained cells was determined by fluorescence microscopy (Zeiss-Axioplan, Oberkochen, Germany) using a UV filter (365-420 nm). Apoptotic cells were morphologically defined by cytoplasmic and nuclear shrinkage, and by chromatin condensation or fragmentation. Cells for analysis were less than 80% of confluency. To quantify the percentage of apoptotic cells, 4-5 different fields were viewed and at least 1000 cells were observed.
Statistical analysis
P, probability, values were calculated by using the unpaired Student’s t-test contained in the Sigma plot program.
Results
Reduced expression of mouse COX IV by RNAi
To obtain cell lines with decreased of COX IV, we suppressed its expression by introducing a COX IV targeted RNA interference (RNAi) species from the plasmid pSIREN-DNR-COX IV in mouse A9 cells. The RNA species generated form a double strand RNA hairpin homologous to sequences in COX IV. Three independent cell lines expressing pSIRENDNR-COX IV (designated C1, C2 and C3) were established. Immunoblot analysis showed that COX IV protein levels were decreased by 88.8, 94.0, and 79.2% respectively in C1, C2 and C3 cells (Fig. 1A and B). As a control, antibody against core 2 subunit of complex III was also utilized. When presented as normalized by the level of complex III core 2 subunit, the decreases of COX IV were at the level of 86 to 94% (Fig. 1B).
Fig. 1.
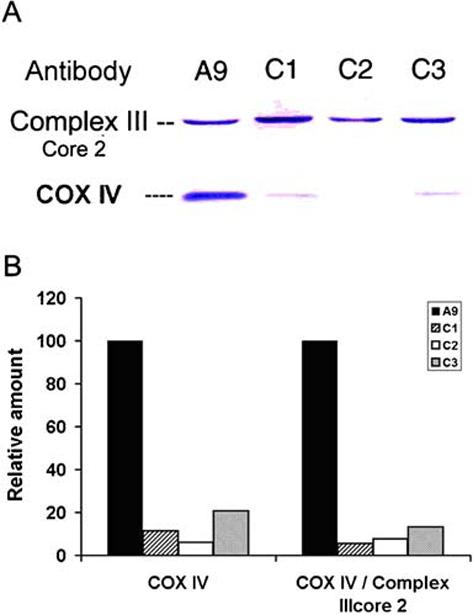
Amount of COX IV in A9, C1, C2 and C3. (A) Total cell lysates from A9, C1, C2 and C3 cells were used for western blotting. Antibodies against COX IV and core 2 subunit of complex III were utilized. Mitochondrial proteins (25 μg) were loaded in each lane. (B) Quantification of relative amounts of COX IV were determined by comparing the intensity of COX IV bands and further normalized by the intensity of the core 2 subunit of complex III
COX IV is essential for cytochrome c oxidase assembly
To determine if the down-regulation of COX IV have any effects on the expression of other cytochrome c oxidase complex genes, we examined the protein synthesis of its three biggest subunits, COX I, II and III. Mitochondrial protein translation products were labeled with [35S] methionine for 30 min in the presence of emetine, to inhibit cytoplasmic protein synthesis. The individual mitochondrially synthesized peptides were identified previously by comparison of the electrophoretic patterns of the mouse translation products with the pattern of human and rat mitochondrial protein synthesis products [11]. No significant differences were observed between A9 and C1, C2 and C3 cells (Fig. 2A).
Fig. 2.
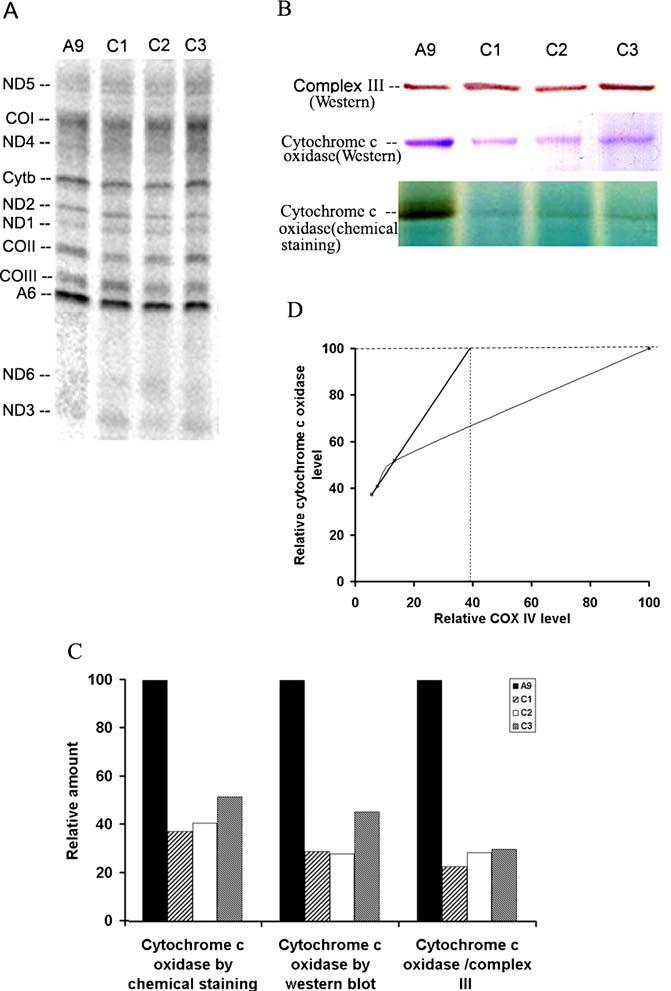
Mitochondrial protein synthesis and cytochrome c oxidase assembly analysis. (A) Electrophoretic patterns of newly synthesized mitochondrial translational products of A9, C1, C2 and C3. ND1, 2, 3, 4, 5, 6: subunits of NADH dehydrogenase 1, 2, 3, 4, 5 and 6; CYT b, apocytochrome b; CO I, II and III: subunits I, II and III of cytochrome c oxidase; A6: subunits 6 of the ATP synthase. (B) Mitochondria were extracted and protein complexes were separated on a 5-13% blue native polyacrylamide gel. Complex III is identified by western blot analysis with an antibody against complex III core 2 protein, and cytochrome c oxidase was identified by both western blot analysis with antibody against COX I and by in-gel activity assay. (C) Quantification of the relative amounts of cytochrome c oxidase complex was determined by comparison of the intensity of the cytochrome c oxidase complex band in in-gel activity assay, western blot and western blot normalized by complex III level. (D) The relationship between COX IV level and cytochrome c oxidase complex amount
In order to verify whether, in the cell lines with reduced expression of COX IV, the assembly of cytochrome c oxidase was affected, blue native gel electrophoresis (BN-PAGE), a useful method for isolating intact membrane-bound protein complexes and for investigating the integrity of mitochondrial respiratory complexes [15], was carried out. Mitochondrial samples electrophoresed using the BN-PAGE system were subjected to immunoblot analysis for complexes III and cytochrome c oxidase, and in-gel activity assays for cytochrome c oxidase (Fig. 2B). The quantified results of the in-gel activity analysis suggested the cytochrome c oxidase levels were decreased by 63, 60 and 49 % in C1, C2 and C3 cells respectively (Fig. 2C). More dramatic reduction was recorded when cytochrome c oxidase levels were quantified by the western blot with antibody against COX I and immunoblot analysis of cytochrome c oxidase normalized by the level of complex III (Fig. 2C).
We further plotted the level of cytochrome c oxidase as determined by in-gel activity analysis in blue native gel expressed relative to A9 reference value versus the corresponding level of COX IV determined by western blot normalized by complex III core 2 subunit. It is interesting to note that when COX IV level increased from 6 to 14%, the cytochrome c oxidase activity as revealed by in gel activity assay increased linearly. This result indicates that COX IV is a rate-limiting factor for cytochrome c oxidase assembly when it is below 14% of normal level (Fig. 2D). A threshold of 40% is revealed when we assume the COX IV is still limiting until reach the threshold (Fig. 2D). This means that 40% of the normal level of functional COX IV protein might be adequate to maintain a normal level of cytochrome c oxidase assembly.
Respiration properties in cells with suppressed COX IV expression
To assess the effect of decreased level of cytochrome c oxidase complex due to the suppression of COX IV expression on the function, the respiratory properties of A9, C1, C2 and C3 cells were investigated. In digitonin-permeabilized cells, the TMPD-ascorbate-driven respiration, which reflects the activity of cytochrome c oxidase [16], was first measured. As shown in Fig. 3A, compared with the parental A9 cells, TMPD-ascorbate-dependent respiration was decreased by 43-53% in cells with reduced assembled cytochrome c oxidase. To measure the cytochrome c oxidase activity more accurately, we also determined KCN-sensitive TMPD-ascorbate-dependent respiration, a 50-64% decrease was recorded. We then measured the total respiration in intact cells. We found that basal oxygen consumption in the intact cells of C1-C3 lines was ∼24-29% of the level of control cells (Fig. 3A). In the presence of the chemical uncoupler FCCP, which can completely uncouple mitochondria and raise the respiratory capacity to a maximal level, oxygen consumption in the C1-C3 lines remained ∼22-29% that of control cells (Fig. 3A).
Fig. 3.
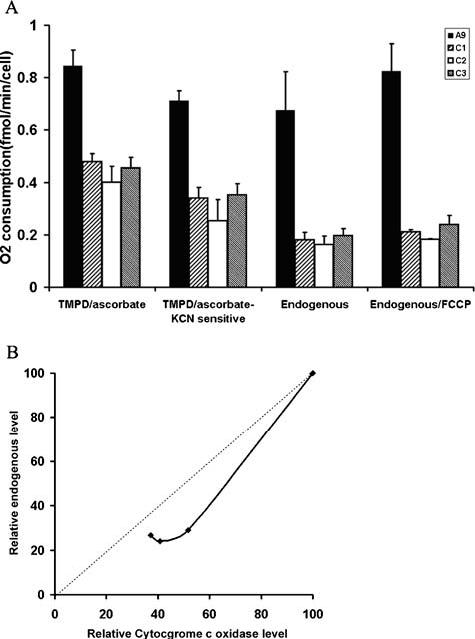
Oxygen consumption measurement. (A) TMPD/ascorbate-dependent respiration in permeablized cells, KCN sensitive TMPD/ascorbate-dependent respiration in permeablized cells determined by addition of 1 mM of KCN, total respiration rate in intact cells, and total respiration in cells treated with uncoupler FCCP were measure with ∼5 × 10⁶ cells. Three measurements were carried out, and the error bars indicate 2 times the standard error of the mean. (B) The relationship between cytochrome c oxidase complex levels as revealed by in-gel assay on blue native gel and total respiration
In order to investigate the control of cytochrome c oxidase complex on overall respiration, the endogenous respiration in intact cells expressed relative to A9 reference value were blotted versus the corresponding cytochrome c oxidase complex level (Fig. 3B). It appears that, with decreasing cytochrome c oxidase complex level, the total respiration decreases nearly in parallel or even more rapidly. This result indicates that there is very little excess of cytochrome c oxidase assembly over that required to maintain a normal rate of respiration.
Oxidative phosphorylation features
Simultaneous with electron transfer along the respiratory chain, protons are pumped out of the inner membrane of mitochondria at complex I, III and IV, generating the mitochondrial membrane potential (MMP) [17]. A proper MMP is essential for ATP production. Cells were labeled with an MMP indicator, TMRM, and were subsequently analyzed [13]. As shown in Fig. 4, the MMP was compromised in the cells with decreased cytochrome c oxidase to the extents of 12-39%.
Fig. 4.
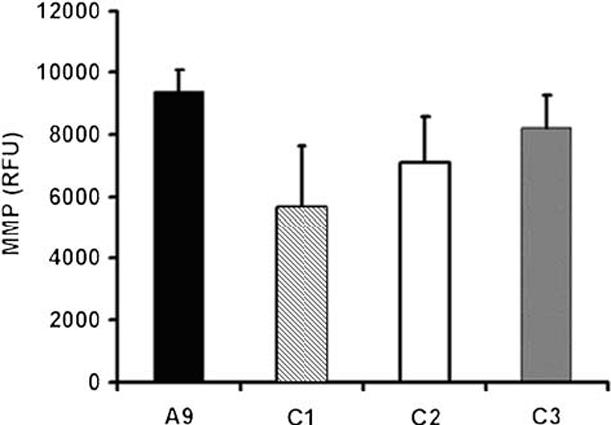
Mitochondrial membrane potential determination. Mitochondrial membrane potential was measured in cells labeled with TMRE. Three measurements were carried out, and the error bars indicate 2 times the standard error of the mean
ATP synthesis was then measured by luminometry in boiled cells. We found that the ATP contents decreased by 38-56% in C1, C2 and C3 cells (Fig. 5A). We further investigated the mitochondrial oxidative phosphorylation contribution on ATP production with the addition of 15 μg/ml of the ATP synthase (complex V) inhibitor, oligomycin. As shown in Fig. 5B, the levels of ATP content were relatively similar between A9 and COX IV suppressed cells, indicating the mitochondrial defects were responsible for the decreases in ATP production in C1, C2 and C3 cells. Interestingly, we did not observe a dramatic up-regulation in glycolytic ATP production in C1, C2 and C3 cells, which would be reflected in the oligomycin resistant ATP measurements. In wild-type A9 cells, about 60% of ATP synthesis was oligomycin sensitive, indicating a primary mitochondrial ATP production. In C1, C2 and C3 cells, however, the glycolytic ATP production is predominant (Fig. 5C).
Fig. 5.
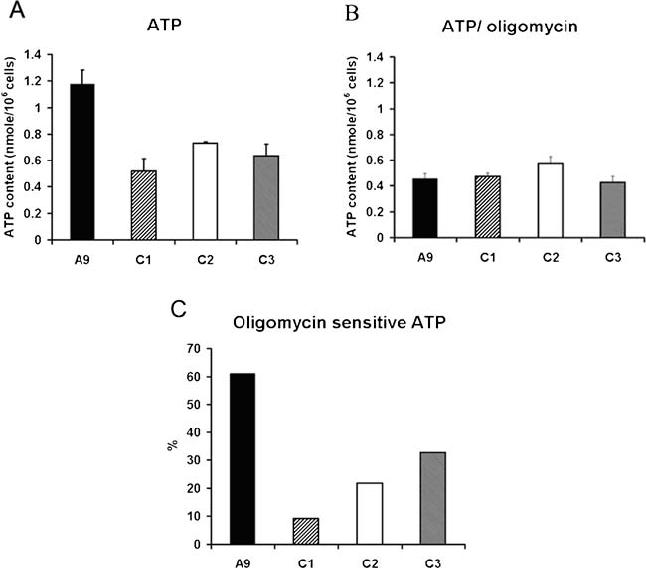
ATP content analysis. (A) The total cellular ATP contents in A9, C1, C2 and C3 cells were measured in ∼1 × 10⁶ cells with a luciferase detection kit. (B) The ATP contents were also determined after cells were incubated with oligomycin, an inhibitor of oxidative phosphorylation, for 20 min at 37 °C at the concentration of 15 μg/ml. In both (A) and (B), three measurements were carried out, and the error bars indicate 2 times the standard error of the mean. (C) The percentages of oligomycin sensitive ATP synthesis were calculated by total and oligomycin-resistant ATP contents
We then analyzed the impact of reduced cytochrome c oxidase activity on cell growth in medium containing galactose instead of glucose. Since galactose is not utilized efficiently by mammalian cells as a glycolytic substrate, cells are forced to rely on mitochondrial oxidative phosphorylation for ATP production [18]. Fig. 6 compares the growth curve in glucose and galactose media of C1, C2 and C3 cells and their parental line A9. It appears that the C1, C2 and C3 cell grow well in glucose medium, at a similar rate as the parental A9 cells (Fig. 6A). By contrast, in galactose medium, C1, C2 and C3 cells failed to grow and died (Fig. 6B), while A9 cells still grew, though at a reduced rate compared with that in glucose medium.
Fig. 6.
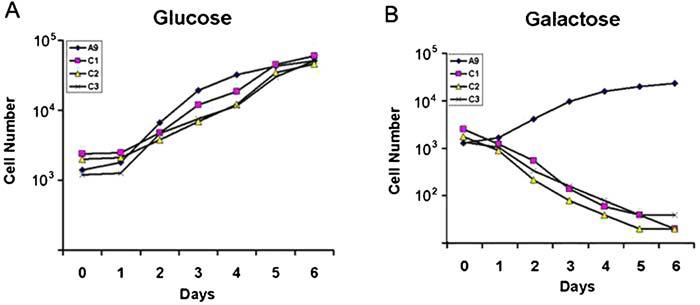
Growth capacity measurement. Growth curves of A9, C1, C2 and C3inglucose (A) and galactose (B) media. Cells were plated on 6-well plates at 2 × 10⁴ per plate and were counted on a daily basis for 6 days
Reduced cytochrome c oxidase activity and apoptosis
Mitochondria play an important role in regulating apoptosis [19]. Mitochondrial dysfunction has been suggested to have a role in degenerative diseases by regulating apoptosis [20] and mtDNA mutations have been shown to sensitize the cells to death signals [21]. We examined if decreased cytochromec oxidase complex activity would modify the cell response to apoptotic signals through intrinsic pathway mediated by mitochondria [22]. To induce cell death, cells were treated with staurosphorine for 6 h. Apoptotic cells were morphologically defined by cytoplasmic and nuclear shrinkage, and by chromatin condensation or fragmentation. As shown in Fig. 7, the number of apoptotic cells increased by 19-70% in cells with suppressed COX IV expression. This result indicates that a defective cytochrome c oxidase complex could sensitize the cells to death signals.
Fig. 7.

Apoptosis assay. A9, C1, C2 and C3 cells incubated for 6 h with 100 nM staurosphorine. The apoptotic cells were defined by cytoplasmic and nuclear shrinkage, and by chromatin condensation or fragmentation. Three measurements were carried out, and the error bars indicate 2 times the standard error of the mean
Discussion
Mutations in three mtDNA-encoded genes, COX I, II and III, have been isolated from patients with various human diseases, and thus provided a chance to study the function of these genes [23-26]. However, paradoxically mutations in the nuclear genes which encoded the other ten subunits have not yet been found [6], which consequently hampered our understanding of these genes. In the present work, introduction of a COX IV targeted RNA interference (RNAi) species to cultured mouse cell line by stable transfection of a corresponding plasmid has led to the isolation of several cell lines with decreased expression of nuclear encoded COX IV to different extents. The powerful RNAi approach exhibits a great potential in investigation of nuclear encoded genes for subunits of mitochondrial respiratory complexes.
Suppression of COX-IV expression and cytochrome c oxidase complex assembly
The success of suppression of COX IV gene was confirmed by an immunoblot experiment. We further examined the levels of newly synthesized mtDNA encoded genes, indicating there is no compensatory up-regulation of expression of mtDNA encoded subunits of cytochrome c oxidase or subunits of other respiratory complexes. The correlation of COX IV amount revealed by western blot and assembled cytochrome c oxidase level displayed by blue native gel indicates COX IV is essential for assembly of cytochrome c oxidase. Further, no sub-complex was detected with antibody against COX I and with in-gel staining, and that suggested that either those subcomplexes are unstable or incorporation of COX IV was among the early steps of cytochrome c oxidase assembly.
The observation that under 14% of wild type COX IV level, the assembled amount of cytochrome c oxidase increased in a linear manner suggested that under such a situation all synthesized COX IV was utilized to assemble the protein complex. If we extend this line, it will cross the wild type level at 40% of control level of COX IV(Fig. 2D). This finding suggests ∼60% of wild type COX IV could be in excess of what is needed for a normal level of cytochrome c oxidase assembly. It is interesting to note that previously D’Aurelio et al found a threshold at ∼40% in human cybrids harboring a non-sense mutation in COX I gene [27].
Control of oxidative phosphorylation by cytochrome c oxidase
As expected, cytochrome c oxidase complex-dependent respiration as measured by oxygen consumption driven by ascorbate/TMPD decreased significantly in cells with suppressed expression of COX IV. To investigate if there is an excess of cytochrome c oxidase complex over what is required for the general oxidative phosphorylation process, we also measured the total respiration in intact cells. Surprisingly, with a decreasing amount of assembled cytochrome c oxidase complex, total respiration decreases in parallel or more rapidly. The maximal respiration capacity as revealed by oxygen consumption in the presence of the chemical uncoupler FCCP also exhibits a tight control by cytochrome c oxidase activity. Previously Villani and Attardi reported that cytochrome c oxidase capacity is in low excess with respect to that required to support the endogenous respiration rate by a KCN titration assay with a variety of human cells [5]. Thus one of the implications of this study is cytochrome c oxidase might be the rate-limiting step of overall respiration in mammalian cells and could also serve as the regulation site for oxidative phosphorylation [28].
Implications for pathogenesis of mitochondrial disease with defective cytochrome c oxidase activity
Cytochrome c oxidase deficiency is one of the most frequent causes of respiratory defects in humans [2], and also associated with aging and aging-related degenerative diseases [29-32]. Most of isolated cytochrome c oxidase complex deficiency is inherited as autosomal recessive disorders, but mutations in nuclear-encoded cytochrome c oxidase subunits have not been found in association with these phenotypes [6]. We provide evidence here that abnormal expression of nuclear-encoded subunit of cytochrome c oxidase complex will lead to similar oxidative phosphorylation defects as observed in cells carrying mtDNA encoded mutations.
Another feature associated with cytochrome c oxidase deficiency is the heterogeneous clinical phenotypes [2]. We found that besides its tight control over the respiration, reduced cytochrome c oxidase complex activity also compromises mitochondrial membrane potential, which, in turn leads to abnormal ATP production, and could also have a consequence in mitochondrial calcium uptake and regulation of reactive oxygen species, two very important cell signals [33]. The interesting finding that suppression of cytochrome c oxidase activity also sensitizes cells to death signals could shed some insights to the role of defective cytochrome c oxidase in aging and age-related neurodegenerative diseases.
Acknowledgments
This work was supported by grants from NIA/NIH (1 R01 AG025223-01) and from the American Heart Association (0430303-AHA). Yidong Bai is a New Scholar in Aging of the Ellison Medical Foundation. Xiufeng Song did some initial studies on this project. We thank Peiqing Hu for excellent technical assistance and Dr. Lily Dong for help with RNAi experiments.
Bibliography
- 1.Capaldi RA. Annu Rev Biochem. 1990;59:569–596. doi: 10.1146/annurev.bi.59.070190.003033. [DOI] [PubMed] [Google Scholar]
- 2.Barrientos A, Barros MH, Valnot I, Rotig A, Rustin P, Tzagoloff A. Gene. 2002;286:53–63. doi: 10.1016/s0378-1119(01)00803-4. [DOI] [PubMed] [Google Scholar]
- 3.Kadenbach B, Huttemann M, Arnold S, Lee I, Bender E. Free Radic Biol Med. 2000;29:211–221. doi: 10.1016/s0891-5849(00)00305-1. [DOI] [PubMed] [Google Scholar]
- 4.Attardi G, Schatz G. Annu Rev Cell Biol. 1988;4:289–333. doi: 10.1146/annurev.cb.04.110188.001445. [DOI] [PubMed] [Google Scholar]
- 5.Villani G, Greco M, Papa S, Attardi G. J Biol Chem. 1998;273:31829–31836. doi: 10.1074/jbc.273.48.31829. [DOI] [PubMed] [Google Scholar]
- 6.Shoubridge EA. Am J Med Genet. 2001;106:46–52. doi: 10.1002/ajmg.1378. [DOI] [PubMed] [Google Scholar]
- 7.Littlefield JW. Proc Natl Acad Sci USA. 1963;50:568–573. doi: 10.1073/pnas.50.3.568. [DOI] [PMC free article] [PubMed] [Google Scholar]
- 8.Chomyn A. Methods Enzymol. 1996;264:197–211. doi: 10.1016/s0076-6879(96)64020-8. [DOI] [PubMed] [Google Scholar]
- 9.Nijtmans LG, Henderson NS, Holt IJ. Methods. 2002;26:327–334. doi: 10.1016/S1046-2023(02)00038-5. [DOI] [PubMed] [Google Scholar]
- 10.Schagger H. Methods Enzymol. 1996;264:555–566. doi: 10.1016/s0076-6879(96)64048-8. [DOI] [PubMed] [Google Scholar]
- 11.Bai Y, Attardi G. Embo J. 1998;17:4848–4858. doi: 10.1093/emboj/17.16.4848. [DOI] [PMC free article] [PubMed] [Google Scholar]
- 12.Hofhaus G, Shakeley RM, Attardi G. Methods Enzymol. 1996;264:476–483. doi: 10.1016/s0076-6879(96)64043-9. [DOI] [PubMed] [Google Scholar]
- 13.Wong A, Cortopassi GA. Biochem Biophys Res Commun. 2002;298:750–754. doi: 10.1016/s0006-291x(02)02546-9. [DOI] [PubMed] [Google Scholar]
- 14.Hayashi J, Ohta S, Kikuchi A, Takemitsu M, Goto Y, Nonaka I. Proc Natl Acad Sci USA. 1991;88:10614–10618. doi: 10.1073/pnas.88.23.10614. [DOI] [PMC free article] [PubMed] [Google Scholar]
- 15.Schagger H. Methods Enzymol. 1995;260:190–202. doi: 10.1016/0076-6879(95)60137-6. [DOI] [PubMed] [Google Scholar]
- 16.Bai Y, Hu P, Park JS, Deng JH, Song X, Chomyn A, Yagi T, Attardi G. Ann N Y Acad Sci. 2004;1011:272–283. doi: 10.1007/978-3-662-41088-2_26. [DOI] [PubMed] [Google Scholar]
- 17.Chen LB. Annu Rev Cell Biol. 1988;4:155–181. doi: 10.1146/annurev.cb.04.110188.001103. [DOI] [PubMed] [Google Scholar]
- 18.Robinson BH. Methods Enzymol. 1996;264:454–464. doi: 10.1016/s0076-6879(96)64041-5. [DOI] [PubMed] [Google Scholar]
- 19.Kroemer G. Biochem Biophys Res Commun. 2003;304:433–435. doi: 10.1016/s0006-291x(03)00614-4. [DOI] [PubMed] [Google Scholar]
- 20.Polster BM, Fiskum G. J Neurochem. 2004;90:1281–1289. doi: 10.1111/j.1471-4159.2004.02572.x. [DOI] [PubMed] [Google Scholar]
- 21.Danielson SR, Wong A, Carelli V, Martinuzzi A, Schapira AH, Cortopassi GA. J Biol Chem. 2002;277:5810–5815. doi: 10.1074/jbc.M110119200. [DOI] [PubMed] [Google Scholar]
- 22.Wang X. Genes Dev. 2001;15:2922–2933. [PubMed] [Google Scholar]
- 23.Bruno C, Martinuzzi A, Tang Y, Andreu AL, Pallotti F, Bonilla E, Shanske S, Fu J, Sue CM, Angelini C, DiMauro S, Manfredi G. Am J Hum Genet. 1999;65:611–620. doi: 10.1086/302546. [DOI] [PMC free article] [PubMed] [Google Scholar]
- 24.Clark KM, Taylor RW, Johnson MA, Chinnery PF, Chrzanowska-Lightowlers ZM, Andrews RM, Nelson IP, Wood NW, Lamont PJ, Hanna MG, Lightowlers RN, Turnbull DM. Am J Hum Genet. 1999;64:1330–1339. doi: 10.1086/302361. [DOI] [PMC free article] [PubMed] [Google Scholar]
- 25.Rahman S, Taanman JW, Cooper JM, Nelson I, Hargreaves I, Meunier B, Hanna MG, Garcia JJ, Capaldi RA, Lake BD, Leonard JV, Schapira AH. Am J Hum Genet. 1999;65:1030–1039. doi: 10.1086/302590. [DOI] [PMC free article] [PubMed] [Google Scholar]
- 26.Tiranti V, Corona P, Greco M, Taanman JW, Carrara F, Lamantea E, Nijtmans L, Uziel G, Zeviani M. Hum Mol Genet. 2000;9:2733–2742. doi: 10.1093/hmg/9.18.2733. [DOI] [PubMed] [Google Scholar]
- 27.D’Aurelio M, Pallotti F, Barrientos A, Gajewski CD, Kwong JQ, Bruno C, Beal MF, Manfredi G. J Biol Chem. 2001;276:46925–46932. doi: 10.1074/jbc.M106429200. [DOI] [PubMed] [Google Scholar]
- 28.Ludwig B, Bender E, Arnold S, Huttemann M, Lee I, Kadenbach B. Chembiochem. 2001;2:392–403. doi: 10.1002/1439-7633(20010601)2:6<392::AID-CBIC392>3.0.CO;2-N. [DOI] [PubMed] [Google Scholar]
- 29.Lenaz G, D’Aurelio M, Merlo Pich M, Genova ML, Ventura B, Bovina C, Formiggini G, Parenti Castelli G. Biochim Biophys Acta. 2000;1459:397–404. doi: 10.1016/s0005-2728(00)00177-8. [DOI] [PubMed] [Google Scholar]
- 30.Ferguson M, Mockett RJ, Shen Y, Orr WC, Sohal RS. Biochem J. 2005;390:501–511. doi: 10.1042/BJ20042130. [DOI] [PMC free article] [PubMed] [Google Scholar]
- 31.Navarro A, Sanchez Del Pino MJ, Gomez C, Peralta JL, Boveris A. Am J Physiol Regul Integr Comp Physiol. 2002;282:R985–992. doi: 10.1152/ajpregu.00537.2001. [DOI] [PubMed] [Google Scholar]
- 32.Sullivan PG, Brown MR. Prog Neuropsychopharmacol Biol Psychiatry. 2005;29:407–410. doi: 10.1016/j.pnpbp.2004.12.007. [DOI] [PubMed] [Google Scholar]
- 33.Nicholls DG. Aging Cell. 2004;3:35–40. doi: 10.1111/j.1474-9728.2003.00079.x. [DOI] [PubMed] [Google Scholar]