Abstract
The B cell antigen receptor (BCR) is a large complex that consists of a disulfide-linked tetramer of two transmembrane heavy (μ) chains and two light (λ or κ) chains in association with a heterodimer of Igα and Igβ. Kaposi's sarcoma–associated herpesvirus (KSHV) encodes a transforming protein called K1, which has structural and functional similarity to Igα and Igβ. We demonstrate that K1 downregulates the expression of BCR complexes on the surface. The NH2-terminal region of K1 specifically interacts with the μ chains of BCR complexes, and this interaction retains BCR complexes in the endoplasmic reticulum, preventing their intracellular transport to the cell surface. Thus, KSHV K1 resembles Igα and Igβ in its ability to induce signaling and to interact with μ chains of the BCR. However, unlike Igα and Igβ, which interact with μ chains to direct BCR complexes to the cell surface, K1 interacts with μ chains to block the intracellular transport of BCR complexes to the cell surface. These results demonstrate a unique feature of the K1 transforming protein, which may confer virus-infected cells with a long-term survival advantage.
Keywords: Kaposi's sarcoma–associated herpesvirus, K1, B cell antigen receptor, downregulation, intracellular transport
Introduction
During biosynthesis, transmembrane proteins are translocated into the endoplasmic reticulum (ER) lumen and become anchored in the membrane. In the case of multiprotein complexes, all components should assemble before transport via the Golgi complex to the cell surface can occur. As an important step in quality control, incorrectly assembled protein complexes or assembly intermediates are retained in the ER, ensuring that only functional proteins become expressed on the cell surface 1 2.
The B cell antigen receptor (BCR) consists of a disulfide-linked tetramer of two transmembrane mIg heavy (μ) chains in covalent association with two light (λ or κ) chains 3 4. In addition, the BCR complex contains a disulfide-linked heterodimer formed by Igα and Igβ, which serves to direct the receptor complexes to the cell surface and to provide receptor signaling capacity 5 6. Analysis of sequence elements responsible for the signaling properties of the transducing subunits of BCR has led to the identification of the immunoreceptor tyrosine-based activation motif (ITAM [5]). This motif consists of six conserved amino acid residues spaced precisely over an ∼26 amino acid sequence, D/Ex7D/Ex2YxxLx7YxxL/I, and a single copy of this motif is present in the cytoplasmic region of Igα and Igβ 5. Because the Igα and Igβ heterodimer is essential for the signaling capacity of the receptor, it is essential that only fully assembled BCR complexes appear on the cell surface. Therefore, the expression levels of the individual components as well as assembly of oligomers and transport through intracellular compartments are subject to various intracellular control mechanisms.
Association of the Igα and Igβ heterodimer is essential for intracellular transport and plasma membrane deposition of newly synthesized mIg molecules. The site of intracellular retention of mIg in absence of this heterodimer is the ER. This retention has been found to be dictated by two regions of the μ chain of mIg, the transmembrane region and the first constant region. The transmembrane region of the μ chain controls its interaction with the ER chaperone calnexin 7, whereas the first constant domain of the μ chain is important for association with the ER-resident Ig heavy chain binding protein 8. These interactions of the μ chain with the ER-resident proteins have been shown to be an important control mechanism for surface expression of the BCR complexes 7 9.
A new human tumor virus, called Kaposi's sarcoma–associated herpesvirus (KSHV) or human herpesvirus 8 (HHV8), has been consistently identified in Kaposi's sarcoma tumors from HIV-positive and HIV-negative patients 10 11 12. KSHV has also been identified in primary effusion lymphoma (PEL) and immunoblast variant of Castleman's disease, which are of B cell origin 10 11 13. The genomic sequence indicates KSHV to be a γ herpesvirus that is closely related to herpesvirus saimiri 14 15 and the recently isolated rhesus monkey rhadinovirus 16 17 18.
KSHV contains the first open reading frame called K1 19. K1 gene is expressed at low levels in PEL, and its expression is significantly induced during the lytic viral life cycle 20. The K1 protein is predicted to have a signal peptide sequence at the NH2 terminus, an extracellular domain, a transmembrane domain, and a short cytoplasmic tail at the COOH terminus 19 20 21 22. The predicted extracellular domain of the K1 protein demonstrates a regional homology in the primary amino acid sequence with the variable region of the λ chain of the Ig light chain 19 21. In addition, similar to Igα and Igβ, the cytoplasmic region of K1 contains a functional ITAM that is capable of transducing signals to elicit cellular activation events 23 24.
In this report, we demonstrate that the NH2-terminal region of K1 specifically interacts with the μ chains of BCR complexes, and that this interaction inhibits their intracellular transport, resulting in downregulation of BCR surface expression.
Materials and Methods
Cell Culture and Transfection.
BJAB cells were grown in RPMI medium supplemented with 10% FCS, and 293T cells were grown in DME medium supplemented with 10% FCS. A fusin lipofection (Boehringer) transfection procedure was used for transient expression in 293T cells. The pBabe-K1 and pcDNA-K1/CD8 chimera constructs (20 μg) were introduced into BJAB cells by electroporation at 250 V and 960 μF in serum-free DME medium. After a 48-h incubation, the cells were cultured with selection medium containing 5 μg/ml of puromycin or 2 mg/ml of G418 (GIBCO BRL) for 5 wk.
Plasmid Constructions.
The AU1-tagged K1 and its mutant genes were cloned into the EcoRI and SalI cloning sites of pBabe-puro retroviral vector. The flag-tagged and myc-tagged K1 genes have been described previously 19 24. pEF-μ expression vector was constructed using the human μ cDNA provided by Dr. P. Leder (Harvard Medical School, Boston, MA) and Dr. M.C. Nussenzweig (The Rockefeller University, New York, NY). The extracellular and/or transmembrane regions of the human CD8α were amplified by PCR and replaced with those of the K1. For stable expression, the EcoRI and XhoI DNA fragment containing the K1/CD8 chimera sequence was cloned into pcDNA3-Neo (Invitrogen). A new pDEF3–glutathione S-transferase (GST)-AU1 fusion plasmid was constructed to contain the CMV early promoter and multicloning sites linked to the GST gene, which is tagged with an AU1 epitope at its COOH terminus. To construct the K1/GST fusion expression construct, the NH2-terminal region of K1 was PCR amplified and fused in frame into the pDEF3-GST-AU1 vector. All PCR-amplified DNA fragments were completely sequenced to verify the presence of the correct sequence and the absence of any other changes.
Metabolic Labeling, Immunoprecipitation, and Immunoblot.
For metabolic labeling, cells were rinsed three times with PBS, washed once with labeling medium (RPMI minus methionine and cysteine plus 10% dialyzed FCS), and then incubated with 5 ml of the same medium containing 100 μCi of [35S]methionine and [35S]cysteine (NEN Life Science Products) for 16 h. For pulse-chase analysis, cells were labeled for 30 min and chased for 1, 3, or 4 h. Cells were harvested and lysed with lysis buffer (0.15 M NaCl, 1% NP-40 or 1% digitonin, and 50 mM Hepes buffer, pH 8.0) containing 1 mM Na2VO3, 1 mM NaF, and protease inhibitors (leupeptin, aprotinin, PMSF, and bestatin). Immunoprecipitation was performed with 1:500 diluted antibody together with 30 μl of protein A/G agarose beads. Endoglycosidase H (Endo H) digestion was performed for 2 h with washed immunoprecipitates as recommended by the manufacturer's protocol (Boehringer). For protein immunoblots, polypeptides in cell lysates corresponding to 105 cells were resolved by SDS-PAGE and transferred to a nitrocellulose membrane filter. Immunoblot detection was performed with a 1:1,000 or 1:3,000 dilution of primary antibody using the enhanced chemiluminescence system (Amersham Pharmacia Biotech). Mouse anti-AU1 ascites were purchased from BABCO.
Immunofluorescence and Confocal Microscopy.
Slides for cells grown in suspension were prepared by cytospin centrifugation. After air drying, cells were fixed with cold acetone for 15 min and blocked with 10% goat serum in PBS for 30 min. Cells were stained with 1:100 diluted primary antibody in PBS containing 1% gelatin for 30 min. After incubation, cells were washed extensively with PBS and incubated with 1,100 diluted Alexa 568–conjugated secondary antibody (Vector Laboratories) and Alexa 488–conjugated Con A for ER-specific staining (Molecular Probes) in PBS containing 1% gelatin for 30 min at room temperature. For Golgi compartment staining, cells were metabolically labeled with 5 μg/ml boron dipyrromethane (BODIPY) C5FL-ceramide for 30 min as recommended by the manufacturer's protocol (Molecular Probes). Finally, cells were washed three times with PBS and mounted in mounting media (Vector Laboratories). Confocal microscopy was performed using a Leica TCS-SP laser scanning microscope fitted with a 100× Leica objective (Planapochromatic; 1.4 numerical aperture), and using the Leica image software. Images were collected at 512 × 512 pixel resolution. The stained cells were optically sectioned in the z-axis, and the images in the different channels (photomultiplier tubes) were collected simultaneously. The step size in the z-axis varied from 0.2–0.5 μm to obtain 30–50 slices per image filed. The images were transferred to a Macintosh G3 computer (Apple Computer, Inc.), and National Institutes of Health Image v1.61 software was used to render the images.
Flow Cytometry Analysis.
5 × 10⁵ cells were washed with RPMI medium containing 10% FCS, and were incubated with FITC-conjugated or PE-conjugated mAbs for 30 min at 4°C. After washing, each sample was fixed with 2% paraformaldehyde solution, and flow cytometry analysis was performed with a FACScan™ (Becton Dickinson). W6/32 antibody for MHC class I, TU39 antibody for HLA-DR, RPA-T8 antibody for CD8, B43 antibody for CD19, HIB22 antibody for CD22, CB3.1 antibody for Igβ, and goat anti–mouse total IgG antibody for isotype control used for FACS® and confocal immunofluorescence analyses were obtained from Becton Dickinson and BD PharMingen. Goat anti–human IgM and rabbit anti–goat antibody were purchased from Southern Biotechnology Associates, Inc.
Results
Downregulation of Surface Expression of BCR Complexes by K1.
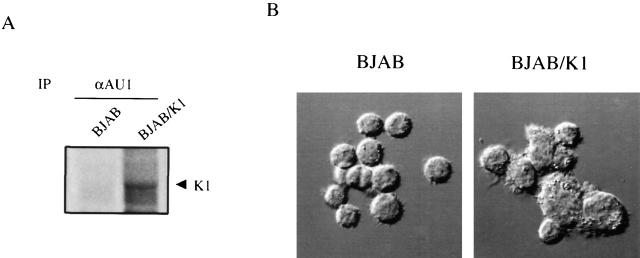
To investigate K1 function in lymphocyte signaling, EBV- and KSHV-negative BJAB cells were used to establish a stable cell line expressing the K1 gene in the absence of the remainder of KSHV viral genome. The full-length K1 gene was modified to encode an AU1 epitope tag at the COOH terminus, and was cloned into the retroviral vector pBabe-puro. After electroporation of this retroviral vector into BJAB cells, control BJAB/babe and BJAB/K1 cell lines were selected by growth in medium containing 5 μg/ml of puromycin. To demonstrate expression of the K1 gene in puromycin-resistant cells, radioactively labeled cell lysates were used for immunoprecipitation with an anti-AU1 antibody. A 55-kD K1 was detected only from BJAB cells containing the K1 gene (Fig. 1 A). As shown in fibroblast cells 19, the expression of K1 also resulted in morphological changes of BJAB cells; BJAB/K1 cells were irregularly shaped and had a rough surface, whereas control BJAB cells were roundly shaped and had a smooth surface (Fig. 1 B).
Figure 1.
Expression of K1 and morphological change induced by K1 expression. (A) K1 expression. Radioactively labeled lysates of BJAB/babe and BJAB/K1 cells were used for immunoprecipitation (IP) with an anti-AU1 (αAU1) antibody. Autoradiography was detected after 2 d of exposure. Arrow indicates K1 protein. (B) Morphological change induced by K1. Differential interference contrast image obtained with a Leica TCS-SP laser scanning microscope. Original magnification: ×400.
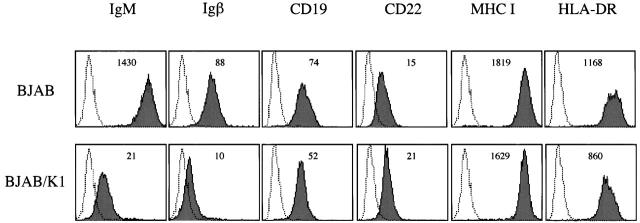
When surface expression of lymphocyte antigen was examined, a dramatic reduction in the surface expression of IgM and Igβ was observed in BJAB/K1 compared with control BJAB/babe cells (Fig. 2). In contrast, CD11a, CD18, CD19, CD21, CD22, CD29, CD30, CD40, CD50, CD54, B7-1, B7-2, MHC class I, and HLA-DR did not show detectable changes in their surface expression under the same conditions (Fig. 2; data not shown). Three independently constructed BJAB/K1 cell lines showed the same results (data not shown). These results demonstrate that the expression of K1 in BJAB cells downregulates surface expression of BCR components IgM and Igβ in a specific manner.
Figure 2.
Downregulation of IgM and Igβ surface expression in BJAB/K1 cells. Live BJAB/babe (BJAB) and BJAB/K1 cells were stained for the surface expression of lymphocyte antigens as described in Materials and Methods. 2 × 10⁵ events were collected on a FACScan™ flow cytometer (Becton Dickinson). As a control, a histogram of each lymphocyte antigen staining (shaded) is overlaid with a dotted-line histogram of isotype antibody control. The mean value of the relative level of surface expression of each lymphocyte antigen is presented inside of the figure. The data were reproduced in three independent experiments.
The NH2-terminal Region of K1 Is Required for BCR Downregulation.
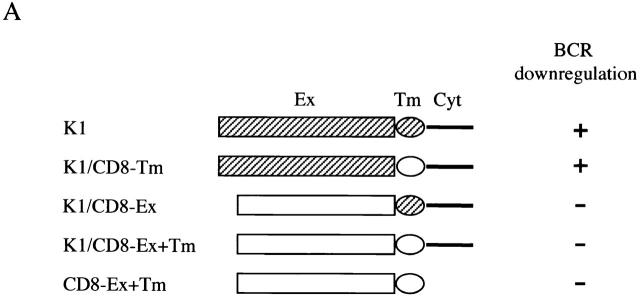
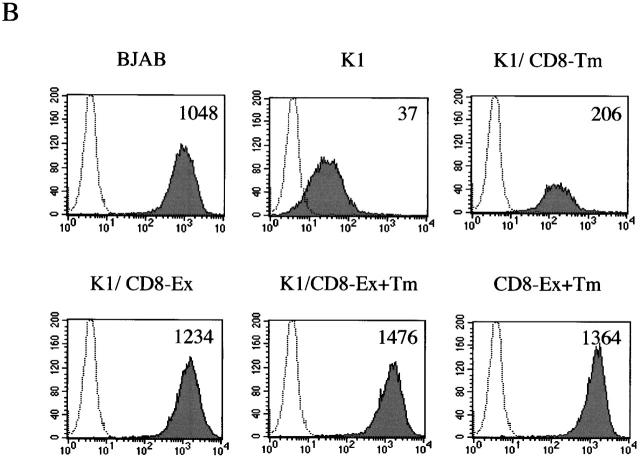
To identify the region of K1 that accounted for downregulation of BCR surface expression, BJAB cells containing a chimeric protein between K1 and human CD8α were established by electroporation with an expression vector. In the chimera K1/CD8-Ex, the extracellular region of K1 was replaced with that of CD8α; in the chimera K1/CD8-Tm, the transmembrane region of K1 was replaced with that of CD8α; and in the chimera K1/CD8-Ex+Tm, the extracellular and transmembrane regions of K1 were replaced with those of CD8α (Fig. 3). In addition, CD8-Ex+Tm containing its extracellular and transmembrane region was included as a control (Fig. 3). Comparable levels of CD8 surface expression of transfected cells were detected (data not shown). However, upon expression of CD8-Ex+Tm, K1/CD8-Ex, and K1/CD8-Ex+Tm chimeras, BCR did not undergo appreciable levels of downregulation (Fig. 3). In contrast, K1/CD8-Tm expression induced significant levels of BCR downregulation, as was seen with a wild-type K1 (Fig. 3).
Figure 3.
The NH2-terminal region of K1 is required for downregulation of BCR surface expression. (A) Summary of BCR downregulation by K1/CD8 chimeras. K1 and CD8α are indicated by hatched and open boxes, respectively. Ex, extracellular region; Tm, transmembrane; Cyt, cytoplasmic region. (B) IgM surface expression. Live BJAB, BJAB/K1, BJAB/K1/CD8-Ex+Tm, BJAB/K1/CD8-Ex, BJAB/K1/CD8-Tm, and BJAB/CD8-Ex+Tm cells were stained for the surface expression of IgM as described in Materials and Methods. As a control, a histogram of each cell line (shaded) is overlaid with a dotted-line histogram of an anti–mouse total IgG antibody as isotype control. The mean value of the relative level of IgM surface expression is presented inside of the figure. The data were reproduced in three independent experiments. Ex, extracellular region; Tm, transmembrane.
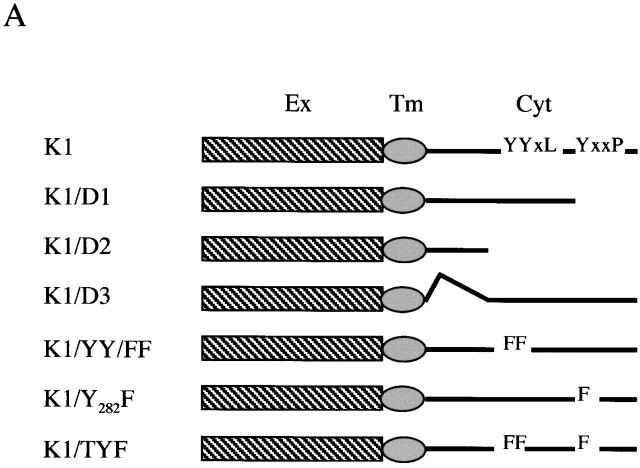
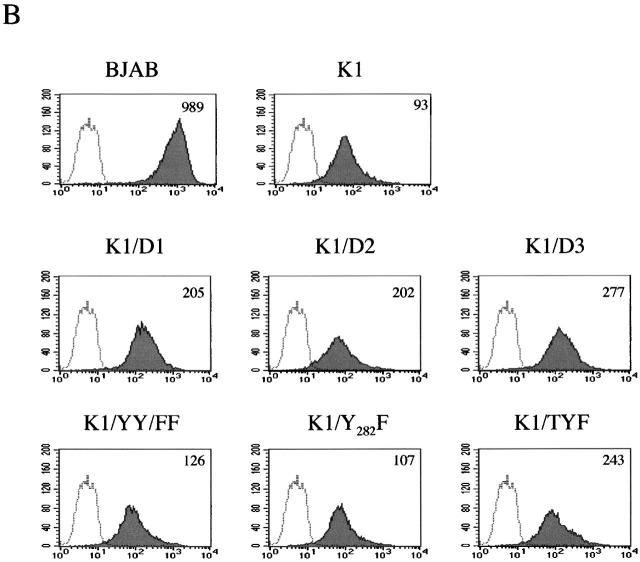
To further examine whether the COOH-terminal ITAM sequence of K1 contributed to the downregulation of BCR surface expression, the tyrosine residues at positions 271, 272, and/or 282 were replaced with phenylalanines, called K1/YY/FF, K1/Y282F, and K1/TYF (reference 23; Fig. 4). In addition, deletion mutations were introduced into the cytoplasmic region of K1, resulting in the K1/D1, K1/D2, and K1/D3 constructs (Fig. 4). As described previously 23, K1/D1 contains the negatively charged conserved region with a proximal YXXL motif, K1/D2 contains only the negatively charged conserved region, and K1/D3 contains both YXXL/P motifs without the negatively charged conserved region. After electroporation of retroviral vectors containing these mutants, BJAB cells were selected by growth in medium containing 5 μg/ml of puromycin, and were examined for their IgM surface expression by flow cytometry. Similar to wild-type K1, all these K1 mutants induced drastic downregulation of BCR surface expression (Fig. 4). These results demonstrate that the NH2-terminal region of K1, but not the transmembrane and COOH-terminal regions, is necessary for the downregulation of BCR surface expression.
Figure 4.
The COOH-terminal ITAM of K1 is not required for downregulation of BCR surface expression. (A) Summary of the carboxyl ITAM mutants of K1. Ex, extracellular region; Tm, transmembrane; Cyt, cytoplasmic region; Y, tyrosine; F, phenylalanine; L, leucine; P, proline. (B) IgM surface expression. Live BJAB, BJAB/K1, BJAB/K1/D1, BJAB/K1/D2, BJAB/K1/D3, BJAB/K1/YY/FF, BJAB/K1/Y282F, and BJAB/K1/TYF cells were stained for the surface expression of IgM as described in Materials and Methods. As a control, a histogram of each cell line (shaded) is overlaid with a dotted-line histogram of an anti–mouse total IgG antibody as isotype control. The mean value of the relative level of IgM surface expression is presented inside of the figure. The data were reproduced in two independent experiments.
The Retention of BCR Components in the ER of Cells Expressing K1.
We investigated whether K1 expression also affected intracellular localization of BCR components. BJAB and BJAB/K1 cells were stained with antibodies specific for Igα, Igβ, or μ chains, followed by reaction with Alexa 568–conjugated secondary antibody (red). Confocal microscopy of the immunostained cells showed that the localization of μ chains was significantly affected by K1 expression. μ chains were primarily localized in the plasma membrane in control BJAB cells (Fig. 5 A). In contrast, they were predominantly localized at the perinuclear region in BJAB/K1 cells (Fig. 5 A). Because this perinuclear staining pattern is similar to that obtained when the ER is visualized, we further defined the localization of μ chains, using Alexa 488–conjugated (green) Con A for ER-specific staining or BODIPY C5FL-ceramide for Golgi compartment–specific staining. Confocal microscopy showed that μ chains in K1-expressing cells were primarily localized in the ER but not in the Golgi compartment (Fig. 5 A). When an anticalnexin antibody for ER localization 7 and an anti–Golgi compartment 58K antibody for Golgi compartment localization 25 were used for immunofluorescence tests, essentially the same results were obtained (Fig. 6). Similar to μ chains, Igα and Igβ were predominantly localized in the ER in BJAB/K1 cells, whereas they were present in both the plasma membrane and the ER in BJAB cells (Fig. 5b and Fig. c). In addition, confocal microscopy with several different antibodies showed a lower level of Igβ detection in BJAB/K1 cells than in BJAB cells (Fig. 5 C). These results demonstrated that K1 expression led to the retention of BCR subunits in the ER.
Figure 5.
Altered localization of BCR complexes in K1-expressing cells. BJAB/babe (BJAB) cells and BJAB/K1 cells were fixed and labeled with (A) anti-μ, (B) anti-Igα, or (C) anti-Igβ antibody. The μ, Igα, and Igβ proteins were detected with a secondary antibody conjugated with Alexa 568 (red). The ER and Golgi compartment were detected with Alexa 488–conjugated Con A (green) and BODIPY C5FL-ceramide (green), respectively. Yellow color indicates colocalization of the red and green labels. The data were reproduced in three independent experiments.
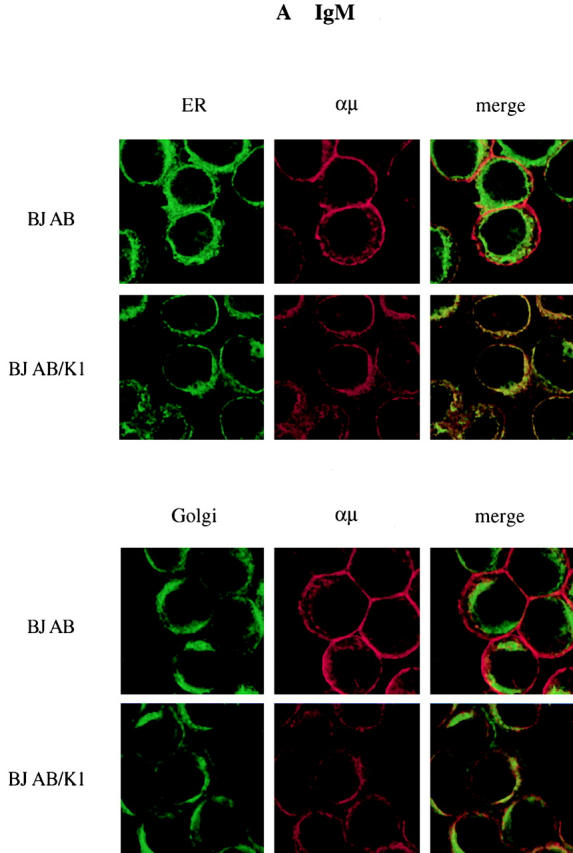
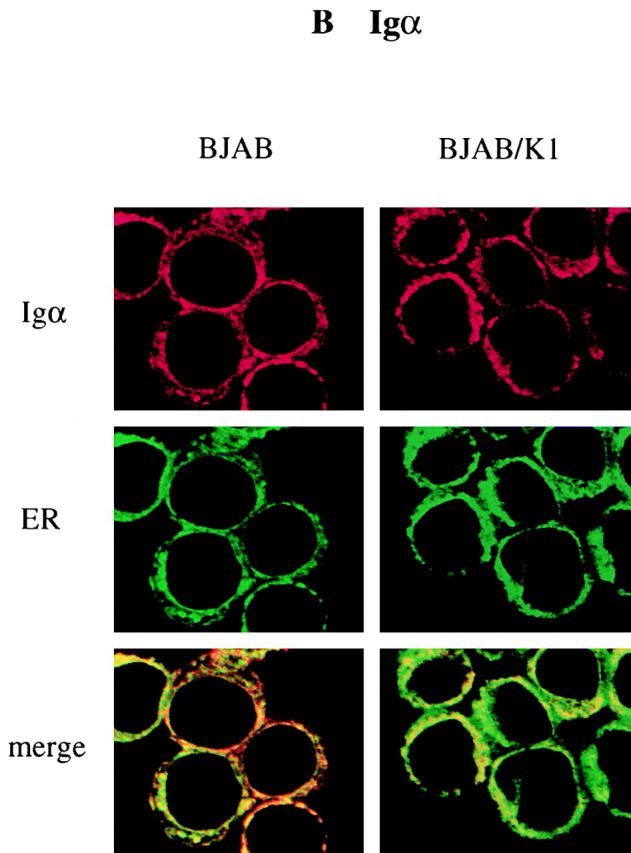
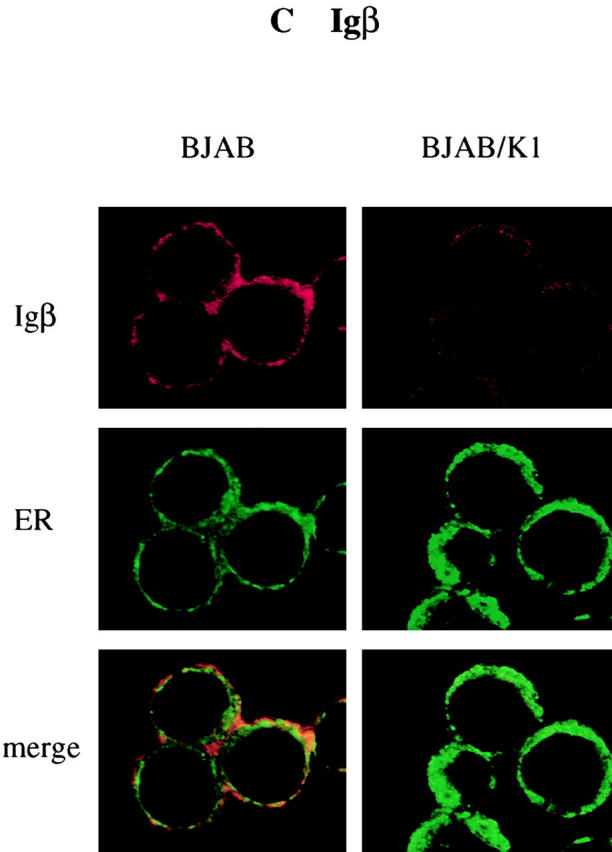
Figure 6.
Localization of IgM. BJAB/babe (BJAB) cells and BJAB/K1 cells were fixed and colabeled with anti-μ antibody (αμ) together with anticalnexin (αcalnexin) or anti–Golgi compartment 58K (αGolgi 58K) antibody. The μ chain was detected with a secondary antibody conjugated with Alexa 568 (red). Calnexin for ER localization and 58K for Golgi compartment localization were detected with a secondary antibody conjugated with Alexa 488 (green). Yellow color at merged images indicates colocalization of the red and green labels. The data were reproduced in two independent experiments.
Maturation and Assembly of BCR Components.
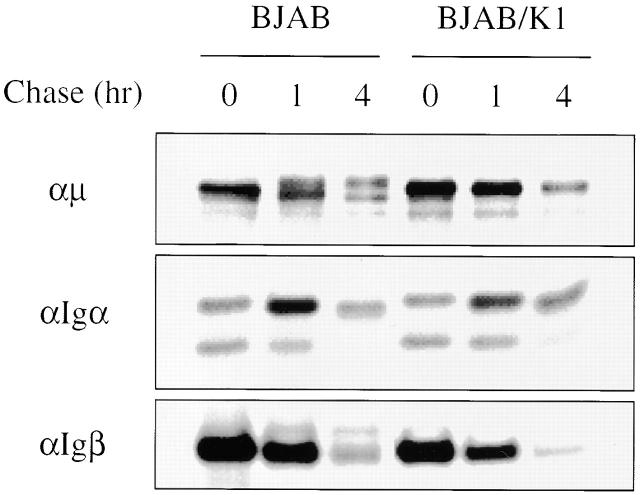
ER-localized glycoproteins bear immature N-linked glycans, which mature during intracellular transport to the medial-Golgi compartment 26. To investigate the maturation of BCR components, BJAB and BJAB/K1 cells were metabolically labeled with [35S]methionine and [35S]cysteine for 30 min, chased for 1 and 4 h, and lysed by 1% NP-40 detergent. Individual BCR components, Igα, Igβ, and μ chains, were precipitated with their specific antibodies. In addition to a 70-kD μ chain protein, a 72-kD mature form of μ chain was detected during a chase period in BJAB cells but not in BJAB/K1 cells, indicating that the μ chains of BCR underwent maturation in BJAB cells but not in BJAB/K1 cells (Fig. 7). Igα has been shown to migrate with an apparent molecular weight of 37, 40, and 43 kD 27. Unlike μ chains, no specific change of Igα and Igβ maturation was detected in K1-expressing cells (Fig. 7). These results demonstrated that K1 expression specifically blocked the maturation of the μ chains of BCR subunits.
Figure 7.
Maturation of BCR components. BJAB/babe (BJAB) and BJAB/K1 cells were metabolically labeled with [35S]methionine and [35S]cysteine for 30 min and chased for 1 and 4 h. Cells were lysed with 1% NP-40 buffer, and radioactively labeled lysates of BJAB/babe cells and BJAB/K1 cells were used for immunoprecipitation with an anti-μ, anti-Igα, or anti-Igβ antibody. Only the part of the gel displaying the μ chain, Igα, or Igβ is shown. The data were reproduced in three independent experiments.
To investigate the effect of K1 on BCR assembly, BJAB and BJAB/K1 cells were metabolically labeled with [35S]methionine and [35S]cysteine for 30 min, chased for 1 and 3 h, and lysed by 1% digitonin detergent to preserve assembled BCR complexes. Assembled BCR complexes were then precipitated with antibody specific to Igα, Igβ, or μ chain. Similar amounts of Igα, Igβ, or μ chain were detected in each immune complex of BJAB and BJAB/K1 cells, suggesting that K1 did not significantly affect BCR assembly (Fig. 8). However, consistent with immunoprecipitation in NP-40 lysis buffer (Fig. 7), a maturation of μ chains was not detected in K1-expressing cells, whereas it was evident in control BJAB/babe cells (Fig. 8 B). These results indicated that although K1 did not affect the level of BCR assembly and expression, it specifically inhibited maturation of μ chains by retaining BCR complexes in the ER.
Figure 8.

Assembly and Endo H sensitivity of BCR complexes. (A) Endo H sensitivity of μ chains. BJAB/babe (BJAB) and BJAB/K1 cells were metabolically labeled with [35S]methionine and [35S]cysteine for 30 min and chased for 1 and 4 h. Cells were lysed with 1% digitonin lysis buffer, and radioactively labeled lysates were used for immunoprecipitation with an anti-μ. μ chain immunoprecipitates were untreated (−) or treated (+) with Endo H before SDS-PAGE. Only the part of the gel displaying the μ chains is shown. The asterisk indicates the Endo H–sensitive forms of μ chains. (B) Assembly of BCR and Endo H sensitivity of Igα and Igβ. BJAB and BJAB/K1 cells were metabolically labeled with [35S]methionine and [35S]cysteine for 30 min and chased for 1 and 3 h. Cells were lysed with 1% digitonin lysis buffer, and radioactively labeled lysates were used for immunoprecipitation with an anti-Igα or anti-Igβ antibody. Anti-Igα or anti-Igβ immunoprecipitates were untreated (−) or treated (+) with Endo H before SDS-PAGE. Asterisks indicate the Endo H–sensitive forms of μ, Igα, and Igβ. The data were reproduced in three independent experiments.
Endo H Sensitivity of BCR Components.
Carbohydrate moieties of BCR complexes contain high mannose-type oligosaccharides in the ER that are susceptible to Endo H digestion. However, after transport to the medial-Golgi compartment, their carbohydrate moieties acquire resistance to cleavage by Endo H 28. To further investigate the effect of K1 on the intracellular transport of BCR complexes, BJAB control cells and BJAB/K1 cells were metabolically labeled with [35S]methionine and [35S]cysteine for 30 min and chased for 1, 3, or 4 h. BCR components, μ chains, Igα, and Igβ, were precipitated with their specific antibodies. Half of immune precipitates were subjected to Endo H digestion and separated by SDS-PAGE. As shown in Fig. 8, μ chains remained Endo H sensitive in BJAB/K1 cells, whereas they acquired resistance to Endo H cleavage in BJAB cells. In contrast, Igα and Igβ underwent Endo H digestion in both cells (Fig. 8 B). As all three species of Igα were sensitive to Endo H digestion, it also suggested that maturation of Igα may be different from that of μ chains. In summary, these results further confirmed that K1 retained BCR complexes in the ER.
ER Localization of K1.
To investigate the role of K1 in the ER retention of BCR complexes, we examined the subcellular localization of K1 by indirect immunofluorescence and confocal microscopy. BJAB cells were transfected with an expression vector containing the epitope-tagged K1 gene, the flag-K1 containing a flag epitope at the NH2 terminus 24, or the K1-myc containing a myc epitope at the COOH terminus 19. An expression vector containing the human CD4 gene was included as a control. 2 d after transfection, cells were stained with anti-flag, anti-myc, or anti-CD4 antibody, followed by an Alexa 568–conjugated secondary antibody (red). In addition, Alexa 488–conjugated (green) Con A was used for ER-specific staining, and BODIPY C5FL-ceramide was used for Golgi compartment–specific staining. The confocal microscopy analysis showed that the K1 protein was predominantly localized in the ER, not in the Golgi compartment, whereas ∼10–20% of the K1 protein was detected in plasma membrane (Fig. 9). In striking contrast, >80% of CD4 was detected in the plasma membrane under the same conditions (data not shown). These results demonstrate that K1 is primarily localized in the ER, and only a portion of K1 is translocated into the plasma membrane.
Figure 9.
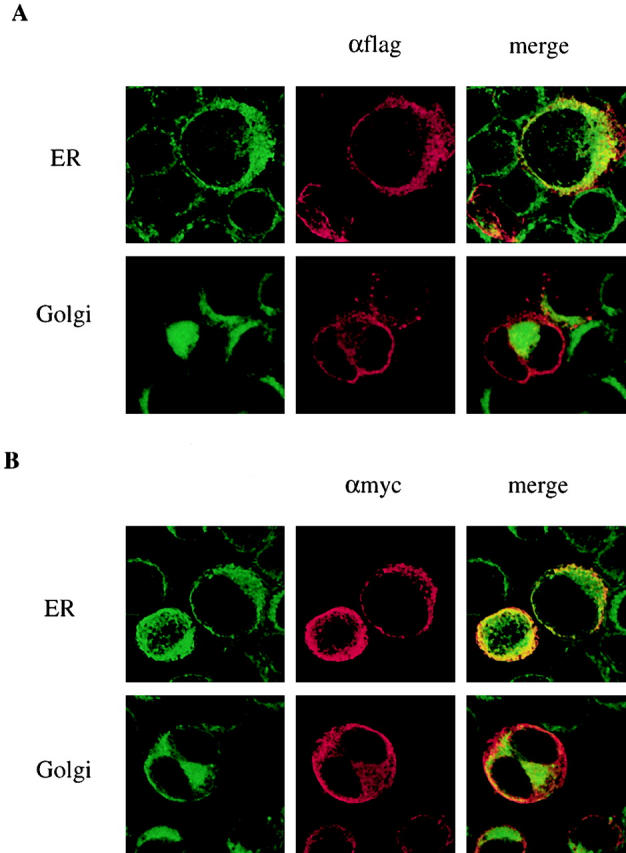
K1 localization. Expression vector containing (A) the flag-K1 or (B) the K1-myc was electroporated into BJAB cells. After 48 h, cells were fixed and reacted with mouse monoclonal anti-flag antibody (A) or anti-myc antibody (B). K1 protein was detected with anti–mouse secondary antibody conjugated with Alexa 568 (red). The ER and Golgi compartment were detected with Alexa 488–conjugated Con A (green) and BODIPY C5FL-ceramide (green), respectively. Localization of fluorescently labeled antibodies was visualized with a Leica TCS-SP laser scanning microscope. Yellow color indicates colocalization of the red and green labels. The data were reproduced in two independent experiments.
Interaction of the NH2-terminal Region of K1 with the μ Chains.
Because K1 downregulates BCR in a specific manner, is primarily localized in the ER, and its NH2-terminal region is necessary for BCR downregulation, we hypothesized that the NH2-terminal region of K1 interacted with BCR components and that this interaction led to their retention in the ER. To test this hypothesis, BJAB cells were transfected with expression vector containing a full-length flag-tagged K1 gene. 48 h after transfection, cells were lysed by 1% NP-40 detergent, followed by immunoprecipitation with an anti-flag antibody. Polypeptides present in anti-flag immune complexes were separated by SDS-PAGE, transferred to nitrocellulose, and reacted with an antibody specific for μ chains, Igα or Igβ. These experiments showed that μ chains were readily detected in K1 immune complexes, whereas Igα and Igβ were not detected at appreciable levels (Fig. 10 A; data not shown). We further investigated whether K1 was capable of interacting with the μ chains in the absence of other BCR subunits. To test this, the flag-tagged K1 and the μ expression vectors were transfected into the human 293 epithelial cell line. Immune complexes of an anti-flag antibody or anti-μ antibody were immunoblotted with anti-μ antibody and anti-flag antibodies. These experiments demonstrated that K1 was capable of interacting with the μ chains in the absence of other BCR subunits (Fig. 10 B).
Figure 10.
Interaction of K1 with μ chains of BCR. (A) Interaction of K1 protein with μ chains in BJAB cells. BJAB cells were transfected with pDEF3 vector or pDEF3 vector containing the flag-tagged K1. Cell lysates were used for precipitation (IP) with an anti-flag antibody, followed by an immunoblot (IB) with an anti-μ antibody. Whole cell lysates (WCL) of transfected cells were included as controls. Arrow indicates the μ chain. (B) Interaction of K1 protein with μ chains in the absence of other BCR components. 293 cells were transfected with expression vector containing the flag-tagged K1 and/or expression vector containing human μ chain cDNA as indicated at the bottom of the figure. Cell lysates were used for precipitation (IP) with an anti-flag antibody or anti-μ antibody, followed by an immunoblot (IB) with anti-flag and anti-μ chain antibodies. Whole cell lysates (WCL) of transfected cells were included as controls. Arrow indicates the μ chain and the flag-tagged K1, and the asterisk indicates the heavy chain of antibody. All data were reproduced in at least two independent experiments.
To further demonstrate the interaction of the NH2-terminal region of K1 with μ chains, we constructed a K1/GST-AU1 fusion mammalian expression plasmid in which the NH2-terminal region of K1 containing seven potential N-glycosylation sites was fused in frame into GST-AU1. After transfection of a K1/GST-AU1 expression vector into BJAB cells, glycosylated K1/GST-AU1 fusion complexes were purified from cell lysates by glutathione affinity chromatography and separated by SDS-PAGE, followed by immunoblot analysis with an antibody specific for a μ chain. These experiments showed that K1/GST-AU1 interacted with μ chains, whereas GST-AU1 did not (Fig. 11). This result indicates that the NH2-terminal region of K1 specifically interacts with μ chains of BCR complexes, and that this interaction is likely responsible for the ER retention of BCR complexes.
Figure 11.
Interaction of the NH2-terminal region of K1 with μ chains. BJAB cells were transfected with expression vector containing GST or K1/GST. Cell lysates were used for pull-down assay with glutathione beads, followed by an immunoblot (IB) with an anti-μ chain antibody (left). Whole cell lysates (WCL) of transfected cells were included as controls. The expression level of GST-AU1 and K1/GST-AU1 in GST pull-down complexes was demonstrated by immunoblot with an anti-AU1 antibody (right). Arrows indicate the μ chain, GST-AU1, and K1/GST-AU1 protein. The data were reproduced in two independent experiments.
Discussion
We and others have previously demonstrated the signal transducing and transforming ability of K1 19 23 24. In this report, we further demonstrate that K1 expression specifically induces downregulation of BCR surface expression. The interaction of the NH2-terminal region of K1 with the μ chains of BCR complexes likely retains these complexes in the ER, resulting in downregulation of their surface expression. These results indicate that a KSHV K1 transforming protein is capable of eliciting cellular signal transduction as well as of inhibiting intracellular transport of BCR. Both activities of K1 may be necessary to provide an advantageous environment for virus-infected cells in vivo.
Association of newly synthesized μ chain of BCR molecules with Igα and Igβ is essential for their intracellular transport and plasma membrane deposition 3 4. The predicted size and structure of the K1 has a significant resemblance to those of a single-domain Ig superfamily receptor 19 20 21 22. In addition, similar to Igα and Igβ, the cytoplasmic region of K1 contains a functional ITAM sequence that is capable of transducing signals to elicit cellular activation events 23 24. In this report, we further demonstrate that, similar to Igα and Igβ, the NH2-terminal region of K1 interacts with μ chains of BCR. Thus, KSHV K1 mimics Igα and Igβ in its ability to elicit signaling and to interact with μ chains of BCR. However, unlike Igα and Igβ, which interact with μ chains to direct the BCR complexes to the cell surface, K1 inhibits the intracellular transport of BCR complexes to the cell surface. Mutational analysis showed that although the K1/CD8-Tm chimera and K1 mutants dramatically downregulated BCR, their level of downregulation was slightly lower compared with wild-type K1. This may be because in the K1/CD8 chimera and K1 mutants the NH2-terminal region of K1 is not properly exposed to interact with the μ chains. Nonetheless, our study provides evidence for a functional role of the NH2-terminal region of K1 in recruitment of μ chains of BCR.
Similar to Ig, the NH2-terminal region of K1 contains conserved hypervariable and Ig homologous domains. Based on the predicted sequence, K1 is expected to be primarily present in the plasma membrane. However, to our surprise, most K1 was localized in the ER. Some of these distinctive domains at the NH2-terminal region of K1 may contribute to the ER localization and to the interaction with μ chains of BCR. Further detailed study is needed to define the specific region of K1 required for these activities.
The downregulation of MHC class I and II molecules in virus-infected or transformed cells is a well-established phenomenon and often involves attenuation of transcription of the genes encoding the class I subunits 29. In addition, a postranslational mechanism of downregulation has been described and includes the production of proteins that mediate retention of newly synthesized class I molecules in the ER 29. Adenovirus E3 19K, human CMV US3, and mouse CMV m152 retain MHC class I heavy chain in the ER, preventing the maturation and intracellular transport of heavy chains to the cell surface 30 31 32 33. This activity has been shown to be mediated by interaction of these viral glycoproteins with the class I heavy chain. In a similar way, an interaction of K1 with μ (heavy) chains retains BCR complexes in the ER, preventing the maturation and intracellular transport of BCR to the cell surface. In addition, several ER-resident proteins including calnexin, calreticulin, and Ig heavy chain binding protein have been shown to be important for the assembly and intracellular transport of multimeric protein complexes, including BCR 7 8 34 35. Interaction of K1 with μ chains may affect activity of these ER-resident chaperons, which leads to accumulation of the BCR complexes in the ER. An investigation of the detailed molecular mechanisms of the ER retention of BCR by K1 is currently underway.
What are the advantages of BCR downregulation to the virus? BCR downregulation has already been demonstrated in several human cancers. For example, >80% of the cases of B cell chronic lymphocytic leukemia, the most common hematologic malignancy in adulthood, and a large number of AIDS-associated B cell lymphomas and mediastinal large B cell lymphomas have been shown to have dramatically decreased levels of BCR surface expression or diminished protein tyrosine kinase activity associated with BCR 36 37 38 39 40. In fact, KSHV-infected PEL cells that are of B cell origin have no detectable level of surface expression of BCR 41. These alterations have been shown to lead to nonresponsiveness to BCR signaling 42. Because engagement of the BCR initiates multiple intracellular signals that often lead to apoptosis, an inhibition of BCR-mediated signaling by the downregulation of its surface expression or reduction of BCR-associated protein tyrosine kinase activity may provide a long-term survival advantage in vivo. EBV latent membrane protein 2A (LMP2A) and KSHV K15 have also been shown to downregulate BCR function, but in a different way from K1 43 44 45. The NH2-terminal ITAM of LMP2A and the COOH-terminal signaling modules of K15 interact with the B cell tyrosine kinases lyn and syk, and this interaction negatively modulates BCR signal transduction 43 44 45 46. In addition, a recent study with transgenic mice has demonstrated that LMP2A provides a constitutive survival signaling activity in primary B cells of transgenic mice 47. Thus, we hypothesize that the KSHV K1 may allow cell growth transformation to proceed by eliciting signals through its ITAM sequence, while at the same time preventing potential adverse effects that may be associated with apoptosis or untimely viral replication. In parallel with this hypothesis, K1 gene is expressed at low levels of latently infected PEL, whereas its expression is significantly induced during viral lytic life cycle 20. Thus, a detailed study of alterations of cellular signal transduction and intracellular transport by KSHV K1 will not only lead to a better understanding of viral persistence and pathogenesis, but will also provide a novel means for investigating cellular regulatory systems.
Acknowledgments
We especially thank Drs. D. Ganem, M. Lagunoff, J. Cambier, P. Leder, and M.C. Nussenzweig for providing reagents. We also thank Drs. B. Means and L. Alexander for critical reading, Kristen Toohey for photography support, Bunny Roy for manuscript preparation, and Maryann DeMaria for flow cytometry analysis.
This work was supported in part by US Public Health Service grants CA31363, CA82057, CA86841, AI38131, and RR00168, and by American Cancer Society grant RPG001102. J.U. Jung is the Leukemia & Lymphoma Society Scholar.
Footnotes
Abbreviations used in this paper: BCR, B cell antigen receptor; ER, endoplasmic reticulum; GST, glutathione S-transferase; ITAM, immunoreceptor tyrosine-based activation motif; KSHV, Kaposi's sarcoma–associated herpesvirus; LMP2A, latent membrane protein 2A; PEL, primary effusion lymphoma.
References
- Rothman J.E. Polypeptide chain binding proteinscatalysts of protein folding and related processes in cells. Cell. 1989;59:591–601. doi: 10.1016/0092-8674(89)90005-6. [DOI] [PubMed] [Google Scholar]
- Pelham H.R. Speculations on the functions of the major heat shock and glucose-regulated proteins. Cell. 1986;46:959–961. doi: 10.1016/0092-8674(86)90693-8. [DOI] [PubMed] [Google Scholar]
- DeFranco A.L. Structure and function of the B cell antigen receptor. Annu. Rev. Cell Biol. 1993;9:377–410. doi: 10.1146/annurev.cb.09.110193.002113. [DOI] [PubMed] [Google Scholar]
- Reth M. Antigen receptors on B lymphocytes. Annu. Rev. Immunol. 1992;10:97–121. doi: 10.1146/annurev.iy.10.040192.000525. [DOI] [PubMed] [Google Scholar]
- Cambier J.C. Antigen and Fc receptor signaling. The awesome power of the immunoreceptor tyrosine-based activation motif (ITAM) J. Immunol. 1995;155:3281–3285. [PubMed] [Google Scholar]
- Reth M. Antigen receptor tail clue. Nature. 1989;338:383–384. doi: 10.1038/338383b0. [DOI] [PubMed] [Google Scholar]
- Grupp S.A., Mitchell R.N., Schreiber K.L., McKean D.J., Abbas A.K. Molecular mechanisms that control expression of the B lymphocyte antigen receptor complex. J. Exp. Med. 1995;181:161–168. doi: 10.1084/jem.181.1.161. [DOI] [PMC free article] [PubMed] [Google Scholar]
- Haas I.G., Wabl M. Immunoglobulin heavy chain binding protein. Nature. 1983;306:387–389. doi: 10.1038/306387a0. [DOI] [PubMed] [Google Scholar]
- Williams G.T., Venkitaraman A.R., Gilmore D.J., Neuberger M.S. The sequence of the μ transmembrane segment determines the tissue specificity of the transport of immunoglobulin M to the cell surface. J. Exp. Med. 1990;171:947–952. doi: 10.1084/jem.171.3.947. [DOI] [PMC free article] [PubMed] [Google Scholar]
- Cesarman E., Chang Y., Moore P.S., Said J.W., Knowles D.M. Kaposi's sarcoma-associated Herpesvirus-like DNA sequences in AIDS-related body-cavity-based lymphomas. N. Engl. J. Med. 1995;332:1186–1191. doi: 10.1056/NEJM199505043321802. [DOI] [PubMed] [Google Scholar]
- Chang Y., Cesarman E., Pessin M.S., Lee F., Culpepper J., Knowles D.M., Moore P.S. Identification of herpesvirus-like DNA sequences in AIDS-associated Kaposi's sarcoma. Science. 1994;266:1865–1869. doi: 10.1126/science.7997879. [DOI] [PubMed] [Google Scholar]
- Mesri E.A., Cesarman E., Arvanitakis L., Rafii S., Moore M.A.S., Posnett D.N., Knowles D.M., Asch A.S. Human herpesvirus-8/Kaposi's sarcoma–associated herpesvirus is a new transmissible virus that infects B cells. J. Exp. Med. 1996;183:2385–2389. doi: 10.1084/jem.183.5.2385. [DOI] [PMC free article] [PubMed] [Google Scholar]
- Renne R., Zhong W., Herndier B., McGrath M., Abbey N., Ganem D. Lytic growth of Kaposi's sarcoma-associate herpesvirus (human herpesvirus 8) in culture. Nat. Med. 1996;2:342–346. doi: 10.1038/nm0396-342. [DOI] [PubMed] [Google Scholar]
- Russo J.J., Bohenzxy R.A., Chien M.-C., Chen J., Yan M., Maddalena D., Parry J.P., Peruzzi D., Edelman I.S., Chang Y., Moore P.S. Nucleotide sequence of the Kaposi's sarcoma-associated herpesvirus (HHV8) Proc. Natl. Acad. Sci. USA. 1996;93:14862–14867. doi: 10.1073/pnas.93.25.14862. [DOI] [PMC free article] [PubMed] [Google Scholar]
- Neipel F., Albrecht J.-C., Fleckenstein B. Cell-homologous genes in the Kaposi's sarcoma-associated rhadinovirus human herpesvirus 8determinants of its pathogenicity. J. Virol. 1997;71:4187–4192. doi: 10.1128/jvi.71.6.4187-4192.1997. [DOI] [PMC free article] [PubMed] [Google Scholar]
- Desrosiers R.C., Sasseville V.G., Czajak S.C., Zhang X., Mansfield K.G., Kaur A., Johnson R.P., Lackner A.A., Jung J.U. A herpesvirus of rhesus monkeys related to the human Kaposi's sarcoma-associated herpesvirus. J. Virol. 1997;71:9764–9769. doi: 10.1128/jvi.71.12.9764-9769.1997. [DOI] [PMC free article] [PubMed] [Google Scholar]
- Rose T.M., Strand K.B., Schultz E.R., Schaefer G., Rankin G.W., Jr., Thouless M.E., Tsai C.C., Bosch M.L. Identification of two homologs of the Kaposi's sarcoma-associated herpesvirus (human herpesvirus 8) in retroperitoneal fibromatosis of different macaque species. J. Virol. 1997;71:4138–4144. doi: 10.1128/jvi.71.5.4138-4144.1997. [DOI] [PMC free article] [PubMed] [Google Scholar]
- Searles R.P., Bergquam E.P., Axthelm M.K., Wong S.W. Sequence and genomic analysis of a Rhesus macaque rhadinovirus with similarity to Kaposi's sarcoma-associated herpesvirus/human herpesvirus 8. J. Virol. 1999;73:3040–3053. doi: 10.1128/jvi.73.4.3040-3053.1999. [DOI] [PMC free article] [PubMed] [Google Scholar]
- Lee H., Veazey R., Williams K., Li M., Guo J., Neipel F., Fleckenstein B., Lackner A.A., Desrosiers R.C., Jung J.U. Deregulation of cell growth by the K1 gene of Kaposi's sarcoma-associated herpesvirus. Nat. Med. 1998;4:435–440. doi: 10.1038/nm0498-435. [DOI] [PubMed] [Google Scholar]
- Lagunoff M., Ganem D. The structure and coding organization of the genomic termini of Kaposi's sarcoma-associated herpesvirus. Virology. 1997;236:147–154. doi: 10.1006/viro.1997.8713. [DOI] [PubMed] [Google Scholar]
- Zong J.C., Ciufo D.M., Alcendor D.J., Wan X., Nicholas J., Browning P.J., Rady P.L., Tyring S.K., Orenstein J.M., Rabkin C.S. High-level variability in the ORF-K1 membrane protein gene at the left end of the Kaposi's sarcoma-associated herpesvirus genome defines four major virus subtypes and multiple variants or clades in different human populations. J. Virol. 1999;73:4156–4170. doi: 10.1128/jvi.73.5.4156-4170.1999. [DOI] [PMC free article] [PubMed] [Google Scholar]
- Zong J.-C., Metroka C., Retiz M.S., Nicholas J., Hayward G.S. Strain variability among Kaposi sarcoma-associated herpesvirus (human herpesvirus 8) genomesevidence that a large cohort of United States AIDS patients may have been infected by a single common isolate. J. Virol. 1997;71:2505–2511. doi: 10.1128/jvi.71.3.2505-2511.1997. [DOI] [PMC free article] [PubMed] [Google Scholar]
- Lee H., Guo J., Li M., Choi J.-K., DeMaria M., Rosenzweig M., Jung J.U. Identification of an immunoreceptor tyrosine-based activation motif of K1 transforming protein of Kaposi's sarcoma-associated herpesvirus. Mol. Cell Biol. 1998;18:5219–5228. doi: 10.1128/mcb.18.9.5219. [DOI] [PMC free article] [PubMed] [Google Scholar]
- Lagunoff M., Majeti R., Weiss A., Ganem D. Deregulated signal transduction by the K1 gene product of Kaposi's sarcoma-associated herpesvirus. Proc. Natl. Acad. Sci. USA. 1999;96:5704–5709. doi: 10.1073/pnas.96.10.5704. [DOI] [PMC free article] [PubMed] [Google Scholar]
- Gao Y.S., Alvarez C., Nelson D.S., Sztul E. Molecular cloning, characterization, and dynamics of rat formiminotransferase cyclodeaminase, a Golgi-associated 58-kDa protein. J. Biol. Chem. 1998;273:33825–33834. doi: 10.1074/jbc.273.50.33825. [DOI] [PubMed] [Google Scholar]
- Allan B.B., Balch W.E. Protein sorting by directed maturation of Golgi compartments. Science. 1999;285:63–66. doi: 10.1126/science.285.5424.63. [DOI] [PubMed] [Google Scholar]
- van Noesel C.J., van Lier R.A., Cordell J.L., Tse A.G., van Schijndel G.M., de Vries E.F., Mason D.Y., Borst J. The membrane IgM-associated heterodimer on human B cells is a newly defined B cell antigen that contains the protein product of the mb-1 gene. J. Immunol. 1991;146:3881–3888. [PubMed] [Google Scholar]
- Ng D.T., Randall R.E., Lamb R.A. Intracellular maturation and transport of the SV5 type II glycoprotein hemagglutinin-neuraminidasespecific and transient association with GRP78-BiP in the endoplasmic reticulum and extensive internalization from the cell surface. J. Cell Biol. 1989;109:3273–3289. doi: 10.1083/jcb.109.6.3273. [DOI] [PMC free article] [PubMed] [Google Scholar]
- Ploegh H.L. Viral strategies of immune evasion. Science. 1998;280:248–253. doi: 10.1126/science.280.5361.248. [DOI] [PubMed] [Google Scholar]
- Sester M., Burgert H.G. Conserved cysteine residues within the E3/19K protein of adenovirus type 2 are essential for binding to major histocompatibility complex antigens. J. Virol. 1994;68:5423–5432. doi: 10.1128/jvi.68.9.5423-5432.1994. [DOI] [PMC free article] [PubMed] [Google Scholar]
- Paabo S., Nilsson T., Peterson P.A. Adenoviruses of subgenera B, C, D, and E modulate cell-surface expression of major histocompatibility complex class I antigens. Proc. Natl. Acad. Sci. USA. 1986;83:9665–9669. doi: 10.1073/pnas.83.24.9665. [DOI] [PMC free article] [PubMed] [Google Scholar]
- Ziegler H., Thale R., Lucin P., Muranyi W., Flohr T., Hengel H., Farrell H., Rawlinson W., Koszinowski U.H. A mouse cytomegalovirus glycoprotein retains MHC class I complexes in the ERGIC/cis-Golgi compartments. Immunity. 1997;6:57–66. doi: 10.1016/s1074-7613(00)80242-3. [DOI] [PubMed] [Google Scholar]
- Jones T.R., Wiertz E.J., Sun L., Fish K.N., Nelson J.A., Ploegh H.L. Human cytomegalovirus US3 impairs transport and maturation of major histocompatibility complex class I heavy chains. Proc. Natl. Acad. Sci. USA. 1996;93:11327–11333. doi: 10.1073/pnas.93.21.11327. [DOI] [PMC free article] [PubMed] [Google Scholar]
- Tatu U., Helenius A. Interactions between newly synthesized glycoproteins, calnexin and a network of resident chaperones in the endoplasmic reticulum. J. Cell. Biol. 1997;136:555–565. doi: 10.1083/jcb.136.3.555. [DOI] [PMC free article] [PubMed] [Google Scholar]
- Hochstenbach F. Quaternary structure and assembly process of the T cell receptor. Hum. Cell. 1992;5:12–24. [PubMed] [Google Scholar]
- Payelle-Brogard B., Magnac C., Mauro F.R., Mandelli F., Dighiero G. Analysis of the B-cell receptor B29 (CD79b) gene in familial chronic lymphocytic leukemia. Blood. 1999;94:3516–3522. [PubMed] [Google Scholar]
- Meinhardt G., Wendtner C.M., Hallek M. Molecular pathogenesis of chronic lymphocytic leukemiafactors and signaling pathways regulating cell growth and survival. J. Mol. Med. 1999;77:282–293. doi: 10.1007/s001090050351. [DOI] [PubMed] [Google Scholar]
- Thompson A.A., Do H.N., Saxon A., Wall R. Widespread B29 (CD79b) gene defects and loss of expression in chronic lymphocytic leukemia. Leuk. Lymphoma. 1999;32:561–569. doi: 10.3109/10428199909058414. [DOI] [PubMed] [Google Scholar]
- Kanavaros P., Gaulard P., Charlotte F., Martin N., Ducos C., Lebezu M., Mason D.Y. Discordant expression of immunoglobulin and its associated molecule mb-1/CD79a is frequently found in mediastinal large B cell lymphomas. Am. J. Pathol. 1995;146:735–741. [PMC free article] [PubMed] [Google Scholar]
- Mori S., Takanashi M., Shiota M., Choi S.H., Yamanashi Y., Watanabe T., Koike M. Down-regulation of membrane immunoglobulin-associated proteins, MB-1, B29 and Lyn, in AIDS-lymphomas and related conditions. Virchows Arch. 1994;424:553–561. doi: 10.1007/BF00191443. [DOI] [PubMed] [Google Scholar]
- Boshoff C., Gao S.J., Healy L.E., Matthews S., Thomas A.J., Coignet L., Warnke R.A., Strauchen J.A., Matutes E., Kamel O.W. Establishing a KSHV+ cell line (BCP-1) from peripheral blood and characterizing its growth in Nod/SCID mice. Blood. 1998;91:1671–1679. [PubMed] [Google Scholar]
- Lankester A.C., van Schijndel G.M., van der Schoot C.E., van Oers M.H., van Noesel C.J., van Lier R.A. Antigen receptor nonresponsiveness in chronic lymphocytic leukemia B cells. Blood. 1995;86:1090–1097. [PubMed] [Google Scholar]
- Miller C.L., Longnecker R., Kieff E. Epstein-Barr virus latent membrane protein 2A blocks calcium mobilization in B lymphocytes. J.Virol. 1993;67:3087–3094. doi: 10.1128/jvi.67.6.3087-3094.1993. [DOI] [PMC free article] [PubMed] [Google Scholar]
- Miller C.L., Lee J.H., Kieff E., Longnecker R. An integral membrane protein (LMP2) blocks reactivation of Epstein-Barr virus from latency following surface immunoglobulin crosslinking. Proc. Natl. Acad. Sci. USA. 1994;91:772–776. doi: 10.1073/pnas.91.2.772. [DOI] [PMC free article] [PubMed] [Google Scholar]
- Miller C.L., Burkhard A.L., Lee J.H., Stealey B., Longnecker R., Bolen J.B., Kieff E. Integral membrane protein 2 of Epstein-Barr virus regulates reactivation from latency through dominant negative effects on protein-tyrosine kinases. Immunity. 1995;2:155–166. doi: 10.1016/s1074-7613(95)80040-9. [DOI] [PubMed] [Google Scholar]
- Choi J.K., Lee B.S., Shim S.N., Li M., Jung J.U. Identification of the novel K15 gene at the rightmost end of the Kaposi's sarcoma-associated herpesvirus genome. J. Virol. 2000;74:436–446. [PMC free article] [PubMed] [Google Scholar]
- Caldwell R.G., Wilson J.B., Anderson S.J., Longnecker R. Epstein-Barr virus LMP2A drives B cell development and survival in the absence of normal B cell receptor signals. Immunity. 1998;9:405–411. doi: 10.1016/s1074-7613(00)80623-8. [DOI] [PubMed] [Google Scholar]


