

The past 2 yr have been extraordinary in terms of advances in our understanding of how ion channels work. Nowhere has this dizzying progress been more evident than in the study of the voltage-dependent K+ channel family, Kv. The great catalyst has been, of course, the high-resolution structure of the Streptomyces lividans K+ channel KcsA (Doyle et al. 1998), a breakthrough that brought into sharp focus more than three decades of electrophysiological studies on K+ channels. The structure of KcsA shows a remarkably efficient blueprint for ion permeation: a short selectivity filter, where carbonyl oxygens are likely to interact with dehydrated ions, followed by an energetically favorable water-filled cavity, capped at the intracellular end by a closely packed bundle of helices restricting ion flow in the closed state. Gating mechanisms, however, are harder to deduce from examination of the KcsA structure. A description of the molecular basis of ion channel gating requires an understanding of the transduction machinery that converts multiple forms of physical stimuli (i.e., voltage, ligand binding, force, etc.) into the kind of protein movements that ultimately leads to ion permeation.
Based on sequence similarity (Schrempf et al. 1995) and on the near equivalence of the KcsA scorpion toxin binding receptor to that of voltage-dependent channels (MacKinnon et al. 1998), it seems likely that the overall architecture of the KcsA pore is conserved throughout the Kv channel family. Thus, an emerging notion is that Kv channels can be divided into two separate structural domains: a pore, or core, domain containing both the selectivity filter and activation gate (segments S5, S6, and P-loop), and a voltage-sensing domain (segments S1–S4) responsible for energy transduction and for controlling gating behavior. Unfortunately, there is still no direct structural information regarding the conformation of the S1–S4 transmembrane segments determined from an intact channel. Such information is a prerequisite for a molecular understanding of voltage-dependent gating in Kv channels. Although this is certainly on the minds of a number of structural biologists working on the problem, obtaining the type of quality crystals (3-D or 2-D) required for high-resolution crystallographic studies is by no means a short-term scenario.
Two papers in this issue of The Journal (Hong and Miller 2000; Li-Smerin et al. 2000), together with recently published work by Monks et al. 1999, take aim at this problem by using perturbation analysis to deduce the secondary structure and possible packing arrangement of the transmembrane segments of Kv channels. The idea behind this approach is fairly simple: residues in a given protein segment are systematically mutated into sterically challenging side chains; then the functional consequence of each mutation is analyzed to determine the positions in the sequence most affected by the perturbation. This methodology, first introduced by Wells 1991 as the alanine-scanning mutagenesis strategy, has been extremely successful in the study of protein–protein interaction surfaces. The choice of the perturbing residue is usually restricted to those having very small (Alanine) or very large (Tryptophan) side chains, but, in principle, other residues could also be used.
The method can be extended by searching for a periodic behavior in the perturbations caused by the mutagenesis, as only secondary structure elements with explicit solvent-exposed surfaces will show any periodicity in the response to a mutational scan (Here “solvent” represents either water or lipid molecules). This type of approach has been employed to identify the secondary structure of transmembrane segments in the Mot proton channel of the Escherichia coli flagellar motor (Sharp et al. 1995) and in inward rectifier channels Kir1.1 and Kir2.1 (Choe et al. 1995; Collins et al. 1997).
In an earlier study, Monks et al. 1999 performed Trp scanning mutagenesis to investigate the secondary structure and location of the solvent-exposed surface of the S2 segment in Shaker K+ channels. The per-residue perturbation was quantified by estimating a standard free energy (ΔGo) calculated from the relative stability of the closed conformation of the channel and referenced to that of the wild-type channel as a ΔΔGo. Based on this parameter, residues were classified as either “tolerant” or “high-impact,” depending on the degree of functional perturbation caused by the Trp side chain. Their data revealed obvious α-helical periodicity, with tolerant and high-impact residues segregating at opposite sides of a helix projection. Such distribution then allows for a clear definition of a solvent-exposed surface. As expected, the tolerant face of the helix had a striking correspondence with the positions with the highest sequence variability.
Hong and Miller used an identical approach to probe the secondary structure of the S1 and S3 segments (but note that their ΔΔGo values refer to the stability of the open state). Their results demonstrate quite convincingly the α-helical nature of the S1 segment, where tolerant and high-impact positions are well distributed along two faces of the helix. This distribution is also paralleled in terms of variable and conserved residues at each side of the helix surface. The data for the S3 segment is far more complicated. Viewed from a helical wheel projection, neither high-impact nor tolerant positions tend to segregate into two distinct surfaces as with S1 and S2. Furthermore, variability data derived from sequence alignments shows that a number of tolerant positions are highly conserved, and some high-impact positions fall within a high-variability segment. Further analysis of the data, however, demonstrated that starting from its NH2-terminal end, more than half of S3 displays an apparent α-helical periodicity, with the last third of the segment showing most of the discrepancies.
In a mutational tour de force, Li-Smerin et al. performed an Ala scanning mutagenesis of the entire S1–S4 gating domain of drk1 channels (127 residues, including the loops linking the transmembrane segments) to obtain information about the secondary and super-secondary structure of the entire region. As with Hong and Miller, the degree of per-residue perturbation was quantified using an estimate of ΔΔGo derived from the voltage dependence of the conductance. Also of note is the fact that Li-Smerin et al. used a nonbiased quantitative analysis to determine the quality and extent of the secondary structure estimates. Instead of relying primarily on the apparent segregation of tolerant and high-impact residues in a helical wheel projection, Li-Smerin et al. extracted angular frequency information from the data profile using a discrete Fourier transform method first described by Cornette et al. 1987. In this method, the spectral density plotted against angular frequency (ω) identifies the main frequency components from any linear string of data. For example, a perfect α-helix, with a period of 3.6 residues per turn, is expected to have a significant peak at or near 100° (360° of the unitary circle, divided by 3.6), while a strand in a β sheet is expected to show a large component at 180° (360° divided by two residues per turn). This quantitative approach makes it possible to evaluate the significance of a specific frequency peak by means of the periodicity index (PI; Cornette et al. 1987). The PI is calculated as a weighted measure of the area within the frequency range of choice (say between 80° and 120° for α-helices), relative to the area of the entire power spectrum. For significant frequency components, the value of PI should be >2 (Cornette et al. 1987).
Based on this type of analysis, results for S1, S2, and S3 agree well with those Monks et al. 1999 and Hong and Miller derived from Trp scanning. The αPI for S1 was 2.3 and for S2 was 1.8 (although it may be actually higher), while Fourier analysis of the Monks et al. 1999 data for S2 gave an αPI value of 2.4. These findings are all in agreement with the S1 and S2 segments having a strong α-helical periodicity and a large solvent-exposed surface. Quantitative analysis of the S3 data turned out to be far more challenging. The power spectra obtained from the entire segment did not show significant α-helix components (αPI = 1.4), while restricting the window of analysis to the NH2-terminal half of S3 generated a large frequency component centered at 122°. In principle, this frequency component would correspond to a 3-10 helix, an unusual type of secondary structure only found in short stretches capping the termini of canonical α-helices. Li-Smerin et al. interpret these results to suggest that the S3 segment is surrounded by a complex environment of multiple protein–protein contacts, with perhaps a small area accessible to solvent at the NH2-terminal end of the helix.
One of the most interesting, if not unexpected, results from the Li-Smerin et al. study is the uncovering of evidence supporting defined secondary structures in the extracellular “loops” of the channel. By comparing the calculated αPI of the entire |ΔΔGo| profile using a sliding window (13 or 17 residues; Rees et al. 1989), with a standard hydrophobicity profile (17 residue window), they were able to correlate peaks in the αPI profile with minima in the hydrophobicity profile corresponding to segments connecting S1 with S2 and S3 with S4. When analyzed in detail, the S1–S2 loop had a strong αPI = 2.1 and is postulated to lie at the extracellular surface of the protein, while the S3–S4 loop had a less-than-ideal αPI = 1.6 and its location relative to the plane of the membrane is still open to interpretation. This surprising finding serves as strong incentive for the use of quantitative data mining in the analysis of scanning mutagenesis experiments.
Fig. 1 puts the three data sets in perspective. It shows an overview of all the results for Shaker and drk1 channels, classified according to their functional effects as low or high impact positions. Here, the structural equivalence between specific residue positions is assumed to correspond to that of a straightforward sequence alignment, and the outcome for each position is mapped on a helical wheel projection, as in each of the original manuscripts. Echoing the main conclusion from Monks et al. 1999, Hong and Miller, and Li-Smerin et al., these plots show that the first two transmembrane segments in Kv channels have extensive lipid-exposed surfaces, and therefore are likely to be located at the periphery of the tetrameric complex.
Figure 1.
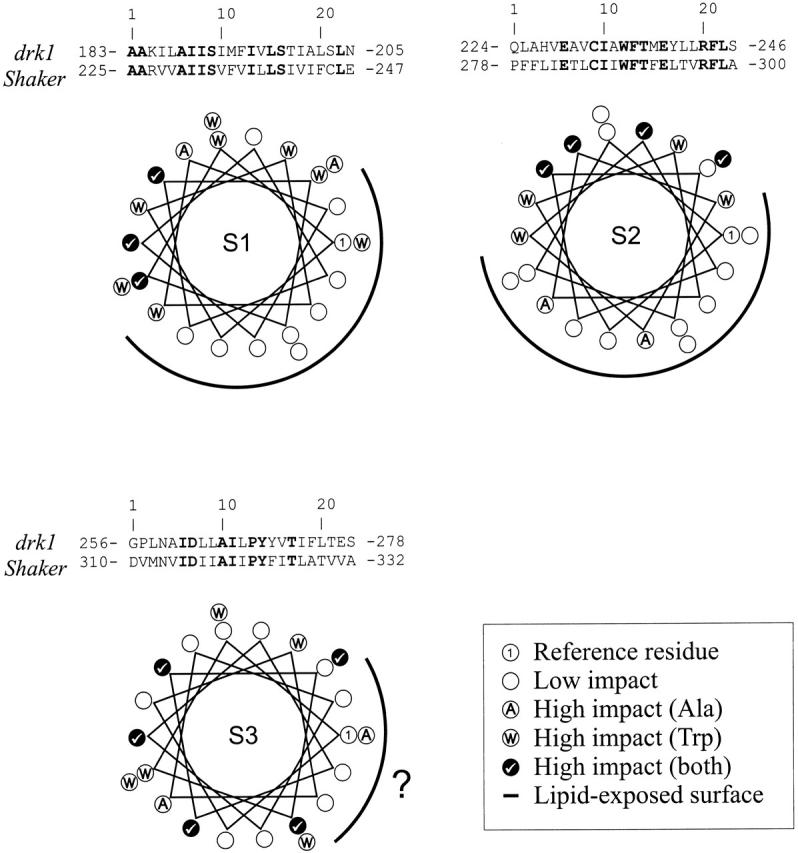
Comparison of Trp scanning mutagenesis in Shaker channels with Ala scanning mutagenesis in drk1 channels for transmembrane segments S1, S2, and S3. Stretches of 23 residues including each transmembrane segment were aligned, and the high-impact positions for each mutagenesis scan annotated in a helical wheel projection. The orientation of each helical wheel is referred in each case to the first position in the alignment (right-most position in the wheel). High-impact positions from the Trp scan are labeled with a circled W, and those from the Ala scan with a circled A. Positions in which both data sets coincide are labeled with a check mark. The continuous line points to the proposed lipid exposed surface for each segment.
While both groups regard the S3 segment to be α-helical, opinions differ about the details of its packing in the channel. Li-Smerin et al. consider this segment involved in multiple tertiary contacts, with accessibility to solvent provided perhaps by crevasses between helices. Hong and Miller view the S3 segment largely as a lipid-exposed segment, contributing along S1 and S2 to shield S4 and S6 from the lipid environment. In fact, Fig. 1 does show that even the positions considered high impact in both studies (Fig. 1, check mark) do not segregate into two distinct surfaces, arguing against a simple buried/exposed helix surface. However, as Hong and Miller point out, a helical net diagram suggests that the NH2-terminal portion of S3 show a better segregation between high- and low-impact positions (not shown). This apparent discrepancy in interpretation could be the case of a differential effect of Ala versus Trp scanning in tightly packed architectures. But, since the putative solvent-exposed surface is, in both data sets, fairly small and oriented towards the intracellular end of the helix, this might be the case of a glass half-full/half-empty–type difference in interpretation.
Hong and Miller did not do a similar perturbation analysis in S4, as they argued that the even distribution of charged residues in S4 (every three), and the fact that charge neutralizations may affect channel voltage dependence, could bias the results. Li-Smerin et al. minimized the problem of the electrostatic contribution of charge neutralization along S4 by cleverly (and arbitrarily) assigning the average value of |ΔΔGo| obtained from the entire S4 segment to each of the basic S4 residues. The direct consequence of this subterfuge was that the α-helix component in the power spectra was dramatically improved, allowing for an univocal α-helical assignment to at least the COOH-terminal half of S4 (αPI = 2.9). Thus, even if S4 seems to be mostly surrounded by other interacting helices, the data from Ala scanning strongly supports the notion that this segment is α-helical.
A very satisfying conclusion from both Monks et al. 1999 and Li-Smerin et al. is that residues thought to be involved in an elaborated network of charges between S2, S3, and the S4 segment (Papazian et al. 1995) fall squarely within the predicted protein–protein contact surface of each segment. This charge network is thought to play important roles in channel assembly (Papazian et al. 1995; Tiwari-Woodruff et al. 1997) and in the behavior of the voltage sensor as a whole (Planells-Cases et al. 1995; Seoh et al. 1996). Thus, the present data tends to support, at least in terms of helix orientation, the concept of distributed negative residues serving as countercharges for some S4 basic residues. These interactions therefore should provide essential constraints, when packing the transmembrane helices for any structural model of voltage-dependent channels.
Li-Smerin et al. conclude their study by proposing a specific four-helix packing arrangement for the S1–S4-gating domain. They base their packing model on three pieces of information: (a) the proposed α-helical structure for all transmembrane segments of the S1–S4 segment, (b) the relative orientation of a projected net |ΔΔGo| calculated as the resultant vector from individual |ΔΔGo| values, and (c) the enforcement of the proposed electrostatic interactions between negative charges in S2 and S3 with basic residues in S4. Although speculative, this specific packing model can serve as a blueprint for future mutagenesis studies regarding the voltage-sensing domain of Kv channels. Hong and Miller do not explicitly propose a packing arrangement, but suggest that the outermost portions of the channel must be lined by segments S1 through S3 (surrounding S4 and S6), and based on sequence variability analysis propose that S5 must show some lipid-accessible surface.
The actual placement of the S1–S4 four-helix bundle relative to the pore domain is thus far anybody's guess: in fact, the placement of the S1–S4 segments relative to the S5–S6 core occurs in opposite orientations in Li-Smerin et al. and Hong and Miller's interpretation (Fig. 1, respectively). Additional pieces of information, perhaps in the form of double mutant analysis or genetic approaches to identify possible suppression partners, are needed to complete this six-helix packing puzzle.
References
- Choe S., Stevens C.F., Sullivan J.M. Three distinct structural environments of a transmembrane domain in the inwardly rectifying potassium channel ROMK1 defined by perturbation. Proc. Natl. Acad. Sci. USA. 1995;92:2046–12049. doi: 10.1073/pnas.92.26.12046. [DOI] [PMC free article] [PubMed] [Google Scholar]
- Collins A., Chuang H., Jan Y.N., Jan L.Y. Scanning mutagenesis of the putative transmembrane segments of Kir2.1, an inward rectifier potassium channel. Proc. Natl. Acad. Sci. USA. 1997;94:5456–5460. doi: 10.1073/pnas.94.10.5456. [DOI] [PMC free article] [PubMed] [Google Scholar]
- Cornette J.L., Cease K.B., Margalit H., Spouge J.L., Berzofsky J.A., DeLisi C. Hydrophobicity scales and computational techniques for detecting amphipathic structures in proteins. J. Mol. Biol. 1987;195:659–685. doi: 10.1016/0022-2836(87)90189-6. [DOI] [PubMed] [Google Scholar]
- Doyle D.A., Cabral J.M., Pfuetzner R.A., Kuo A., Gulbis J.M., Cohen S.L., Chait B.T., MacKinnon R. The structure of the potassium channelmolecular basis of K+ conduction and selectivity. Science. 1998;280:69–77. doi: 10.1126/science.280.5360.69. [DOI] [PubMed] [Google Scholar]
- Hong K.H., Miller C. The lipid-protein interface of a Shaker K+ channel. J.Gen. Physiol. 2000;115:51–58. doi: 10.1085/jgp.115.1.51. [DOI] [PMC free article] [PubMed] [Google Scholar]
- Li-Smerin Y., Hackos D.H., Swartz K.J. α-Helical structural elements within the voltage-sensing domains of a K+ channel. J.Gen. Physiol. 2000;115:33–49. doi: 10.1085/jgp.115.1.33. [DOI] [PMC free article] [PubMed] [Google Scholar]
- MacKinnon R., Cohen S.L., Kuo A., Lee A., Chait B.T. Structural conservation in prokaryotic and eukaryotic potassium channels. Science. 1998;280:106–109. doi: 10.1126/science.280.5360.106. [DOI] [PubMed] [Google Scholar]
- Monks S.A., Needleman D.J., Miller C. Helical structure and packing orientation of the S2 segment in the Shaker K+ channel. J. Gen. Physiol. 1999;113:415–423. doi: 10.1085/jgp.113.3.415. [DOI] [PMC free article] [PubMed] [Google Scholar]
- Papazian D.M., Shao X.M., Seoh S.A., Mock A.F., Huang Y., Wainstock D.H. Electrostatic interactions of S4 voltage sensor in Shaker K+ channel. Neuron. 1995;14:1293–1301. doi: 10.1016/0896-6273(95)90276-7. [DOI] [PubMed] [Google Scholar]
- Planells-Cases R., Ferrer-Montiel A.V., Patten C.D., Montal M. Mutation of conserved negatively charged residues in the S2 and S3 transmembrane segments of a mammalian K+ channel selectively modulates channel gating. Proc. Natl. Acad. Sci. USA. 1995;92:9422–9426. doi: 10.1073/pnas.92.20.9422. [DOI] [PMC free article] [PubMed] [Google Scholar]
- Rees D.C., DeAntonio L., Eisenberg D. Hydrophobic organization of membrane proteins. Science. 1989;245:510–513. doi: 10.1126/science.2667138. [DOI] [PubMed] [Google Scholar]
- Schrempf H., Schmidt O., Kummerlen R., Hinnah S., Muller D., Betzler M., Steinkamp T., Wagner R. A prokaryotic potassium ion channel with two predicted transmembrane segments from Streptomyces lividans . EMBO (Eur. Mol. Biol. Organ.) J. 1995;14:5170–5178. doi: 10.1002/j.1460-2075.1995.tb00201.x. [DOI] [PMC free article] [PubMed] [Google Scholar]
- Seoh S.A., Sigg D., Papazian D.M., Bezanilla F. Voltage-sensing residues in the S2 and S4 segments of the Shaker K+ channel. Neuron. 1996;16:1159–1167. doi: 10.1016/s0896-6273(00)80142-7. [DOI] [PubMed] [Google Scholar]
- Sharp L.L., Zhou J., Blair D.F. Features of MotA proton channel structure revealed by tryptophan-scanning mutagenesis. Proc. Natl. Acad. Sci. USA. 1995;92:7946–7950. doi: 10.1073/pnas.92.17.7946. [DOI] [PMC free article] [PubMed] [Google Scholar]
- Tiwari-Woodruff S.K., Schulteis C.T., Mock A.F., Papazian D.M. Electrostatic interactions between transmembrane segments mediate folding of Shaker K+ channel subunits. Biophys. J. 1997;72:1489–1500. doi: 10.1016/S0006-3495(97)78797-6. [DOI] [PMC free article] [PubMed] [Google Scholar]
- Wells J.A. Systematic mutational analyses of protein–protein interfaces. Methods Enzymol. 1991;202:390–411. doi: 10.1016/0076-6879(91)02020-a. [DOI] [PubMed] [Google Scholar]