

Abstract
Cortical processing is strongly influenced by the actions of neuromodulators such as acetylcholine (ACh). Early studies in anaesthetized cats argued that acetylcholine can cause a sharpening of orientation tuning functions and an improvement of the signal-to-noise ratio (SNR) of neuronal responses in primary visual cortex (V1). Recent in vitro studies have demonstrated that acetylcholine reduces the efficacy of feedback and intracortical connections via the activation of muscarinic receptors, and increases the efficacy of feed-forward connections via the activation of nicotinic receptors. If orientation tuning is mediated or enhanced by intracortical connections, high levels of acetylcholine should diminish orientation tuning. Here we investigate the effects of acetylcholine on orientation tuning and neuronal responsiveness in anaesthetized marmoset monkeys. We found that acetylcholine caused a broadening of the orientation tuning in the majority of cells, while tuning functions became sharper in only a minority of cells. Moreover, acetylcholine generally facilitated neuronal responses, but neither improved signal-to-noise ratio, nor reduced trial-to-trial firing rate variance systematically. Acetylcholine did however, reduce variability of spike occurrences within spike trains. We discuss these findings in the context of dynamic control of feed-forward and lateral/feedback connectivity by acetylcholine.
Keywords: acetylcholine, coefficient of variation, signal-to-noise ratio, V1
Introduction
Acetylcholine (ACh) acts as a neuromodulator in the cerebral cortex and a variety of functions have been ascribed to it. In vivo studies suggested that it aids in sharpening orientation tuning as well as to improving the signal-to-noise ratios (SNR) of cortical neurons (Sillito & Kemp, 1983; Sato et al., 1987a; Sillito & Murphy, 1987). In vitro studies have demonstrated that it increases neuronal excitability and reduces spike frequency adaptation through the blockade of several K+-currents mediated by the activation of postsynaptic muscarinic receptors (McCormick & Prince, 1986). This could be a mechanism by which neuronal responsiveness upon visual stimulation is increased, and the SNR is improved, provided the spontaneous activity of the neuron remains largely unaffected. In addition to these postsynaptic actions, recent in vitro studies have shown that ACh also modulates synaptic transmission. It can reduce the synaptic efficacy of intracortical connections, through activation of muscarinic receptors (Metherate & Ashe, 1993; Vidal & Changeux, 1993; Murakoshi, 1995; Gil et al., 1997; Kimura & Baughman, 1997; Kimura et al., 1999; Richter et al., 1999; Hsieh et al., 2000; Kimura, 2000), and increase the synaptic efficacy of thalamo-cortical connections through activation of nicotinic receptors (Vidal & Changeux, 1993; Gil et al., 1997; Wonnacott, 1997). These results suggest that cortical integration should be reduced at high ACh levels, a notion supported by our recent in vivo study (Roberts et al., 2005).
Orientation tuning is an emergent cortical property, which is first established in primary visual cortex (V1), being absent in the lateral geniculate nucleus (LGN; Hubel & Wiesel, 1968; Schiller et al., 1976). Early models suggested that appropriately aligned feed-forward inputs from the LGN mediate orientation tuning (Hubel & Wiesel, 1962). Some experimental evidence supports this view, showing that ordered feed-forward projections from the LGN are an important factor in generating orientation tuning in V1 (Ferster, 1986, 1987; Chapman et al., 1991; Chapman & Stryker, 1992; Reid & Alonso, 1995; Anderson et al., 2000). However, there is also evidence demonstrating that intracortical inhibitory mechanisms contribute to the sharpening of tuning functions (Sillito, 1975, 1979; Allison et al., 1995; Allison et al., 1996; Sato et al., 1996; Crook et al., 1997, 1998; Ringach et al., 2002; Ringach et al., 2003; Shapley et al., 2003). If, as shown by in vitro studies, ACh reduces intracortical synaptic efficacy, it might also affect orientation tuning. However, rather than sharpen it, as suggested by previous in vivo studies, a high level of ACh might result in broader tuning, due to decreased drive from inhibitory interneurons.
Here we investigated the effects of ACh application on orientation tuning, the SNR, and response reliability in V1 of anaesthetized marmoset monkeys (Callithrix jacchus).
Materials and methods
Physiological preparation
All experiments were carried out in accordance with the European Communities Council Directive 1986 (86/609/EEC), the National Institutes of Health guidelines for care and use of animals for experimental procedures, the Society for Neurosciences Policies on the Use of Animals and Humans in Neuroscience Research, and the UK Animals Scientific Procedures Act.
Four marmosets (Callithrix jacchus, 400–480 g) were used in acute preparations. Anaesthesia was induced with intramuscular injection of Saffan (Alphadalone/Alphaxalone acetate, 1.5 mL/kg) and maintained during surgery using bolus injections of Propofol through the tail vein. The vein of the hind limb was cannulated to allow a continuous infusion of the drugs during the experiment. A catheter was inserted into the bladder for urine collection. The trachea was cannulated to allow artificial ventilation (35–70 strokes/min, 3.5–5.5 mL/stroke). During the experiment anaesthesia was maintained with a continuous infusion of Propofol (6–12 mg/h) and analgesia was induced and maintained with Rapifen (156 μg/kg/h). After ensuring a sufficient depth of anaesthesia, by repeatedly checking the absence of withdrawal reflexes, paralysis was induced and maintained with Norcuron (100 μg/kg/h). Additional Dexamethasone (200 μg/kg/h) was given to prevent cerebral oedema and inflammation. Antibiotics (Cephuroxide, 125 mg/kg) were injected intravenously every 12 h. The electrocardiogram, blood pressure and end-tidal CO2 were continuously monitored. End-tidal CO2 was kept at 3.5–4.5%. Rectal temperature was recorded and maintained at 38 °C using a heating pad. Eyes were protected with contact lenses and frequently moistened and cleaned with saline. Atropine eye drops were regularly applied to induce and maintain mydriasis and cycloplegia.
Extracellular recording and iontophoresis
Extracellular recordings and drug applications were performed in area V1. Five barrel micropipettes (5BBL W/FIL 1.2 mm, World Precision Instruments, Inc.), pulled with a Narishige PE-2 puller to obtain a total tip diameter of 15–30 μm, were used for the iontophoretic drug application. The individual barrels had an outer tip diameter of 5–10 μm, and inner diameters of 2–5 μm. The impedance of each barrel was in the range of 10–50 MΩ. A tungsten electrode (FHC Inc., 1–2 MΩ) was attached to the pipette for recording of extracellular action potentials close to the location of drug release (tip distance 25–50 μm). One or two barrels were filled with ACh (Sigma, 1 m, pH 4.5); another barrel was filled with saline (0.9%). Currents were controlled with a Neurophore BH-2 system (Harvard Apparatus). ACh was applied by using positive ejection currents in the range of 1–100 nA. Usually a current of 40–80 nA was chosen for application. In cases where the applied current caused neurons to spontaneously fire erratically the current was reduced down to currents as low as 1 nA. Retention currents used to prevent leakage of the drug were in the range of −10 to −20 nA. During the drug application no negative balance current was applied on the saline pipette, because this could cause an accumulation of ACh in the saline pipette which would be released during application of retention currents (Sato et al., 1987b; Sillito & Murphy, 1987). To ensure that activity changes during application and control conditions were not caused by the applied currents we held the overall current constant during application and nonapplication of ACh. This was achieved by adjusting the current flowing from the saline pipette accordingly while keeping it always positive. We initially recorded neuronal activity when no ACh was applied (15–20 trials per stimulus condition) followed by at least one measurement with ACh application (15–20 trials per stimulus condition). Three to five minutes after termination of ACh application we recorded the neuronal activity at least once without ACh application to determine that recovery occurred (15–20 trials per stimulus condition).
Visual stimulation
Stimuli were presented and spike timings recorded under the control of Cortex 5.95 (Laboratory of Neuropsychology, National Institute of Mental Health) in a two-computer configuration. A 20-inch cathode ray tube monitor (75 Hz, 1600 × 1200 pixels) positioned 57 cm in front of the animal was used for stimulus presentation. Stimuli were presented monocular at 70% Michelson contrast on a grey background (24.6 cd/m2). Depending on the cell's preference the stimuli were brighter or darker than the background. The neuron's minimum response field (Barlow et al., 1967; Maffei & Fiorentini, 1976) was determined by moving a bar with variable orientation, length and width across the screen. Following minimum response field mapping the orientation tuning characteristics were determined by presenting a bar with a length corresponding to the minimum response field size at one of eight possible orientations (0–157.5°, 22.5° steps). Each orientation was presented 15–20 times for the initial recording, during ACh application, and for the recovery recording in a pseudo-random order for 500 ms with 500 ms pre- and 200 ms poststimulus time. We used stationary flashed bars, rather than moving bars, for stimulation, as we were interested in the effects of ACh on neuronal activity during the transient (stimulus onset) and the sustained response (after stimulus onset).
Data analysis
Spike times were collected with a resolution of 1 ms. Single trial spike rates were determined for the pre-response and the response period. Mean firing rates as a function of time were obtained by Gaussian kernel estimation with a 10-ms bandwidth (Nawrot et al., 1999). Response latency was determined using a half-maximum approach (Gawne et al., 1996; Friedman & Priebe, 1998). To test for activity drifts during the data acquisition we compared single trial spike counts between the initial control and the recovery measurement separately for each stimulus condition, as well as for the spontaneous activity. If cells did not show recovery from drug application they were excluded from further analysis. We tested for drug effects by comparing spike counts during recordings when ACh was applied with combined data from control recordings. Only cells showing a significant effect of ACh on their firing rate during the 500-ms stimulus presentation time (P > 0.05, t-tests, corrected for multiple comparison) were used for the analysis in the current paper.
We separated cells into two categories, cells facilitated and cells inhibited by ACh. A cell was classified as facilitated, if the sum of the spikes for all conditions and trials was higher during the application of ACh. It was classified as inhibited otherwise.
Tuning and response properties were analysed in different time windows. Activity from 300 ms preceding stimulus onset of all conditions was used to determine the cell's spontaneous activity. The mean response was defined as the response during the entire stimulus presentation, adjusted by the cell's latency. Additionally activity was taken from five 100 ms bins to describe effects for different parts of the response also adjusted by the cell's latency. The adjustment of time windows relative to response latency means that all stimulus driven response periods relate to response onset, not stimulus onset. The final bin thus includes a time period after stimulus offset during which responses still persisted due to the cell's latency.
The analysis of ACh induced changes to response characteristics was generally performed with the responses that occurred to a bar of preferred orientation. Exceptions from this will be stated explicitly in the results section.
Modulation index (MI)
We calculated the ACh induced modulation of neuronal activity for the different time periods according to:
| (1) |
Where RACh was the response during ACh application and RCtr was the response during control conditions (ACh not applied).
Tonicity index (TI)
Tonicity index (TI) was determined to describe the response shape. TI is defined here as the activity during the fourth 100 ms bin (300 ms to 400 ms after response onset) of the response divided by the activity during the first 100 ms bin (0–100 ms after response onset). Values towards zero indicate transient responses with a strong onset, and little sustained activity, while values of around 1 indicate a tonic/sustained response with similar activities during the early and late response phases.
Response reliability
Signal-to-noise ratio
Signal-to-noise ratio (SNR) was calculated as the stimulus driven response (Rstim) divided by the sum of the stimulus driven response and spontaneous activity (Rspont):
| (2) |
This calculation is identical to the SNR calculation used by Sato et al. (1987b). It describes how much the neuronal activity exceeds the background activity if a visual stimulus is present. Values towards 1 indicate that the stimulus driven response is much higher than the spontaneous activity. To determine the reliability of this measure for each neuron we used a bootstrap method, randomly resampling our data 1000 times with replacement.
Variance vs. mean firing rate
To test whether the application of ACh showed a systematic effect on the trial-to-trial response reliability we determined the variance of spike counts between trials for the whole (0–500 ms after response onset), the early (0–100 ms after response onset), and the late response period (300–400 ms after response onset). The response variance scales with the mean response. The degree of this scaling was estimated by fitting the power function:
| (3) |
to the mean vs. variance data (Gur et al., 1997). In logarithmic metrics this function corresponds to a straight line, with intercept a and slope b. Following transformation of the mean and variance of the firing rate into logarithmic values, we used a robust linear regression (Matlab 13, Mathworks) to obtain the coefficients a and b for each cell when ACh was not applied and when it was applied.
Coefficient of variation
To asses the regularity of spike timing within individual trials the coefficient of variation (CV) for the interspike-intervals (ISI) distribution was calculated (Softky & Koch, 1993; Liu & Wang, 2001) as the standard deviation of the ISI-distribution divided by its mean:
| (4) |
with:
| (5) |
A very regular firing pattern results in a sharp peak of the ISI-distribution and a CV towards 0, whereas irregular firing pattern result in a broader ISI distribution and large CVs. This measurement is somewhat problematic, because it is sensitive to nonstationarity of the firing rate, which inevitably occurs during stimulus presentation. To account for this problem we also calculated the CV within a moving average window (bin width 25 ms, 25 ms steps), within which the mean ISI and the CV were calculated, resulting in time resolved CVs and mean ISIs.
Orientation tuning
Orientation tuning characteristics were described by a variety of different measures. Preferred orientation was defined as the bar orientation closest to the circular mean (θp) using the 500 ms presentation time to determine the response activity Ri to a bar with the orientation angle θ. First the rectangular components S and C of the mean vector were determined:
| (6) |
| (7) |
These values were used to calculate the preferred orientation θp:
| (8) |
or
| (9) |
Tuning concentration
A measure that reflects the tuning width and also the selectivity of a neuron is given by the circular concentration (T; Swindale, 1998):
| (10) |
We calculated the tuning width by fitting a wrapped Gaussian function (Swindale, 1998) to the mean response to each bar orientation (least-square fitting; Press et al., 2002):
| (11) |
where G(θ) is the predicted response given the bar orientation (θ), A is the tuning amplitude, σ the bandwidth, ρ the centre location (the predicted preferred orientation), and B the offset. To test whether ACh significantly changed any of these parameters, we applied a bootstrapping method (Press et al., 2002), randomly re-sampling our data 100 times with replacement. This generated 100 estimates of the fitting parameters from which the median and 25, 75 percentiles of each parameter were derived. A signed rank-test was used to determine whether any of these tuning parameters were significantly influenced by ACh application.
Results
We recorded a total of 175 cells with and without application of ACh. One-hundred and four cells showed a significant effect of ACh application on the firing rate. The lack of effect of ACh on activity in 71 cells does not necessarily mean that these cells were insensitive to ACh application, as the pipettes may not have been working during a substantial proportion of these recordings. Additionally, for some of the cells no recovery occurred, which could either have been due to long-term effects of ACh application or cell drifts during the recording. With the current work we want to investigate how ACh affects the neuronal response, not what the proportions of ACh sensitive and insensitive cells are (see Sato et al., 1987b), therefore we focus on cells showing a clear effect of the ACh application.
Of the 104 cells that were significantly affected by ACh application 68 (65.4%) exhibited an increase of their response, while for 36 (34.6%) cells the response was reduced. Fifty-eight (55.8%) cells exhibited a significant change (generally an increase) of their spontaneous activity. Figure 1 shows the firing rates of four example cells that were affected in different manners by ACh. They exemplify what was seen in many cells upon ACh application. The upper histograms show the firing rates in response to the preferred stimulus orientation when ACh was not applied (black) and when it was applied (grey). The grey-scale plots below show the activity profiles as a function of time and stimulus orientation when ACh was not applied (second row) and when it was applied (third row). The fourth row shows the absolute difference between row 2 and 3. The first cell (Fig. 1A) exhibited increased spontaneous activity and firing rates during the entire stimulation period. Responses were also more sustained upon ACh application and the orientation tuning curve appears broader. The cell in Fig. 1B represents an example of increased cell activity in conjunction with a reduction in cell latency (a rare occasion) upon ACh application. Figure 1C is an example for cells where firing rate increases were mostly restricted to the late (tonic/sustained) response period upon ACh application, and tuning during the late part seemed broader upon ACh application. A minority, but substantial fraction of cells showed response decreases that were generally strongest during the early (transient) response period. An example for such a cell type is shown in Fig. 1D.
Fig. 1.

Effects of acetylcholine on response profiles and orientation tuning. Upper graphs show raster plots and histograms when ACh was not applied (black curves) and when it was applied (grey curves, width of the curves denotes standard error) for four example cells (A–D). Row 2 (ACh not applied) and 3 (ACh applied) show the activity as a function of time (horizontal axis in ms relative to stimulus onset, time 0) and bar orientation (vertical axis, preferred orientation [deg] corresponds to second tick mark from the base). Row 4 shows the difference plot between those shown in row 2 and 3. Cell A was affected by ACh at all orientations and over the entire response period. Cell B was mostly affected at orientations close to the preferred. It was one of the few cells where ACh caused a change in latency. Cell C was affected by ACh application over a broad range of orientations, but most strongly at those flanking the preferred, and during late response periods. Cell D was inhibited by ACh application. The inhibition was strongest when the preferred orientation was presented and during the early response period. The histograms are based on 20 trials (top 20 rows of rasters) without and 20 trials with ACh application each.
The remainder of the results section will be split into two main parts. The first part will investigate how ACh affected response properties, profiles, and response reliability in cells facilitated and cells inhibited by ACh. The second part will investigate how ACh affected neuronal tuning functions.
Response properties, profiles, and reliability
To investigate whether the effect of ACh on neuronal activity changed over the response duration we subdivided the stimulus driven response into five 100 ms time windows. The result of this analysis is shown in Fig. 2, where the firing rates are plotted for these different response periods when ACh was not applied and when it was applied. Neurons facilitated by ACh are represented in black, neurons inhibited by ACh as grey dots. The spontaneous activity was increased in most neurons during ACh application (Fig. 2A). This effect was highly significant and occurred even for cells that were inhibited by ACh during stimulus presentation (P < 0.001, signed rank test). During the first 100 ms following response onset the majority of cells increased their firing rates, but firing rate reductions also occurred (Fig. 2B). During this early response period the difference between facilitated and suppressed cells was also most obvious. An increase in firing rate was even more pronounced during the later response periods. Interestingly this increase was also found for inhibited neurons, which indicates that ACh induced inhibition was strongest or restricted to the early response (Fig. 2C-F).
Fig. 2.

Firing rate of neurons as a function ACh application. (A) Effect of ACh on spontaneous activity. Most neurons increased their spontaneous activity upon ACh application. (B–F) Effects of ACh application on stimulus driven activity (preferred bar orientation) during the different response periods. horizontal axis, activity when ACh was not applied, vertical axis, activity when ACh was applied. Black symbols, cells facilitated by ACh, grey symbols, cells inhibited by ACh.
We were interested in the degree of ACh induced firing rate modulation for the different response periods, and calculated a rate modulation index for each 100 ms bin (MI, see Materials and methods). We separately examined cells facilitated by ACh and cells inhibited by ACh. Cells facilitated by ACh showed the largest MI during spontaneous activity (Fig. 3A). Their MI during stimulus driven responses was smallest during the earliest response period immediately following response onset. The MI gradually increased during the first 200 ms after response onset (Fig. 3A). This difference of modulation indices for different time windows was significant for facilitated cells [P < 0.001, Kruskal–Wallis Analysis of Variance (anova)]. Modulation indices were less affected by response time for cells inhibited by ACh (Fig. 3B), and there was no significant difference between the MIs for the various response times (P = 0.549, Kruskal–Wallis anova).
Fig. 3.
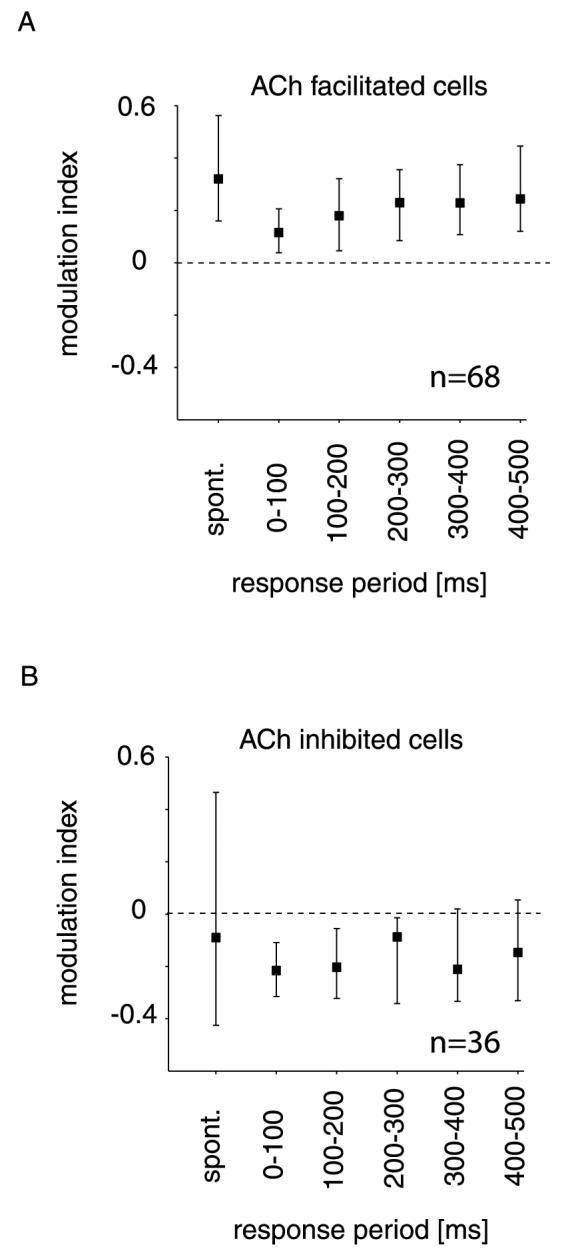
Median modulation index for the spontaneous activity and firing rate in the presence of a bar with preferred orientation. (A) Modulation index for cells facilitated by ACh during spontaneous activity and during different response periods following response onset. (B) Modulation index for cells inhibited by ACh during spontaneous activity and during different response periods following response onset. Error bars denote 25, 75 percentiles.
ACh application had different effects on spontaneous and stimulus driven activity in some cells. Due to this dissociation we performed all analyses in the remainder of the results section without subtracting spontaneous activity. Another reason for not subtracting spontaneous activity was the possibility of otherwise negative firing rates for nonpreferred stimuli, which would have rendered some of our analyses impossible to interpret.
During this initial analysis we compared the activity for five different time windows. For the remaining analysis we will concentrate on just three periods; on the whole response (0–500 ms), the first (early, 0–100 ms) and the fourth (late, 300–400 ms as this time period does not yet include parts of the off response) time bin following response onset.
Tonicity index (TI)
The TI describes the relative strength of the early (transient) to the late (sustained) response period and therefore refers to the general shape of the response. Values towards 1 indicate a tonic response profile, low values a phasic response profile. A repeated measurement two-factor anova showed that TIs were significantly affected by ACh application, and by bar orientation (P < 0.05). TIs were larger during ACh application than during control conditions, and they were smallest during preferred bar presentation. There was no interaction between the two factors, i.e. the effect of ACh application on TI was independent of the bar orientation (P = 0.746). This analysis demonstrates that ACh made responses more sustained.
Signal-to-noise ratio (SNR)
As demonstrated in Fig. 2 ACh caused a proportionally stronger increase during spontaneous activity than during stimulus driven activity, which suggests that SNR might be decreased during ACh application. To test this we calculated the median SNR (by means of bootstrapping, see Materials and methods) for each cell under control conditions and for conditions with application of ACh. The resulting distributions for the three response periods are plotted in Fig. 4. The SNR was significantly reduced when ACh was applied during the three response periods (P < 0.05, Wilcoxon signed rank test).
Fig. 4.

Signal-to-noise ratios (SNR). (A) SNR during the whole response period (0–500 ms) when ACh was not applied (horizontal axis) and when it was applied (vertical axis) for cells facilitated (filled symbols) and cells inhibited (open symbols). (B) SNR during the first 0–100 ms following response onset. (C) SNR during the period from 300 to 400 ms following response onset. Symbols denote the median SNR obtained from bootstrapping. Error bars denote 25, 75 percentiles obtained from the bootstrap distribution.
SNR, as calculated above, only takes the ratio of mean firing rates into account, but does not provide information about the variance of firing rates from trial-to-trial or the variance of spike occurrence within a trial. In vitro studies have demonstrated that ACh reduces spike frequency adaptation (e.g. McCormick & Prince, 1986), potentially rendering spike occurrence more reliable. Additionally, it has been demonstrated that spikes elicited in the cortex following electrical stimulation within the LGN occurred more reliably from trial-to-trial during ACh application (Sato et al., 1987b), which should reduce the variance of firing rates. The increase of the TI values indicated that responses were more sustained during ACh application, suggesting decreased spike frequency adaptation. In the following section we will investigate the effects of ACh application on response variance within single trials and across trials. The response variability of neurons limits the resolution of the sensory system and is a different source of ‘noise’ than ongoing activity. Thus, while SNR was deteriorated, response variability might still have been reduced upon ACh application. Regularity of spiking within single trials was investigated by calculating the coefficient of variation (CV, see Materials and methods). Regularity of firing rates between trials was investigated by determining the variance of firing rates as a function of the mean.
Coefficient of variation (CV)
To demonstrate the cholinergic modulation of the spiking regularity we show an example cell in Fig. 5. The activity of the neuron in response to a bar of preferred orientation for control condition and during application of ACh is plotted in Fig. 5A. These responses yielded the ISI distributions shown in Fig. 5B. It demonstrates that the ISI distribution became sharper upon ACh application evident by the reduced CV value. A time-resolved analysis (Fig. 5C, using a moving average window with a bin width of 25 ms) demonstrated that the reduction of the CV occurred during the whole response period. It also showed that the mean ISI increased only slightly at the beginning of the response period and remained on a plateau thereafter during ACh application, while it increased more and became more unreliable under control conditions.
Fig. 5.

Interspike interval distributions (ISI) and coefficient of variation (CV). (A) Raster plot and histogram of a cell response to the preferred bar orientation when ACh was not applied (upper graph) and when ACH was applied (lower graph). Dashed vertical lines show the period from which ISI values were obtained. (B) ISI (black histograms) obtained from the raster plots shown under A. Grey curve shows a gamma function fitted to the ISI distributions. The CV decreased upon ACh application for this cell. (C) Average ISI as a function of time following response onset (black curve, left vertical axis) measured within a sliding window of 25 ms widths. Average coefficient of variation (grey curve, right vertical axis) as a function of time following response onset measured within a sliding window of 25 ms. Dots represent individual ISI durations.
We calculated the CV value as a function of ACh application for each neuron for the 500-ms response time (data not shown). Although there was considerable variation in the CV values across the population of cells, we found that CV values were significantly reduced upon ACh application for the population of neurons when averaged over the entire response period (P < 0.05, signed rank test; median CVnoACh 1.302; 25 percentile 1.097, 75 percentile 1.588; median CVnoACh 1.275; 25 percentile 1.009, 75 percentile 1.624), i.e. neurons fired significantly more regularly in the presence of ACh. This trend occurred in cells facilitated and cells inhibited by ACh, although it only reached significance in cells facilitated by ACh (P = 0.05, signed rank test, n = 68), probably due to the larger sample size (cells facilitated by ACh, median CVnoACh 1.326; 25 percentile 1.110; 75 percentile 1.565; median CVACh 1.309; 25 percentile 1.026; 75 percentile 1.580; cells inhibited by ACh, median CVnoACh 1.264; 25 percentile 1.012; 75 percentile 1.631; median CVACh 1.205; 25 percentile 0.958; 75 percentile 1.664). We did not calculate the CV for the early and late response period, because the small window size for these response periods (100 ms) in conjunction with reduced firing rates during the later response periods and a limited number of trials (15–20) often made it impossible to obtain the number of ISIs required for a reliable analysis.
Firing rate variance
The trial-to-trial variance of the neuronal response was significantly increased by the application of ACh. This was not surprising, because the variance depends on the mean firing rate, which in the majority of cells was increased upon ACh application. Thus, we tried to determine whether the increase in variance could fully be accounted for by the increased firing rate, or whether ACh on its own was a contributing factor. To this end we fitted a power function [variance = a*(meanb)] to the two data sets. We found that ACh had different effects on the relationship between mean and variance in the early response compared to the late response period. In the early response period the proportionality constant a was significantly increased during ACh application in cells facilitated and cells inhibited by ACh (facilitated cell, median ano ACh 1.113; median aACh 1.206, P = 0.006; inhibited cells, median ano AC, 0.996; median aACh 1.379; P = 0.009; signed rank test), while the power constant b was not significantly affected by ACh in either of the two cell groups (facilitated cells, median bno ACh 1.010; median bACh 1.014; P = 0.915; inhibited cells median bno ACh 1024; median bACh 1.040; P = 0.664; signed rank test). During the late response period the proportionality constant a was significantly reduced upon ACh application in facilitated cells (median ano ACh 1.949; median aACh 1.569; P = 0.009), while this reduction was not significant in inhibited cells (median ano ACh 1.795; median aACh 1.613; P = 0.657; signed rank test). The power constant b again was not significantly affected by ACh in either of the two cell groups (facilitated cells, median bno ACh 1.268; median bACh 1.220; P = 0.324; inhibited cells, median bno ACh 1175; median bACh 1.298; P = 0.081; signed rank test). This means that during the early response periods ACh caused the trial-to-trial variance to increase more than the mean firing rate, while during the sustained response period the opposite was found (although the latter was significant for facilitated cells only).
Effect of ACh on orientation tuning
ACh induced response modulation was dependent on the stimulus orientation (P < 0.05, two factor anova, Factor A, ACh application; Factor B, stimulus orientation, data not shown). Responses associated with less preferred orientations were relatively more affected than responses associated with preferred orientation stimuli. This suggests that the presence of applied ACh could also modulate the orientation tuning function. We investigated the cholinergic modulation of the tuning characteristics by different methods. These methods capture different aspects of the tuning functions, and therefore complement one another (Shapley et al., 2003).
Tuning concentration
The orientation selectivity was assessed with the calculation of the concentration. It corresponds to the tuning vector normalized by the sum of the responses as described in the Material and methods section (Batschelet, 1981; Swindale, 1998). For some cells concentration upon ACh application increased, but in general there was a trend towards decreased concentration when ACh was applied. There was, however, a difference in how concentration was affected by ACh application between facilitated cells and inhibited cells. Concentration was significantly reduced during all response periods (P < 0.01, paired t-test) for facilitated cells, while it was not significantly affected in cells inhibited upon ACh application (P > 0.05, paired t-test). This difference in significance is unlikely to be accounted for by sample size, because cells inhibited by ACh showed a trend opposite to cells facilitated by ACh during the late response period, i.e. they exhibited an increase in concentration upon ACh application. The reduction in concentration for facilitated cells indicates a relatively stronger contribution of responses to nonpreferred bars to the tuning function, thereby suggesting that the tuning function became broader upon application of ACh. This issue will be addressed in the next section. Table 1 lists the medians, and the 25 and 75 percentiles of the tuning concentration for facilitated and inhibited cells for the different response periods.
Table 1.
Tuning concentration for cells facilitated and cells inhibited by ACh during the early and late response period
| Tuning concentration |
||||||
|---|---|---|---|---|---|---|
| Facilitated cells |
Inhibited cells |
|||||
| Median | 25% | 75% | Median | 25% | 75% | |
| Early response | ||||||
| No ACh | 0.439 | 0.248 | 0.602 | 0.446 | 0.236 | 0.664 |
| ACh | 0.366 | 0.180 | 0.607 | 0.436 | 0.219 | 0.704 |
| Late response | ||||||
| No ACh | 0.429 | 0.209 | 0.630 | 0.359 | 0.224 | 0.492 |
| ACh | 0.269 | 0.169 | 0.523 | 0.411 | 0.240 | 0.611 |
Median, 25, and 75 percentiles are shown.
Data fitting with a Gaussian
By fitting a wrapped Gaussian (χ2-fitting, Press et al., 2002) to the mean neuronal response it was possible to investigate the following parameters of the orientation tuning function; tuning amplitude, full-width at half maximum (FWHM), tuning offset, and peak location. We performed fitting on the original data set and on data sets obtained by bootstrapping (see Materials and methods), thereby obtaining confidence intervals of the tuning parameter estimates. We analysed the whole response period, the early, and the late period separately. Examples for different types of effects on the tuning curves by application of ACh during the early response period are shown in Fig. 6. Figure 6A and B are examples for cells that were facilitated by ACh, Fig. 6C is an example of a cell for which responses to bars with nonpreferred orientations were facilitated, while the response to the preferred orientation was largely unaffected by ACh. The box plots below the tuning curves show confidence intervals for the tuning amplitude, FWHM, and offset derived from the bootstrapping. Tuning width was significantly affected in all three example cells. It decreased for the cell in Fig. 6A, while it increased for the cells in Fig. 6B and C. The tuning amplitude increased upon ACh application for the cells in Fig. 6A and B, but it was decreased for the example shown in Fig. 6C. Tuning offset was unaffected for the example in Fig. 6A, it was higher upon ACh application for examples B and C.
Fig. 6.

Cell examples of orientation tuning with ACh not applied and ACh applied. The upper row shows examples cells demonstrating a sharpening of the tuning curve (A), an increase of the amplitude (B), and a broadening of the tuning curve (C). Box plots underneath the tuning curves show the median (and 25, 75 percentiles) of the tuning parameters amplitude, FWHM, and offset derived from bootstrapping. P-values indicated whether the parameters of interest were significantly affected by ACh application. Grey symbols and fitted line, orientation tuning when ACh was applied. Black symbols and fitted line, orientation tuning when ACh was not applied.
An increase in amplitude, FWHM, and offset was found for the majority of cells when ACh was applied. In Fig. 7 the values of these parameters for conditions with ACh application are plotted against the values of control conditions. Changes of the tuning amplitude are shown in the upper row for the whole response period, the early and the late response period. Taking facilitated (filled symbols) and inhibited cells (open symbols) together, the tuning amplitude increased (Fig. 7A), but achieved significance only for the late response period (P = 0.005, signed rank test). If facilitated and inhibited cells were tested separately, the effect on the tuning amplitude was significant (P < 0.001) for both populations, but with opposite polarity. Amplitude on average increased for facilitated cells and decreased for inhibited cells upon ACh application. Interestingly, the change of the amplitude did not always resemble the trend of being facilitated or inhibited by the application of ACh, i.e. some cells that were facilitated by ACh nevertheless exhibited a clear lowering of their tuning amplitude. The tuning width increased during ACh application (Fig. 7B) for cells facilitated by ACh and this increase became significant for the late response period (P < 0.001, signed rank test). For inhibited cells the tuning width seemed to decrease for all response periods, but this trend did not reach significance. The offset of the tuning curve was significantly higher (Fig. 7C) for all response periods when ACh was applied (P < 0.01, signed rank test). This change was significant for facilitated cells in all response periods, but not for inhibited cells. To provide additional detail, we list in Table 2, the medians and confidence intervals for the tuning parameters during the different time periods.
Fig. 7.

Population data of orientation tuning. (A) Amplitude of the Gaussian fitted to the orientation tuning data during the three different response periods. (B) Tuning widths, FWHM of the Gaussian fitted to the orientation tuning data during the three different response periods. (C) Tuning offset of the Gaussian fitted to the orientation tuning data during the three different response periods. horizontal axis, parameters of interest when ACh was not applied, vertical axis: parameters of interest when ACh was applied. Filled symbols median (and 25, 75 percentiles) of the parameter of interest for cells facilitated by ACh determined by bootstrapping; open symbols median (and 25, 75 percentiles) of parameter of interest for cells inhibited by ACh determined by bootstrapping.
Table 2.
Orientation tuning parameters derived from fitting a Gaussian to the neuronal responses
| Median | 25% | 75% | |
|---|---|---|---|
| Whole response | |||
| Amplitude | |||
| No ACh | 22.43 | 15.44 | 33.37 |
| ACh | 23.93 | 16.77 | 39.74 |
| FWHM | |||
| No ACh | 48.72 | 34.93 | 67.91 |
| ACh | 50.11 | 36.61 | 68.66 |
| Offset | |||
| No ACh | 4.42 | 1.57 | 12.14 |
| ACh | 7.69 | 2.13 | 20.66 |
| Early response | |||
| Amplitude | |||
| No ACh | 47.06 | 32.66 | 64.95 |
| ACh | 43.28 | 28.56 | 70.06 |
| FWHM | |||
| No ACh | 50.82 | 34.86 | 66.90 |
| ACh | 52.78 | 39.25 | 63.00 |
| Offset | |||
| No ACh | 8.55 | 1.48 | 28.16 |
| ACh | 11.42 | 1.82 | 30.74 |
| Late response | |||
| Amplitude | |||
| No ACh | 18.84 | 12.49 | 28.46 |
| ACh | 22.56 | 14.00 | 35.12 |
| FWHM | |||
| No ACh | 34.54 | 24.12 | 47.65 |
| ACh | 42.41 | 25.05 | 55.02 |
| Offset | |||
| No ACh | 2.34 | 0.86 | 9.26 |
| ACh | 5.53 | 1.02 | 16.24 |
Median, 25, and 75 percentiles are shown.
Location of recording sites
We intentionally did not make electrolytic lesions at the end of recording tracks, because that would have destroyed parts of the intrinsic V1 network. This would likely have affected our results regarding the effect of ACh on intra-areal processing. We nevertheless took care to monitor our recording depth precisely. After making a small incision into the dura prior to each track, we positioned our electrode/pipette under microscope guidance such that our zero depth registration corresponded to the location where the pipette tip just touched the cortical surface. We attempted to make penetrations perpendicular to the cortical surface, thereby hoping to be able to reconstruct the depth with reasonable precision. The median recording depth of neurons that showed significant ACh effects was 700 μm (25 and 75 percentile: 350, 1062 μm; 10 and 90 percentile 200, 1430 μm). Based on these depth readings we assume that most of our recordings were confined to the upper cortical layers 2–4 (Solomon, 2002).
The absence of lesions makes a detailed assignment of ACh effects as a function of cortical layer impossible, but it is still possible to determine whether there was a significant bias of effects (significant increases vs. decreases of the parameter of interest by ACh application) to be more clustered towards superficial vs. deeper recording sites. We tested whether the depth distributions of cells that showed significant increases of the parameter of interest were significantly different from the depth distributions of cells that showed significant decreases of the parameter of interest. We found no significant difference in the depth distribution for most of the parameters that were analysed in this study (i.e. cells facilitated vs. cells inhibited by ACh application, cells that showed increased SNRs vs. cells that showed decreased SNRs, etc.). The only exception was found for the tuning amplitude during the late response period (the tuning amplitude was determined by fitting a wrapped Gaussian to the data). Cells that showed an increase in tuning amplitude during ACh application were recorded more superficially (698.7 ± 416.2 μm) than cells that showed a significant decrease in tuning amplitude (968.2 ± 679.9 μm) (P = 0.048, t-test).
Discussion
In the current paper we investigated the effects of ACh application on cortical response reliability and orientation tuning in anaesthetized primates (Callithrix jacchus). Contrary to previous reports we found neither an improvement of SNR in V1 nor a systematic sharpening of tuning functions. However, in line with previous studies we found an increase in firing rates in the majority of cells upon ACh application, especially during the late response period. Additionally we found a decrease in the variability of interspike intervals, which could point to reduced spike frequency adaptation.
We will first discuss our findings in light of previous results and what implications our findings may have for the cognitive functions frequently ascribed to ACh. We have found a surprisingly large diversity of effects at the single cell level, and this could potentially have been due to the locality of the ACh application. To account for this possibility we will then picture a network model of how affecting different circuitries could result in a variety of effects of ACh application. We will finally discuss how anaesthesia might interact with ACh application and how this might account for differences in the results between studies.
Response variability
Studies investigating the effects of ACh on neural sensitivity in cat visual cortex reported an increase in SNR upon ACh application (Sillito & Kemp, 1983; Sato et al., 1987a; Sato et al., 1987b; Murphy & Sillito, 1991), while studies in awake primates produced conflicting results (Inoue et al., 1983; Matsumura et al., 1990). It has often been suggested that the increase in SNR may be a mechanism by which ACh mediates attention, memory, learning, perception, and wakefulness (Munk et al., 1996; Davidson et al., 1999; Davidson & Marrocco, 2000; Shulz et al., 2000; Lucas-Meunier et al., 2003; Rodriguez et al., 2004). We found that ACh increased stimulus induced firing rates in the majority of neurons, but the concomitant increase in spontaneous rate resulted in decreased SNRs. This decrease was found in cells facilitated, as well as in cells inhibited, by ACh. Our results are in line with several other studies reporting ACh induced increases of the spontaneous activity (Inoue et al., 1983; Müller & Singer, 1989; Bassant et al., 1990), which is likely to have resulted in decreased SNRs. A decrease in SNRs is contrary to notions by which ACh increases stimulus representation and fidelity in the cortex to support cognitive functions such as enhanced perception during states of attention, or learning and memory.
SNR is a relatively crude measure, and we therefore investigated how the variance of firing rates between trials and the regularity of spiking within trials (the coefficient of variation of the ISI) was affected by ACh application. An increase of the trial-to-trial variance (response noise) was expected, because the variance generally increases proportionally more than the mean firing rate in V1 (Vogels et al., 1989; Snowden et al., 1992; Gur et al., 1997), and the mean firing rate was on average increased by ACh application. We found different results for the early and late response period. The trial-to-trial variance increased upon ACh application during the early response period, while it decreased slightly during the late response period. This suggests reduced trial-to-trial variability during the late/sustained response periods when levels of ACh were high, i.e. a more reliable sensory representation, which is in line with cognitive functions ascribed to ACh. This was also supported by our analysis of the variance of the firing rate within trials (CV), a measure that is based on the variance of the interspike interval distribution (Softky & Koch, 1993; Holt et al., 1996; Shadlen & Newsome, 1998; Feldmeyer et al., 1999; Reich et al., 2000). We found that the CV was reduced upon ACh application at the population level, both in cells facilitated and cells inhibited by ACh. This means that the firing patterns became more sustained and more regular when ACh was applied, indicative of reduced spike frequency adaptation probably mediated by muscarinic mechanisms (McCormick & Prince, 1986; Barkai & Hasselmo, 1994; Cox et al., 1994; Morton & Davies, 1997; Tang et al., 1997).
Effects of ACh on orientation tuning
Some studies in cat visual cortex have reported that ACh causes V1 tuning curves to sharpen (Sillito & Kemp, 1983; Sillito, 1986; Murphy & Sillito, 1991), while others failed to replicate this finding (Sato et al., 1987b; Müller & Singer, 1989). We did not find a systematic sharpening of orientation tuning functions following ACh application in the marmoset. On the contrary, we found that orientation tuning deteriorated for most of the cells when ACh was applied. However, we noted different trends for cells facilitated and cells inhibited by ACh. Tuning width was increased in cells facilitated by ACh, particularly during the late response period, while cells inhibited by ACh showed a trend towards sharpened tuning functions upon ACh application, although this trend did not reach significance. The increase of tuning width in facilitated cells could have been due to response saturation, but if this was the case we would expect the effect to be largest during the phasic response period, not during the sustained period. This result was corroborated by determination of tuning concentration, a method which allows the investigation of the strength of the tuning, while simultaneously taking potential wide angle responses into account (Ringach et al., 2003; Shapley et al., 2003). We found that concentration was reduced by ACh application in facilitated cells during all response periods, while it was not affected in cells inhibited by ACh.
The origin of orientation tuning in primary visual cortex and its mediation remains a matter of debate. Originally it was proposed that properly aligned thalamocortical connections mediate orientation tuning in V1 (Hubel & Wiesel, 1968; reviewed in Ferster & Miller, 2000), while others argue that inhibitory intracortical mechanisms make at least some important contributions (Sato et al., 1996; Crook et al., 1998; Monier et al., 2003; Shapley et al., 2003). Cholinergic mechanisms are thought to dynamically control the synaptic efficacy of thalamo-cortical and cortico-cortical connections, with thalamo-cortical connections becoming more dominant when levels of ACh are high (Hasselmo & Bower, 1992; Metherate & Ashe, 1993; Barkai & Hasselmo, 1994; Hasselmo, 1995; Gil et al., 1997; Kimura & Baughman, 1997; Kimura et al., 1999; Hsieh et al., 2000; Kimura, 2000). Thus, if intracortical inhibitory mechanisms contribute to the sharpness of orientation tuning, high levels of ACh should result in wider tuning functions, which we indeed found. The differences were relatively small, but significant at the population level, arguing that intracortical mechanisms contribute to the sharpening of orientation tuning. This result may seem at odds with our recent report about enhancement of spatial selectivity, i.e. narrowing of the spatial tuning function (Roberts et al., 2005). However, the effect of ACh on tuning properties will depend on the intracortical contribution towards the tuning parameter under investigation. If intracortical mechanisms cause a sharpening of tuning, as is apparently the case for orientation tuning, then high levels of ACh will result in wider tuning functions. If, on the other hand, intracortical mechanisms mediate integration (as, e.g. in spatial integration), causing a widening of the tuning function, then high levels of ACh will cause a sharpening.
If intracortical processes contribute to the shape of the tuning function, ACh could interfere with these processes and reduce their impact. ACh could affect inhibitory interneurons via two complementary mechanisms. First ACh could activate presynaptic muscarinic receptors at GABAergic synapses and so reduce their transmission (Krnjevic et al., 1981; Kimura & Baughman, 1997). Second ACh could suppress the intracortical excitatory synapses, which activate the interneurons. Both mechanism would result in a reduced inhibitory drive and thereby could diminish the sharpening of the orientation tuning curves.
Multitude of ACh effects
In the current study we mainly found an increase in firing rate, which is compatible with depolarization and diminished spike frequency adaptation, probably mediated by muscarinic mechanisms (McCormick & Prince, 1986; McCormick, 1992). However, we found no systematic effects on tuning and stimulus selectivity. This could occur if the network effect of ACh strongly depended on the location of the injection site. ACh can exert a multitude of effects at pre- and postsynaptic sites. Thus the specific effect seen at the individual cell may vary depending on the spread of ACh and on the location of the injection pipette. The complexity of network interactions within V1 prohibits a comprehensive analysis of how applying ACh to different locations within the network could influence the responses of a given cell. However, using a simplified network of V1 it is possible to demonstrate how the application of ACh at random locations could have different effects on the response of single cells. Given that the large majority of recording sites were in layers 2–4, we will focus on possible effects to neurons in those layers. We present a picture of V1 connections and an overview of cholinergic receptors found on the cells and their terminals in Fig. 8. The cellular network itself is based on published V1 models (Callaway, 1998; Binzegger et al., 2004; Douglas & Martin, 2004).
Fig. 8.

Schematic representation of the V1 cellular network and its modulation by ACh. Cell bodies are symbolized by filled circles or triangles, dendrites by bars, axonal terminal zones by transparent ellipsoids. Lateral intracortical connections are symbolized by purple horizontal lines (on which presynaptic muscarinic receptors are located (grey boxes). In addition the axonal terminal zones could also be populated by these receptors (not shown for clarity). Thalamocortical terminals are symbolized by vertical blue lines. Nicotinic presynaptic receptors located on these terminals are shown as black triangles. Postsynaptic receptors can be located on the soma or the dendrites, but are shown on somas exclusively for simplicity. The omission of receptors on some cell bodies was also performed for clarity. Most of the recordings in our study were from supragranular layers (electrode position). ACh applied to layer 1 interneurons (l1) would increase the excitability of pyramidal cells (p2/3) by inhibiting layer 2/3 (b2/3) interneurons (Christophe et al., 2002). In layer 2/3 ACh activates muscarinic receptors on pyramidal cells causing cell depolarization, increased excitability, and reduced spike frequency adaptation (McCormick & Prince, 1985; Mrzljak et al., 1996). A simultaneous activation of muscarinic receptors located on interneurons would counteract the depolarization of the pyramidal cell, due to increased GABAergic inhibition (McCormick & Prince, 1985; but note that hyperpolarization of interneurons can also occur Xiang et al., 1998). Postsynaptic M2 muscarinic receptors on layer 4 cells decrease the excitability of layer 4 neurons (Mrzljak et al., 1996), thereby possibly reducing the excitatory feed forward drive to layer 2/3 pyramidal cells. Presynaptic muscarinic receptors in most layers reduce the efficacy of lateral excitatory (M2, M4) and inhibitory (M1) connections resulting in decreased intracortical integration (Mrzljak et al., 1996; Gil et al., 1997; Kimura & Baughman, 1997; Hsieh et al., 2000; Kimura, 2000). Nicotinic receptors in layer 4 of primate V1 boost the synaptic efficacy of thalamocortical connections, increasing the relative efficacy of feed-forward signals (Vidal & Changeux, 1993; Gil et al., 1997; Gioanni et al., 1999). Postsynaptic nicotinic receptors are mostly confined to regular and irregular spiking interneurons in layer 2/3 (Porter et al., 1999; Alkondon et al., 2000; Christophe et al., 2002; Metherate, 2004; but see Roerig et al., 1997), where they increase the inhibitory drive within the network, resulting in inhibition of pyramidal cells, as well as disinhibition (Alkondon et al., 2000). The schema highlights the diversity of receptors at different locations, their effects, and their specificity dependent on localization. As a result application of ACh has a variety of effects, depending on whether application is local, or whether the whole network is affected. l1, interneuron from layer 1; db, double bouquet cell; b, basket cell; p, pyramidal cell; ss, spiny stellate cell; LTS, low threshold spiking interneuron; numbers refer to the location of the cell body.
When the spread of the application is very restricted, a pyramidal cell layer 2/3 pyramidal cell would become depolarized via the activation of somatic muscarinic receptors due to decreased membrane conductance for K+ (McCormick & Prince, 1986). As a consequence the spontaneous and stimulus driven activity of the cell would increase. A proportional increase in stimulus driven activity may not be possible due to the possibility of saturation of firing rates. As a result a decrease in SNR is predicted, which is what we found in a substantial fraction of cells (Fig. 4). These (local) changes would also reduce spike frequency adaptation and thus increase the modulation index, also in line with our findings (Fig. 3). If orientation tuning was largely mediated by feed-forward mechanisms (Ferster, 1986, 1987), the described ACh scenario could additionally result in reduced orientation tuning (widening of the tuning function), as the drive of a preferred stimulus could result in saturated firing levels, and nonpreferred orientations could induce proportionally larger increases in firing rates.
If we recorded from the same cell, but assumed a larger spread of ACh then surrounding cells would also be influenced by ACh. ACh would still have the direct effects on the layer 2/3 pyramidal cell as described above, but in addition could activate regular spiking and irregular spiking interneurons in layer 2/3 (Porter et al., 1999; Alkondon et al., 2000) by nicotinic mechanisms. These could inhibit the layer 2/3 pyramidal cell, thereby reducing (or abolishing) the muscarinic effects on spontaneous and stimulus driven activity, resulting in overall reduced activity levels, as seen in a subset of cells. If the spread of ACh was sufficiently large to reach presynaptic receptors on thalamo-cortical terminals the stimulus related excitatory drive would increase (Gil et al., 1997), possibly rendering the inhibition ineffective during stimulus presentation and so result in increased SNR level. The combination of increased inhibitory and excitatory drives could result in a nonlinearity by which only the strongest inputs (those from the preferred stimulus) get boosted, resulting in a sharpening of the orientation tuning curve. The spread of ACh to the cell's dendrite would reduce the synaptic efficacy of excitatory lateral integration (probably through muscarinic M4 mechanisms, Kimura & Baughman, 1997). If the excitatory lateral connections were predominantly from neurons with similar preferred orientations, a reduction of their efficacy would result in reduced orientation tuning (as nonpreferred orientation input might be relatively increased). If, however, the lateral connections were predominantly from neurons with different preferred orientations, a reduction of their efficacy would result in narrower orientation tuning. Inhibitory lateral connections are also reduced by muscarinic mechanisms (probably mediated by presynaptic M1 receptors, Kimura & Baughman, 1997). Inhibitory mechanisms are likely to contribute to orientation tuning, in addition to ordered feed-forward input (Sillito, 1975, 1979; Allison et al., 1995; Allison et al., 1996; Sato et al., 1996; Crook et al., 1997, 1998; Ringach et al., 2002; Ringach et al., 2003; Shapley et al., 2003). A reduction of inhibitory synaptic efficacy could thus result in broader orientation tuning. Inhibitory interneurons are interconnected, thus an increased inhibitory drive due to nicotinic ACh activation can result in disinhibition of pyramidal cells (Alkondon et al., 2000; Christophe et al., 2002), thereby opening the possibility for many more effects on SNR and tuning properties in V1 cells.
A whole variety of different scenarios can be deduced from Fig. 8. It may be that some of the effects seen in our study were due to very local application, while other effects could have been due to effects on larger parts of the network. Consequentially, some of the results, which appear to contradict previous studies (Sillito & Kemp, 1983; Sato et al., 1987b; Sillito & Murphy, 1987) could be explained by the locality of application, and/or by the use of different anaesthetic agents (see next paragraph).
Interaction with anaesthesia
The experiments reported here were performed under Propofol anaesthesia, which mediates its anaesthetic effects primarily through a GABAergic mechanisms (Alkire & Haier, 2001). We have initially performed experiments under halothane anaesthesia (at 0.6–1.2%). In those experiments (four marmosets, > 100 cells recorded) we were unable to detect any significant effects of ACh application on the neuronal activity. Volatile anaesthetics, such as halothane, mediate their effects through blockade of muscarinic (Anthony et al., 1989; Seeman & Kapur, 2003) and nicotinic mechanisms (Tassonyi et al., 2002), and the lack of effects is therefore not entirely surprising as high levels of anaesthetics were used. We decided to use halothane as our first choice, because previous studies in cat primary visual cortex have used halothane anaesthesia (Sato et al., 1987b; Murphy & Sillito, 1991), albeit at a substantially lower level during the recording (0.1–0.5%). Although Propofol can also directly affect the cholinergic system, it is assumed that these effects occur mostly at quantities exceeding those necessary for adequate anaesthesia (Nagase et al., 1999; Alkire & Haier, 2001). Given the difference in anaesthetic regime between our study, and previous studies in cat visual cortex some of the discrepancies could potentially be related to the different anaesthesia regimes. This shows that studying cholinergic mechanisms in anaesthetized animals is problematic, because most of the anaesthetics used interfere with the cholinergic system directly or indirectly (reviewed in Backman et al., 2004). Therefore to validate the effects of cholinergic modulation and to exclude interaction with the anaesthetics it will be necessary to perform experiments, similar to those described here, but in the awake preparation. This would allow investigating the contribution of cholinergic mechanisms to attention, memory, or even consciousness, which are unlikely to be revealed in anaesthetized preparations. We are currently performing such experiments.
Conclusions and potential implications
In line with previous reports we found that application of ACh results mostly in increased stimulus driven and spontaneous firing rates. Contrary to previous in vivo studies the proportionally larger increase in spontaneous firing rate resulted in a reduced SNR, provided that spontaneous activity is considered noise. Such a reduction would reduce the information transmitted under high ACh, contradicting a generally held view. We also found an increase in trial-to-trial variance upon ACh application, but this increase was slightly smaller than expected given the concomitant increase in firing rate. Interspike intervals variation was reduced upon ACh application. The latter two results could be interpreted as an ability of increased information transmission when levels of ACh are high, but they somewhat contradict our finding of a reduced SNR. Orientation tuning was slightly wider upon ACh application, but the main effect of ACh on orientation tuning was a gain modulation, somewhat reminiscent of attentional effects reported for macaque area V4 and V1 (McAdams & Maunsell, 1999). Based on the similarity to attentional modulation and potentially increased information transmission it is tempting to suggest that ACh in visual cortical areas is an important permissive agent contributing to attentional modulation.
Acknowledgements
We would like to thank M. P. Nawrot, J. Rickert, A. Aertsen, and A. Nevado, and two anonymous reviewers for valuable discussions and comments on the manuscript. The academic and technical staff of the Comparative Biology Centre (University of Newcastle upon Tyne) provided excellent technical support. The work was supported by the Wellcome Trust (070380/Z/03/Z), and the Medical Research Council UK (G0100407; G78/7853). W. Z. was supported by the DAAD to conduct these experiments as part of the requirements for his diploma thesis at the University of Freiburg.
Abbreviations
- ACh
acetylcholine
- CV
coefficient of variation
- FWHM
full-width at half maximum
- ISI
interspike-interval
- LGN
lateral geniculate nucleus
- MI
modulation index
- SNR
signal-to-noise ratio
- TI
tonicity index
- V1
primary visual cortex
References
- Alkire MT, Haier RJ. Correlating in vivo anaesthetic effects with ex vivo receptor density data supports a GABAergic mechanism of action for propofol, but not for isoflurane. Br. J. Anaesth. 2001;86:618–626. doi: 10.1093/bja/86.5.618. [DOI] [PubMed] [Google Scholar]
- Alkondon M, Pereira EF, Eisenberg HM, Albuquerque EX. Nicotinic receptor activation in human cerebral cortical interneurons: a mechanism for inhibition and disinhibition of neuronal networks. J. Neurosci. 2000;20:66–75. doi: 10.1523/JNEUROSCI.20-01-00066.2000. [DOI] [PMC free article] [PubMed] [Google Scholar]
- Allison JD, Casagrande VA, Bonds AB. The influence of input from the lower cortical layers on the orientation tuning of upper layer V1 cells in a primate. Vis. Neurosci. 1995;12:309–320. doi: 10.1017/s0952523800007999. [DOI] [PubMed] [Google Scholar]
- Allison JD, Kabara JF, Snider RK, Casagrande VA, Bonds AB. GABAB-receptor-mediated inhibition reduces the orientation selectivity of the sustained response of striate cortical neurons in cats. Vis. Neurosci. 1996;13:559–566. doi: 10.1017/s0952523800008233. [DOI] [PubMed] [Google Scholar]
- Anderson JS, Carandini M, Ferster D. Orientation tuning of input conductance, excitation, and inhibition in cat primary visual cortex. J. Neurophysiol. 2000;84:909–926. doi: 10.1152/jn.2000.84.2.909. [DOI] [PubMed] [Google Scholar]
- Anthony BL, Dennison RL, Aronstam RS. Disruption of muscarinic receptor-G protein coupling is a general property of liquid volatile anesthetics. Neurosci. Lett. 1989;99:191–196. doi: 10.1016/0304-3940(89)90288-7. [DOI] [PubMed] [Google Scholar]
- Backman SB, Fiset P, Plourde G. Cholinergic mechanisms mediating anesthetic induced altered states of consciousness. Prog. Brain Res. 2004;145:197–206. doi: 10.1016/S0079-6123(03)45014-0. [DOI] [PubMed] [Google Scholar]
- Barkai E, Hasselmo ME. Modulation of the input/output function of rat piriform cortex pyramidal cells. J. Neurophysiol. 1994;72:644–658. doi: 10.1152/jn.1994.72.2.644. [DOI] [PubMed] [Google Scholar]
- Barlow HB, Blakemore C, Pettigrew JD. The neural mechanism of binocular depth discrimination. J. Physiol. 1967;193:327–342. doi: 10.1113/jphysiol.1967.sp008360. [DOI] [PMC free article] [PubMed] [Google Scholar]
- Bassant MH, Baleyte JM, Lamour Y. Effects of acetylcholine on single cortical somatosensory neurons in the unanesthetized rat. Neuroscience. 1990;39:189–197. doi: 10.1016/0306-4522(90)90232-s. [DOI] [PubMed] [Google Scholar]
- Batschelet E. Circular Statistics in Biology. New York, NY: Academic Press Inc; 1981. [Google Scholar]
- Binzegger T, Douglas RJ, Martin KA. A quantitative map of the circuit of cat primary visual cortex. J. Neurosci. 2004;24:8441–8453. doi: 10.1523/JNEUROSCI.1400-04.2004. [DOI] [PMC free article] [PubMed] [Google Scholar]
- Callaway EM. Local circuits in primary visual cortex in the macaque monkey. Annu. Rev. Neurosci. 1998;21:47–74. doi: 10.1146/annurev.neuro.21.1.47. [DOI] [PubMed] [Google Scholar]
- Chapman B, Stryker MP. Origin of orientation tuning in the visual cortex. Curr. Opin. Neurobiol. 1992;2:498–501. doi: 10.1016/0959-4388(92)90186-o. [DOI] [PubMed] [Google Scholar]
- Chapman B, Zahs KR, Stryker MP. Relation of cortical cell orientation selectivity to alignment of receptive fields of the geniculocortical afferents that arborize within a single orientatio column in ferret visual cortex. J. Neurosci. 1991;11:1347–1358. doi: 10.1523/JNEUROSCI.11-05-01347.1991. [DOI] [PMC free article] [PubMed] [Google Scholar]
- Christophe E, Roebuck A, Staiger JF, Lavery DJ, Charpak S, Audinat E. Two types of nicotinic receptors mediate an excitation of neocortical layer I interneurons. J. Neurophysiol. 2002;88:1318–1327. doi: 10.1152/jn.2002.88.3.1318. [DOI] [PubMed] [Google Scholar]
- Cox CL, Metherate R, Ashe JH. Modulation of cellular excitability in neocortex: muscarinic receptor and second messenger-mediated actions of acetylcholine. Synapse. 1994;16:123–136. doi: 10.1002/syn.890160206. [DOI] [PubMed] [Google Scholar]
- Crook JM, Kisvarday ZF, Eysel UT. GABA-induced inactivation of functionally characterized sites in cat striate cortex: effects on orientation tuning and direction selectivity. Vis. Neurosci. 1997;14:141–158. doi: 10.1017/s095252380000883x. [DOI] [PubMed] [Google Scholar]
- Crook JM, Kisvarday ZF, Eysel UT. Evidence for a contribution of lateral inhibition to orientation tuning and direction selectivity in cat visual cortex: reversible inactivation of functionally characterized sites combined with neuroanatomical tracing techniques. Eur. J. Neurosci. 1998;10:2056–2075. doi: 10.1046/j.1460-9568.1998.00218.x. [DOI] [PubMed] [Google Scholar]
- Davidson MC, Cutrell EB, Marrocco RT. Scopolamine slows the orienting of attention in primates to cued visual targets. Psychopharmacology (Berl) 1999;142:1–8. doi: 10.1007/s002130050855. [DOI] [PubMed] [Google Scholar]
- Davidson MC, Marrocco RT. Local infusion of scopolamine into intraparietal cortex slows covert orienting in rhesus monkeys. J. Neurophysiol. 2000;83:1536–1549. doi: 10.1152/jn.2000.83.3.1536. [DOI] [PubMed] [Google Scholar]
- Douglas RJ, Martin KA. Neuronal circuits of the neocortex. Annu. Rev. Neurosci. 2004;27:419–451. doi: 10.1146/annurev.neuro.27.070203.144152. [DOI] [PubMed] [Google Scholar]
- Feldmeyer D, Egger V, Lubke J, Sakmann B. Reliable synaptic connections between pairs of excitatory layer 4 neurones within a single ‘barrel’ of developing rat somatosensory cortex. J. Physiol. 1999;521:169–190. doi: 10.1111/j.1469-7793.1999.00169.x. [DOI] [PMC free article] [PubMed] [Google Scholar]
- Ferster D. Orientation selectivity of synaptic potentials in neurons of cat primary visual cortex. J. Neurosci. 1986;6:1284–1301. doi: 10.1523/JNEUROSCI.06-05-01284.1986. [DOI] [PMC free article] [PubMed] [Google Scholar]
- Ferster D. Origin of orientation-selective EPSPs in simple cells of cat visual cortex. J. Neurosci. 1987;7:1780–1791. doi: 10.1523/JNEUROSCI.07-06-01780.1987. [DOI] [PMC free article] [PubMed] [Google Scholar]
- Ferster D, Miller KD. Neural mechanisms of orientation selectivity in the visual cortex. Annu. Rev. Neurosci. 2000;23:441–471. doi: 10.1146/annurev.neuro.23.1.441. [DOI] [PubMed] [Google Scholar]
- Friedman HS, Priebe CE. Estimating stimulus response latency. J. Neurosci. Meth. 1998;83:185–194. doi: 10.1016/s0165-0270(98)00075-2. [DOI] [PubMed] [Google Scholar]
- Gawne TJ, Kjaer TW, Richmond BJ. Latency: another potential code for feature binding in striate cortex. J. Neurophysiol. 1996;76:1356–1360. doi: 10.1152/jn.1996.76.2.1356. [DOI] [PubMed] [Google Scholar]
- Gil Z, Connors BW, Amitai Y. Differential regulation of neocortical synapses by neuromodulators and activity. Neuron. 1997;19:679–686. doi: 10.1016/s0896-6273(00)80380-3. [DOI] [PubMed] [Google Scholar]
- Gioanni Y, Rougeot C, Clarke PB, Lepouse C, Thierry AM, Vidal C. Nicotinic receptors in the rat prefrontal cortex: increase in glutamate release and facilitation of mediodorsal thalamo-cortical transmission. Eur. J. Neurosci. 1999;11:18–30. doi: 10.1046/j.1460-9568.1999.00403.x. [DOI] [PubMed] [Google Scholar]
- Gur M, Beylin A, Snodderly DM. Response variability of neurons in primary visual cortex (V1) of alert monkeys. J. Neurosci. 1997;17:2914–2920. doi: 10.1523/JNEUROSCI.17-08-02914.1997. [DOI] [PMC free article] [PubMed] [Google Scholar]
- Hasselmo ME. Neuromodulation and cortical function: Modeling the physiological basis of behavior. Behav. Brain Res. 1995;67:1–27. doi: 10.1016/0166-4328(94)00113-t. [DOI] [PubMed] [Google Scholar]
- Hasselmo ME, Bower JM. Cholinergic suppression specific to intrinsic not afferent fiber synapses in rat piriform (olfactory) cortex. J. Neurophysiol. 1992;67:1222–1229. doi: 10.1152/jn.1992.67.5.1222. [DOI] [PubMed] [Google Scholar]
- Holt GR, Softky WR, Koch C, Douglas RJ. Comparison of discharge variability in vitro and in vivo in cat visual cortex neurons. J. Neurophysiol. 1996;75:1806–1814. doi: 10.1152/jn.1996.75.5.1806. [DOI] [PubMed] [Google Scholar]
- Hsieh CY, Cruikshank SJ, Metherate R. Differential modulation of auditory thalamocortical and intracortical synaptic transmission by cholinergic agonist. Brain Res. 2000;880:51–64. doi: 10.1016/s0006-8993(00)02766-9. [DOI] [PubMed] [Google Scholar]
- Hubel DH, Wiesel TN. Receptive fields, binocular interaction and functional architecture in the cat's visual cortex. J. Physiol. 1962;160:106–154. doi: 10.1113/jphysiol.1962.sp006837. [DOI] [PMC free article] [PubMed] [Google Scholar]
- Hubel DH, Wiesel TN. Receptive fields and functional architecture of monkey striate cortex. J. Physiol. 1968;195:215–243. doi: 10.1113/jphysiol.1968.sp008455. [DOI] [PMC free article] [PubMed] [Google Scholar]
- Inoue M, Oomura Y, Nishino H, Aou S, Sikdar SK, Hynes M, Mizuno Y, Katabuchi T. Cholinergic role in monkey dorsolateral prefrontal cortex during bar-press feeding behavior. Brain Res. 1983;278:185–194. doi: 10.1016/0006-8993(83)90237-8. [DOI] [PubMed] [Google Scholar]
- Kimura F. Cholinergic modulation of cortical function: a hypothetical role in shifting the dynamics in cortical network. Neurosci. Res. 2000;38:19–26. doi: 10.1016/s0168-0102(00)00151-6. [DOI] [PubMed] [Google Scholar]
- Kimura F, Baughman RW. Distinct muscarinic receptor subtypes suppress excitatory and inhibitory synaptic responses in cortical neurons. J. Neurophysiol. 1997;77:709–716. doi: 10.1152/jn.1997.77.2.709. [DOI] [PubMed] [Google Scholar]
- Kimura F, Fukuda M, Tsumoto T. Acetylcholine suppresses the spread of excitation in the visual cortex revealed by optical recording: possible differential effect depending on the source of input. Eur. J. Neurosci. 1999;11:3597–3609. doi: 10.1046/j.1460-9568.1999.00779.x. [DOI] [PubMed] [Google Scholar]
- Krnjevic K, Reiffenstein RJ, Ropert N. Disinhibitory action of acetylcholine in the rat's hippocampus: extracellular observations. Neuroscience. 1981;6:2465–2474. doi: 10.1016/0306-4522(81)90092-0. [DOI] [PubMed] [Google Scholar]
- Liu YH, Wang XJ. Spike-frequency adaptation of a generalized leaky integrate-and-fire model neuron. J. Comput. Neurosci. 2001;10:25–45. doi: 10.1023/a:1008916026143. [DOI] [PubMed] [Google Scholar]
- Lucas-Meunier E, Fossier P, Baux G, Amar M. Cholinergic modulation of the cortical neuronal network. Pflugers Arch. 2003;446:17–29. doi: 10.1007/s00424-002-0999-2. [DOI] [PubMed] [Google Scholar]
- Maffei L, Fiorentini A. The unresponsive regions of visual cortical receptive fields. Vis. Res. 1976;16:1131–1139. doi: 10.1016/0042-6989(76)90253-4. [DOI] [PubMed] [Google Scholar]
- Matsumura M, Sawaguchi T, Kubota K. Modulation of neuronal activities by iontophoretically applied catecholamines and acetylcholine in the primate motor cortex during a visual reaction-time task. Neurosci. Res. 1990;8:138–145. doi: 10.1016/0168-0102(90)90066-n. [DOI] [PubMed] [Google Scholar]
- McAdams CJ, Maunsell JHR. Effects of attention on orientation tuning functions of single neurons in macaque cortical area V4. J. Neurosci. 1999;19:431–441. doi: 10.1523/JNEUROSCI.19-01-00431.1999. [DOI] [PMC free article] [PubMed] [Google Scholar]
- McCormick DA. Cellular mechanisms underlying cholinerigic and noradrenergic modulation of neuronal firing mode in the cat and guinea pig dorsal lateral geniculate nucleus. J. Neurosci. 1992;12:278–289. doi: 10.1523/JNEUROSCI.12-01-00278.1992. [DOI] [PMC free article] [PubMed] [Google Scholar]
- McCormick DA, Prince DA. Two types of muscarinic response to acetylcholine in mammalian cortical neurons. Proc. Natl Acad. Sci. USA. 1985;82:6344–6348. doi: 10.1073/pnas.82.18.6344. [DOI] [PMC free article] [PubMed] [Google Scholar]
- McCormick DA, Prince DA. Mechanisms of action of acetylcholine in the guinea-pig cerebral cortex in vitro. J. Physiol. 1986;375:169–194. doi: 10.1113/jphysiol.1986.sp016112. [DOI] [PMC free article] [PubMed] [Google Scholar]
- Metherate R. Nicotinic acetylcholine receptors in sensory cortex. Learn. Mem. 2004;11:50–59. doi: 10.1101/lm.69904. [DOI] [PubMed] [Google Scholar]
- Metherate R, Ashe JH. Nucleus basalis stimulation facilitates thalamocortical synaptic transmission in the rat auditory cortex. Synapse. 1993;14:132–143. doi: 10.1002/syn.890140206. [DOI] [PubMed] [Google Scholar]
- Monier C, Chavane F, Baudot P, Graham LJ, Fregnac Y. Orientation and direction selectivity of synaptic inputs in visual cortical neurons: a diversity of combinations produces spike tuning. Neuron. 2003;37:663–680. doi: 10.1016/s0896-6273(03)00064-3. [DOI] [PubMed] [Google Scholar]
- Morton RA, Davies CH. Regulation of muscarinic acetylcholine receptor-mediated synaptic responses by adenosine receptors in the rat hippocampus. J. Physiol. 1997;502:75–90. doi: 10.1111/j.1469-7793.1997.075bl.x. [DOI] [PMC free article] [PubMed] [Google Scholar]
- Mrzljak L, Levey AI, Rakic P. Selective expression of m2 muscarinic receptor in the parvocellular channel of the primate visual cortex. Proc. Natl Acad. Sci. USA. 1996;93:7337–7340. doi: 10.1073/pnas.93.14.7337. [DOI] [PMC free article] [PubMed] [Google Scholar]
- Müller CM, Singer W. Acetylcholine-induced inhibition in the cat visual cortex is mediated by a GABAergic mechanism. Brain Res. 1989;487:335–342. doi: 10.1016/0006-8993(89)90837-8. [DOI] [PubMed] [Google Scholar]
- Munk MHJ, Roelfsma PR, König P, Engel AK, Singer W. Role of reticular activation in the modulation of intracortical synchronization. Science. 1996;272:271–274. doi: 10.1126/science.272.5259.271. [DOI] [PubMed] [Google Scholar]
- Murakoshi T. Cholinergic modulation of synaptic transmission in the rat visual cortex in vitro. Vis. Res. 1995;35:25–35. doi: 10.1016/0042-6989(94)e0056-q. [DOI] [PubMed] [Google Scholar]
- Murphy PC, Sillito AM. Cholinergic enhancement of direction selectivity in the visual cortex of the cat. Neuroscience. 1991;40:13–20. doi: 10.1016/0306-4522(91)90170-s. [DOI] [PubMed] [Google Scholar]
- Nagase Y, Kaibara M, Uezono Y, Izumi F, Sumikawa K, Taniyama K. Propofol inhibits muscarinic acetylcholine receptor-mediated signal transduction in Xenopus oocytes expressing the rat M1 receptor. Jpn J. Pharmacol. 1999;79:319–325. doi: 10.1254/jjp.79.319. [DOI] [PubMed] [Google Scholar]
- Nawrot M, Aertsen A, Rotter S. Single-trial estimation of neuronal firing rates: from single-neuron spike trains to population activity. J. Neurosci. Meth. 1999;94:81–92. doi: 10.1016/s0165-0270(99)00127-2. [DOI] [PubMed] [Google Scholar]
- Porter JT, Cauli B, Tsuzuki K, Lambolez B, Rossier J, Audinat E. Selective excitation of subtypes of neocortical interneurons by nicotinic receptors. J. Neurosci. 1999;19:5228–5235. doi: 10.1523/JNEUROSCI.19-13-05228.1999. [DOI] [PMC free article] [PubMed] [Google Scholar]
- Press WH, Teukolsky SA, Vetterling WT, Flannery BP. Numerical Recip. Cambridge: Cambridge University Press; 2002. [Google Scholar]
- Reich DS, Mechler F, Purpura KP, Victor JD. Interspike intervals, receptive fields, and information encoding in primary visual cortex. J. Neurosci. 2000;20:1964–1974. doi: 10.1523/JNEUROSCI.20-05-01964.2000. [DOI] [PMC free article] [PubMed] [Google Scholar]
- Reid RC, Alonso JM. Specificity of monosynaptic connections from thalamus to visual cortex. Nature. 1995;378:281–284. doi: 10.1038/378281a0. [DOI] [PubMed] [Google Scholar]
- Richter M, Schilling T, Muller W. Muscarinic control of intracortical connections to layer II in rat entorhinal cortex slice. Neurosci. Lett. 1999;273:200–202. doi: 10.1016/s0304-3940(99)00643-6. [DOI] [PubMed] [Google Scholar]
- Ringach DL, Bredfeldt CE, Shapley RM, Hawken MJ. Suppression of neural responses to nonoptimal stimuli correlates with tuning selectivity in macaque V1. J. Neurophysiol. 2002;87:1018–1027. doi: 10.1152/jn.00614.2001. [DOI] [PubMed] [Google Scholar]
- Ringach DL, Hawken MJ, Shapley R. Dynamics of orientation tuning in macaque V1: the role of global and tuned suppression. J. Neurophysiol. 2003;90:342–352. doi: 10.1152/jn.01018.2002. [DOI] [PubMed] [Google Scholar]
- Roberts MJ, Zinke W, Guo K, Robertson R, McDonald JS, Thiele A. Acetylcholine dynamically controls spatial integration in marmoset primary visual cortex. J. Neurophysiol. 2005;93:2062–2072. doi: 10.1152/jn.00911.2004. [DOI] [PMC free article] [PubMed] [Google Scholar]
- Rodriguez R, Kallenbach U, Singer W, Munk MH. Short- and long-term effects of cholinergic modulation on gamma oscillations and response synchronization in the visual cortex. J. Neurosci. 2004;24:10369–10378. doi: 10.1523/JNEUROSCI.1839-04.2004. [DOI] [PMC free article] [PubMed] [Google Scholar]
- Roerig B, Nelson DA, Katz LC. Fast synaptic signaling by nicotinic acetylcholine and serotonin 5-HT3 receptors in developing visual cortex. J. Neurosci. 1997;17:8353–8362. doi: 10.1523/JNEUROSCI.17-21-08353.1997. [DOI] [PMC free article] [PubMed] [Google Scholar]
- Sato H, Hata Y, Hagihara K, Tsumoto T. Effects of cholinergic depletion on neuron activities in the cat visual cortex. J. Neurophysiol. 1987a;58:781–794. doi: 10.1152/jn.1987.58.4.781. [DOI] [PubMed] [Google Scholar]
- Sato H, Hata Y, Masui H, Tsumoto T. A functional role of cholinergic innervation to neurons in the cat visual cortex. J. Neurophysiol. 1987b;58:765–780. doi: 10.1152/jn.1987.58.4.765. [DOI] [PubMed] [Google Scholar]
- Sato H, Katsuyama N, Tamura H, Hata Y, Tsumoto T. Mechanisms underlying orientation selectivity of neurons in the primary visual cortex of the macaque. J. Physiol. (Lond.) 1996;494:757–771. doi: 10.1113/jphysiol.1996.sp021530. [DOI] [PMC free article] [PubMed] [Google Scholar]
- Schiller PH, Finlay BL, Volman SF. Quantitative studies of single-cell properties in monkey striate cortex. II. Orientation specificity and ocular dominance. J. Neurophysiol. 1976;39:1320–1333. doi: 10.1152/jn.1976.39.6.1320. [DOI] [PubMed] [Google Scholar]
- Seeman P, Kapur S. Anesthetics inhibit high-affinity states of dopamine D2 and other G-linked receptors. Synapse. 2003;50:35–40. doi: 10.1002/syn.10221. [DOI] [PubMed] [Google Scholar]
- Shadlen MN, Newsome WT. The variable discharge of cortical neurons: Implications for connectivity, computation and information coding. J. Neurosci. 1998;18:3870–3896. doi: 10.1523/JNEUROSCI.18-10-03870.1998. [DOI] [PMC free article] [PubMed] [Google Scholar]
- Shapley R, Hawken M, Ringach DL. Dynamics of orientation selectivity in the primary visual cortex and the importance of cortical inhibition. Neuron. 2003;38:689–699. doi: 10.1016/s0896-6273(03)00332-5. [DOI] [PubMed] [Google Scholar]
- Shulz DE, Sosnik R, Ego V, Haidarliu S, Ahissar E. A neuronal analogue of state-dependent learning. Nature. 2000;403:549–553. doi: 10.1038/35000586. [DOI] [PubMed] [Google Scholar]
- Sillito AM. The contribution of inhibitory mechanisms to the receptive field properties of neurones in the striate cortex of the cat. J. Physiol. 1975;250:305–329. doi: 10.1113/jphysiol.1975.sp011056. [DOI] [PMC free article] [PubMed] [Google Scholar]
- Sillito AM. Inhibitory mechanisms influencing complex cell orientation selectivity and their modification at high resting discharge levels. J. Physiol. 1979;289:33–53. doi: 10.1113/jphysiol.1979.sp012723. [DOI] [PMC free article] [PubMed] [Google Scholar]
- Sillito AM. Visual cortex. Cholinergic input and plasticity? Nature. 1986;320:109–110. doi: 10.1038/320109a0. [DOI] [PubMed] [Google Scholar]
- Sillito AM, Kemp JA. Cholinergic modulation of the functional organization of the cat visual cortex. Brain Res. 1983;289:143–155. doi: 10.1016/0006-8993(83)90015-x. [DOI] [PubMed] [Google Scholar]
- Sillito A, Murphy P. The cholinergic modulation of cortical function. In: Jones E, Peters A, editors. Cerebral Cortex. New York: Plenum Press; 1987. pp. 161–185. [Google Scholar]
- Snowden RJ, Treue S, Andersen RA. The response of neurons in areas V1 and MT of the alert rhesus monkey to moving random dot patterns. Exp. Brain Res. 1992;88:389–400. doi: 10.1007/BF02259114. [DOI] [PubMed] [Google Scholar]
- Softky WR, Koch C. The highly irregular firing of cortical cells is inconsistent with temporal integration of random EPSPs. J. Neurosci. 1993;13:334–350. doi: 10.1523/JNEUROSCI.13-01-00334.1993. [DOI] [PMC free article] [PubMed] [Google Scholar]
- Solomon SG. Striate cortex in dichromatic and trichromatic marmosets: neurochemical compartmentalization and geniculate input. J. Comp. Neurol. 2002;450:366–381. doi: 10.1002/cne.10327. [DOI] [PubMed] [Google Scholar]
- Swindale NV. Orientation tuning curves: empirical description and estimation of parameters. Biol. Cybern. 1998;78:45–56. doi: 10.1007/s004220050411. [DOI] [PubMed] [Google Scholar]
- Tang AC, Bartels AM, Sejnowski TJ. Effects of cholinergic modulation on responses of neocortical neurons to fluctuating input. Cereb. Cortex. 1997;7:502–509. doi: 10.1093/cercor/7.6.502. [DOI] [PubMed] [Google Scholar]
- Tassonyi E, Charpantier E, Muller D, Dumont L, Bertrand D. The role of nicotinic acetylcholine receptors in the mechanisms of anesthesia. Brain Res. Bull. 2002;57:133–150. doi: 10.1016/s0361-9230(01)00740-7. [DOI] [PubMed] [Google Scholar]
- Vidal C, Changeux JP. Nicotinic and muscarinic modulations of excitatory synaptic transmission in the rat prefrontal cortex in vitro. Neuroscience. 1993;56:23–32. doi: 10.1016/0306-4522(93)90558-w. [DOI] [PubMed] [Google Scholar]
- Vogels R, Spileers W, Orban GA. The response variability of striate cortical neurons in the behaving monkey. Exp. Brain Res. 1989;77:432–436. doi: 10.1007/BF00275002. [DOI] [PubMed] [Google Scholar]
- Wonnacott S. Presynaptic nicotinic ACh receptors. TINS. 1997;20:92–98. doi: 10.1016/s0166-2236(96)10073-4. [DOI] [PubMed] [Google Scholar]
- Xiang Z, Huguenard JR, Prince DA. Cholinergic switching within neocortical inhibitory networks. Science. 1998;281:985–988. doi: 10.1126/science.281.5379.985. [DOI] [PubMed] [Google Scholar]