

Abstract
We measured birefringence, 90 degree scattered light, and voltage sensitive dye changes from lobster walking leg nerves. Systematic application of key chemical agents revealed separate cellular mechanisms underlying fast optical signals. Each agent exhibited mixed effects, some having a greater effect on cellular swelling and refractive index, and some altering membrane potential. Birefringence changes were tightly correlated with voltage sensitive dye signals and were perturbed by those agents that altered membrane potential. Signals from light scattered at 90 degrees corroborated the hypothesis that large angle scattering signals arise from changes in the interstitial spaces and were perturbed by those agents that altered cellular swelling and refractive index. We conclude that multiple cellular mechanisms can be exploited to measure rapid optical signals. Since birefringence produces much larger changes than scattering, the use of polarized light might lead to improvements in imaging neural activity with high temporal resolution, especially since birefringence changes corresponded closely to membrane potential.
Keywords: crustacean, toxin, intrinsic optical imaging, action potential
Neuronal excitation elicits fast intrinsic optical changes in scattering and birefringence, with an initial phase closely associated with the time course of action potentials and postsynaptic potentials (Cohen et al., 1968; Tasaki et al., 1968; Cohen and Keynes, 1971; Landowne, 1985; Rector et al., 1997). Neuroscientists have been using optical signals to detect and study neural activation for decades, but the causes of these intrinsic optical phenomena remain enigmatic. A better understanding of cellular optical properties may lead to further improvements in the technology to record neural activity, both in-vitro and in-vivo.
The origins of optical signals are particularly elusive because their time course coincides with several physiological phenomena. Many investigators have examined possible mechanisms, linking them to mechanical (Tasaki et al., 1980; Watanabe, 1986; Yao et al., 2003), molecular (Landowne, 1985, 1993) and electrical (Stepnoski et al., 1991) events associated with membrane excitation. Membrane protein reorientation caused by voltage or mechanical changes could produce transient tissue interactions with polarized light (Cohen et al., 1968; Landowne, 1993; Tasaki et al., 1968). Additionally, synaptic events such as vesicle fusion (Salzberg et al., 1985) and membrane unfolding may reduce intracellular scattering particles. Other studies suggest that these changes may also originate from cytoskeletal (Oldenbourg et al., 1998) and axoplasmic (Watanabe and Terakawa, 1976) events. In combination with cellular swelling, the phospholipids in the membrane bilayer may change orientation, causing birefringence changes. While all of these mechanisms are probably operating at some level, there has been little consensus as to which element or combination of elements dominates these fast optical signals. Birefringence changes have not been measured simultaneously with scattering and membrane potential while systematically changing the extracellular constituents.
We hypothesize that cellular swelling underlies at least part of the scattering change, but may not be a primary origin for the birefringence change. Since the scattering signal peak lags 1-3 ms behind the birefringence peak in simultaneous lobster nerve recordings, these optical changes may be mediated by separate biophysical phenomena (Carter et al., 2004). Our earlier results suggest that at least part of the birefringence change can be explained by swelling events (Yao et al., 2005); however, they do not reconcile the timing delay between birefringence and scattering signals.
Simultaneous measurements of birefringence and 90 degree scattered light during pharmacological and refractive index manipulations should help elucidate some of the biophysical mechanisms underlying the optical signals. Blocking voltage-dependent potassium channels should retard the recovery phase of the action potential, the flow of hydrated potassium out of the cell, and the return to baseline of any swelling-dependent optical change. Proteolytic enzymes and chemical membrane disrupters should perturb the glia surrounding the neurons, decreasing the force opposing neuronal swelling, yielding a greater volume increase and optical change. Nearly all discovered aquaporins from plants, mammals, bacteria, and insects exhibit sensitivity to mercury sulfhydryl reagents such as mercuric chloride (Agre et al., 2002; Kuwahara et al., 1997). If membrane aquaporins play a substantial role in releasing water from the cell during the recovery phase, then aquaporin blockade should delay neuronal shrinkage and the ninety degree scattering signal recovery, but not birefringence signals. If swelling truly precipitates only the scattering change, we expect the aforementioned swelling perturbations to produce no significant changes in birefringence signals. While all of these compounds produce mixed effects, their different properties should help us to separate potential optical mechanisms.
To address these hypotheses, we concurrently examined birefringence and scattering changes before and after several pharmacological and refractive index manipulations. We also conducted voltage sensitive dye (VSD) experiments to compare optical signals with membrane potential for each compound. Although our eventual goal is to image neural circuitry over large tissue areas in intact animals and humans, the isolated lobster nerve preparation provided a relatively simple, controlled paradigm for probing optical signal mechanisms (Yao et al., 2005). Discerning the biophysical underpinnings of fast intrinsic optical events may greatly facilitate the development of optical techniques for the study of neural activity.
Experimental Procedures
We recorded birefringence, 90 degree scattered light, and voltage sensitive dye changes in nerves removed from the first two most rostral walking legs (30–60 mm in length and 0.5–2mm in diameter) of lobsters, Homarus americanus (Sea View Lobster, Kittery, ME). Each nerve was extracted using the Furusawa “pulling out” method (Furusawa, 1929) and then tied with silk sutures at both ends to prevent axoplasmic leakage.
We placed each isolated nerve in a recording chamber flooded with a bath solution (Pantin, 1934) of 525 mM sodium chloride, 13.3 mM potassium chloride, 12.4 mM calcium chloride, 24.8 mM magnesium chloride, and enough sodium bicarbonate to achieve pH = 7.0 at room temperature, 23–25°C (Fig. 1, Carter et al., 2004). Sodium bicarbonate buffered the bath solution to neutral pH, and dextrose (5 mM) was added to extend the life of the nerve. To ascertain the anatomical structure of the axon bundle, several nerves were fixed in formalin and stained with hematoxylin and eosin to obtain histological images of the bundle in cross-section. The chamber featured a central, rectangular well into which compounds were introduced (Fig. 1.i), and four smaller wells on either side. Each well was fitted with a silver electrode and isolated with petroleum jelly. Electrodes on one side of the imaging window delivered current pulse stimuli (Fig. 1.ii) and recorded the pre-optical window field potential (Fig. 1.iii, “electrode position 1”). A second set of electrodes recorded the electrophysiological response after the action potentials passed through the center well (Fig. 1.iv, “electrode position 2”). The bottom of the central well contained a narrow slit covered with a microscope slide through which the light was focused during optical recordings. A 3 mm image conduit (Schott Fiber Optics, Boston, MA) embedded in the chamber's side, orthogonal to both the optic axis and the long axis of the nerve, captured the 90 degree scattered light (Fig. 1.v).
Figure 1.

Light originated from an LED (a) passed through a polarizer (b) and optical window (c.i) onto a nerve bundle. Transmitted light passed through a second crossed polarizer (d) onto a photodiode (f). An image conduit (c.v) directed 90 degree scattered light onto a second photodiode (g). A broad bandpass filter (e) replaced the polarizers for voltage sensitive dye recordings. Two electrodes pairs (c.iii and c.iv) to the right of the stimulus cathode (c.ii) recorded field potentials from the nerve.
Light originated from a red, high-intensity light emitting diode (LED, Fig. 1a, 665 nm, 2800 mcd, 5 mm dia., Panasonic, Model LN261CAL) and passed through a visible-wavelength polarizer (Fig. 1b, VIS 4 K, Linos Photonics, Milford, MA) oriented at 45 degrees with respect to the long axis of the nerve bundle. Although the dI/I signals were probably wavelength independent (Cohen and Keynes, 1971), we used 665 nm light due to the availability of ultra bright LEDs at this wavelength and its tissue penetration characteristics. The LED had significant advantages over typical halogen sources including lower noise characteristics and ease of use in the system (Salzberg et al., 2005). The light was focused through the glass window in the bottom of the recording chamber (Fig. 1c) and onto the nerve bundle. The scattered light intensity was recorded with a photodiode (Fig. 1g, UDT-555UV/LN, UDT Sensors, Hawthorne, CA) positioned at the end of an image conduit, 90 degrees with respect to the incident light. Since the image conduit was 3 mm in diameter, and the nerve was 1.5 mm from the image conduit, the angles included in the 90 degree scattering measurements ranged from 45–135 degrees from the center of the nerve to image conduit. Transmitted light passed through a second polarizer (Fig. 1d) crossed with respect to the first. The birefringent light intensity was recorded with a second photodiode (Fig. 1f) positioned over the second polarizer. A 60 nm bandpass filter centered at 720 nm (Fig. 1e, Chroma Technology Corp., Rockingham, Vermont) and a green LED (520 nm, 2400 mcd, 5 mm diameter, No. 404–1093, Stanley Electric Co., Japan) replaced the polarizers and red LED during VSD recordings. (Insert figure 1 here.)
We seated each extracted nerve in the recording chamber and stimulated with 0.2 ms current pulses (~2 mA) at random intervals between one and two seconds (0.67 Hz average stimulation rate), using a direct current isolated stimulator (Model A365R, World Precision Instruments, Inc., Sarasota, FL). A healthy nerve fired single action potentials from the largest axons, with stimulus currents under 0.2 mA. After assessing the nerve's health, we began full stimulation (~2 mA), recording transmitted and 90 degree scattered light intensity with the electrical response from electrodes positioned at Fig. 1.iii and Fig 1.iv. Electrical responses were recorded with a differential amplifier (Linear Technology LT1167) and filtered between 0.1 Hz and 3.2 kHz with x1000 gain. Optical signals were filtered (0.1 Hz – 3.2 kHz), amplified with a x1000 gain, and digitized simultaneously with the electrical signals, at 10 kHz per channel. We quantified birefringence, scattering, and VSD responses as a ratio of the change in light intensity measured during an action potential to the resting light intensity (dI/I).
Scattering and birefringence baseline recordings were averaged from the nerve submerged in normal bath solution. Then, half of the solution was drawn out and replaced with an altered solution. Prior to the addition of each compound, we recorded a baseline average of 50 to 150 triggers. After adding a compound, we continued to collect data, averaging every 50 stimuli until the nerve no longer exhibited optical or electrical activity. For tetrodotoxin (TTX) trials, all of the toxin-containing solution was drawn out of the chamber, washed twice, and replaced with normal bath solution to see if the action potentials and optical signals would recover in the absence of the sodium channel inhibitor. We recorded voltage sensitive dye (RH795, Invitrogen, Eugene, OR) signals in separate experiments to investigate transmembrane potential changes. Nerves were bathed in 0.2 mg/ml RH795 for 10 minutes and washed twice with the bath solution prior to recording. We compared conduction velocities for compounds that altered the propagation speed of the action potential volleys by dividing the displacement between electrode position 1 and electrode position 2 by the time delay between the electrical signal peaks to obtain pre- and post-compound propagation speeds. Changes in propagation velocity, signal amplitude, and recovery latency were compared with a paired student's t-test.
We selected each compound to interfere with specific conditions or events instrumental to neuronal signal conduction. TTX (Sigma-Aldrich, St. Louis, MO), a poison that inhibits voltage-gated sodium channels (Mosher, 1986; Narahashi et al., 1964), was diluted in bath solution to final concentrations between 10 and 100 nM. Tetraethylammonium chloride (TEA, Sigma-Aldrich, St. Louis, MO), which blocks voltage-gated potassium channels (Hille, 1967; Tasaki and Hagiwara, 1957) and possibly membrane aquaporins (Brooks et al., 2000), was applied in concentrations ranging from 50 to 250 mM. Dimethyl sulfoxide (DMSO, Sigma-Aldrich, St. Louis, MO), a water-miscible liquid membrane disrupter (Lee et al., 2004), was added to the bath solution at concentrations varying between 1% and 10% by volume. We introduced protease from Streptomyces griseus (Sigma-Aldrich, St. Louis, MO) to disrupt the fascicles encasing the nerves. The protease solutions were viscous and difficult to introduce to the nerve preparation via pipette, so solid state protease powder was instead applied to the bundle until the concentration of protease in solution reached 1 – 10 mg/ml. Ouabain (Fluka Chemie GmbH, Buchs, Switzerland), a sodium potassium adenosine triphosphatase (Na,K-ATPase) inhibitor (Schwartz et al., 1975), was introduced in concentrations ranging from 1 to 10 mM.
We performed a series of control experiments for the changes in pH, osmolality and refractive index produced by the high concentration of the variable chemicals. As it is difficult to find a cation replacement that does not alter ion channels at 250 mM, we separately tested the effects of increased refractive index with 5%–10% dextran (Chemalog, South Pleinfield, NJ) and osmolality with 250 mM NaCl. To further clarify the effects of increased osmolality and refractive index, we conducted experiments with both 250 mM and 500 mM mannose (Sigma-Aldrich, St. Louis, MO) solutions. In order to test the potential effects of pH changes in the bath solution, we also recorded responses at pH 6.0 and pH 8.0. For each bath solution, we measured the osmolality with an osmometer, pH (Bromothymol Blue indicator with an Ocean Optics spectrophotometer), and refractive index with a refractometer.
Results
Baseline recordings featured birefringence response amplitudes between -1x10⁻⁴ and -3x10⁻⁴. Scattering signals exhibited amplitudes at least an order of magnitude smaller than the birefringence change. Birefringence, scattered light, and VSD signals peaked 5–15 ms after each current pulse, and both birefringent and scattered light intensities returned to baseline within 30 ms, well before subsequent stimuli. BIR and 90S signals sometimes overshot baseline during the falling phase before returning to resting intensity. Healthy, unpoisoned nerves produced 1000–2000 consistent compound action potential volleys over a one hour period; however, VSD nerves deteriorated at a faster rate due to dye phototoxic properties (Oxford et al., 1977; Pooler, 1972).
The unaltered bath solution had an osmolality of 1105 mmol/kg and a refractive index of 1.339. Birefringence resting light intensity ranged from 1.21–3.04 μW with peak signal amplitudes ranging from 221–995 pW during stimulation. Scattering featured resting intensities from 1.91–9.51 μW with peak excitation changes ranging from 5.53–77.3 pW. VSD resting intensities ranged from 216–376 nW with peak signal changes of 12.1–147 pW. DMSO and TEA significantly decreased the BIR resting light intensity. No significant changes in the 90S or VSD resting intensity were observed with any of the chemicals.
TTX
TTX abolished action potential propagation, birefringence (BIR) and 90 degree scattered light (90S) signals within 150–200 stimuli (Fig. 2). The electrical potential recorded down-stream of the toxin application site (EP2) degraded rapidly, while the field potential recorded between the stimulus site and the toxin-treated segment (EP1) decayed slowly (Fig. 2). Removal and washing of TTX from the nerve resulted in a small rebound in both electrical and optical events (data not shown).
Figure 2.
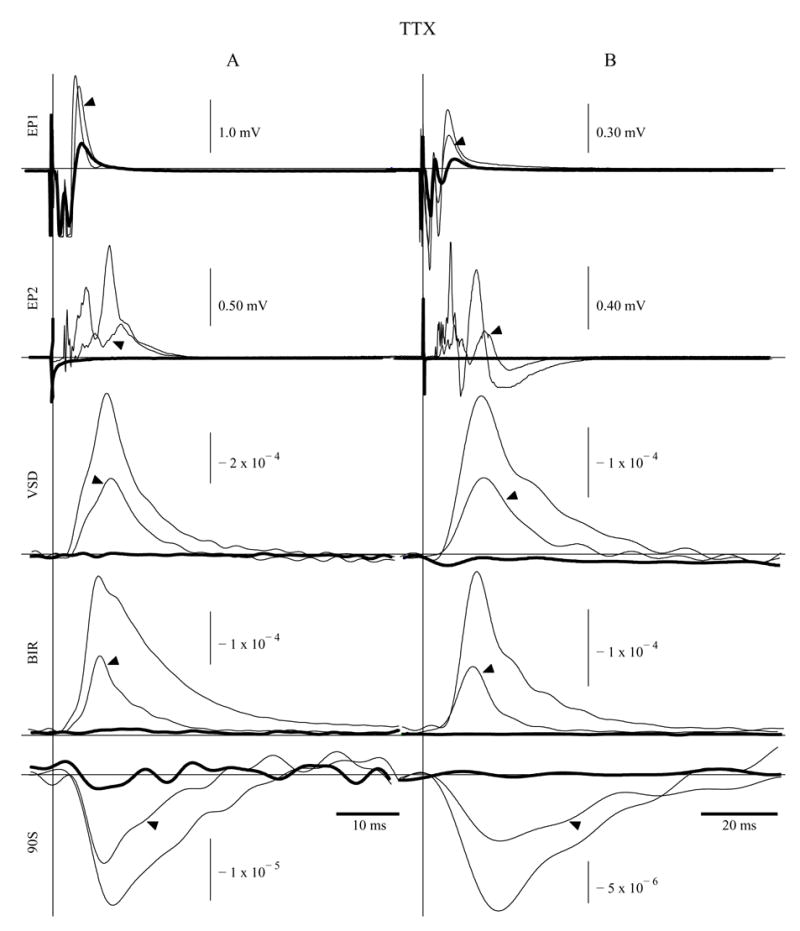
Electrode position 1 (EP1) field potential, electrode position 2 (EP2) field potential, voltage sensitive dye (VSD), birefringence (BIR), and 90 degree scattering (90S) fluctuations recorded during activation. The vertical lines indicate the time of stimulus for two experiment sets (A and B), and each trace contains 100 averages. Recordings were taken before (thin traces), immediately after (arrowed traces), and two minutes after (thick traces) 20 nM TTX introduction. Traces EP1, EP2, BIR, and 90S were recorded simultaneously, while VSD signals were collected during separate experiments.
TEA
TEA application affected the BIR and 90S signals differently depending on the concentration. TEA at 250 mM increased the osmolality (+404 mmol/kg) and refractive index (+0.005) of the bath solution, decreased the BIR resting light intensity (I) by 0.61 μW, and increased dI by 81.7 pW, producing a one third net increase in dI/I BIR signal peak (Fig. 3). A pronounced secondary peak developed 20 ms after the initial peak (Fig. 3). The EP2 signal decreased in amplitude, and expanded its time course, recovering to resting potential 200 ms after the stimulus (especially apparent in Fig. 3B). The shape of the secondary BIR peak corresponded in shape and time course to the field potential change recorded at EP2. The initial 90S component showed a delayed recovery (Fig. 3, 90S after the horizontal bars), and then overshot resting intensity for >0.5s. With 100 mM TEA, the BIR signals behaved like the 250 mM signals, except that the maximum BIR to amplitude was reached after 1–3 minutes of continuous TEA exposure. 90S signals at 100 mM also overshot resting intensity for 0.5s during the late recovery phase, while the initial component maintained its pre-TEA time course and intensity. At 50 mM TEA, the falling phase of the BIR trace exhibited a slight (5–10 ms) delay in its recovery to resting intensity, and changes in the 90S signal initially followed those produced by 100 mM TEA. After 2–5 minutes of continuous exposure to 50 mM TEA, the 90S initial component maintained its amplitude and time course, but the late overshoot disappeared. For all concentrations tested, the VSD recording increased in amplitude and developed a late secondary peak in a manner similar to the BIR signal (Fig. 3).
Figure 3.
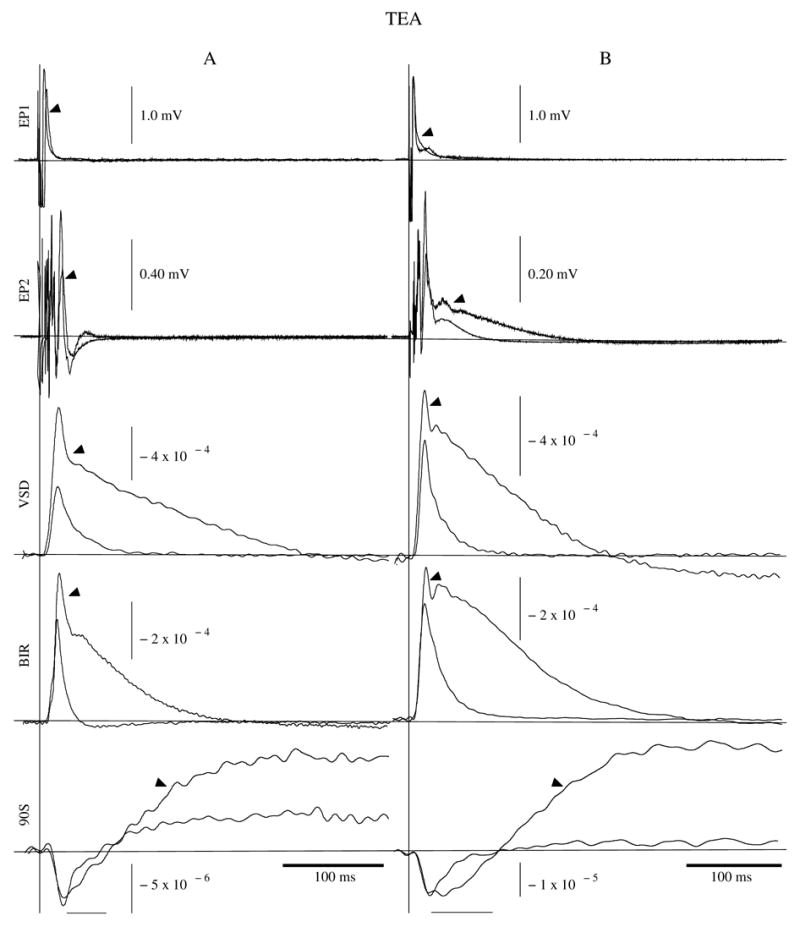
EP1 field potential, EP2 field potential, VSD, BIR, and 90S recordings taken before (thin traces) and after (arrowed traces) 250 mM TEA application. The vertical lines indicate the time of stimulus for two experiment sets (A and B), and each trace contains 100 averages. Horizontal bars beneath the 90S traces underline the “initial phase”; all time to the right of the bars is referred to as the “later phase”. EP1, EP2, BIR, and 90S were recorded simultaneously, while the VSD recordings represent separate experiments.
DMSO
Immediately following DMSO application, many spontaneous action potentials appeared in EP1 and EP2. DMSO delayed the 90S signal recovery to resting intensity, and increased the BIR and VSD signal amplitudes by 25–50% within the first 50 stimuli (Fig. 4). With continued DMSO exposure, the BIR signal then degraded to pre-DMSO amplitude over the next 30 to 50 stimuli. The greatest BIR amplitude increase occurred with 10% DMSO (Fig. 4). DMSO slowed action potential propagation velocities by 35.8 ± 3.44% measured at EP2, and significantly slowed and elongated the optical signal time courses, delaying the 90S, BIR, and VSD signal peaks and recovery to resting intensity (Fig. 4). The falling phase of the BIR and VSD signals lengthened from 30 ms in the pre-DMSO recording to 300 ms after 2 minutes of continuous exposure (Fig. 4). A 0.5–1.0s delay in the 90S recovery to resting appeared immediately after DMSO addition. Both electrical and optical signals decreased faster than control preparations with DMSO, decreasing to one-half the original EP2 amplitude in 300 averages in contrast with 500–700 stimuli for non-DMSO experiments. DMSO increased the osmolality (+1583 mmol/kg) and refractive index (+0.014) of the bath solution, decreased the BIR resting light intensity (I) by 1.25 μW, and decreased the change in intensity (dI) by 97.2 pW, indicating that baseline intensity (I) must have decreased more than dI to result in an increased dI/I.
Figure 4.

EP1 field potential, EP2 field potential, VSD, BIR, and 90S taken before (thin traces), immediately after (arrowed traces), and two minutes after (thick traces) 10% DMSO application. The vertical lines indicate the time of stimulus for two experiment sets (A and B), and each trace contains 100 averages. EP1, EP2, BIR, and 90S were recorded simultaneously, while the VSD recordings represent separate experiments.
Ouabain
Spontaneous action potentials (not associated with the stimulus) appeared immediately after 1–5mM ouabain addition (similar to DMSO). Ouabain increased VSD and BIR signal amplitudes by 10 – 30 % (Fig. 5). Ouabain also increased both the amplitude and integral of the BIR and VSD traces. Ouabain delayed BIR, 90S, and VSD peaks (Fig. 5) in addition to slowing the time course of action potential volleys recorded at EP2 by 27.3 ± 2.74%.
Figure 5.

EP1 field potential, EP2 field potential, VSD, BIR, and 90S taken before (thin traces) and immediately after (arrowed traces) 5 mM (set A) and 1 mM (set B) ouabain application. The vertical lines indicate the time of stimulus for two experiment sets (A and B), and each trace contains 100 averages. EP1, EP2, BIR, and 90S were recorded simultaneously, while the VSD recordings represent separate experiments.
Protease
Protease produced no significant changes in BIR, 90S, or electrophysiological signal amplitude or time course. The signals degraded more quickly than control signals due to the protease effects. Protease disrupted the bundle's neuronal and glial integrity with more destructive results than DMSO. We originally hypothesized that swelling-mediated optical signals would increase with protease as the glial sheaths dissolved, decreasing the pressure on the neurons. However, protease seemed to arbitrarily dissolve neuronal and glial membranes, accelerating optical and electrical signal degradation and producing little insight on possible mechanisms.
Mercuric Chloride
Mercuric chloride caused no changes with respect to pre-toxin recordings at low concentrations (0.5 – 50 μM), and accelerated both optical and electrical signal decay at higher concentrations (250 – 500 μM) in a manner similar to TTX. Mercuric chloride's neurotoxic effects (Mitchell and Gallagher, 1980) took precedence over aquaporin blocking functions. Thus, intrinsic optical effects died away before observing any consequences of aquaporin blockade.
Controls
Control experiments at pH=6.0 and 8.0 yielded no significant optical or electrical changes over recordings at pH=7.0. Sodium chloride and mannose at 250 mM both elicited a decrease in the BIR signal amplitude (29–38%, Fig. 6), which was similar to normal deterioration of the optical signal amplitude over time. Although it is likely that the high level of NaCl in the outer bath contributed to signal degradation by depolarizing the membrane, the decrease was not significantly different from the baseline deterioration of nerves bathed in normal solution. Dextran (5–10%) had no immediate effects, but prevented the recovery of BIR and 90S traces 10 minutes after application (Fig. 6). Mannose (250 mM) increased the refractive index similar to 5% dextran and 250 mM TEA (+0.006), but produced only half the change in osmolality (+223 mmol/kg). Mannose at 500 mM matched the osmolality increase produced with 250 mM TEA (+473 mmol/kg), but doubled the increase in refractive index (+0.012) similar to 10% dextran.
Figure 6.

90S (left column) and BIR (right column) signals taken before (thin traces), immediately after (arrowed traces), and 10 minutes after (dextran only, thick traces) application of 250 mM NaCl, 250 mM mannose, 500 mM mannose, 5% dextran, and 10% dextran. The vertical lines indicate the time of stimulus, and each trace contains 50–100 averages.
Table 1 displays a summary across all nerves for each observation described above.
Table 1.
Changes in VSD, BIR, and 90S signals with pharmacological manipulations. P-values indicate the outcome of a paired student's t-test for each comparison.
| Toxin | Probe | Observation | Pre-toxin | Post-toxin | n | p-value | ||
|---|---|---|---|---|---|---|---|---|
| mean | s.d. | mean | s.d. | |||||
| TEA 250 mM | VSD | Amplitude increase (dI/I x 10−4) | 4.50 | 1.06 | 7.73 | 0.848 | 4 | 0.007 |
| Delayed recovery (ms) | 115 | 17.5 | 258 | 27.4 | 4 | 0.0002 | ||
| BIR | Amplitude increase (dI/I x 10−4) | 2.51 | 0.889 | 3.57 | 1.02 | 4 | 0.001 | |
| Delayed recovery (ms) | 83.0 | 43.5 | 243 | 50.6 | 4 | 0.0001 | ||
| Resting intensity decrease (μW) | 2.68 | 0.13 | 2.07 | 0.24 | 3 | 0.010 | ||
| 90S | Long-lasting overshoot (dI/I x 10−4 , t=0.5s) | 0.005 | 0.013 | 0.183 | 0.142 | 4 | 0.093 | |
| DMSO 10% | VSD | Amplitude increase (dI/I x 10−4) | 3.68 | 1.50 | 4.87 | 2.11 | 3 | 0.107 |
| Delayed recovery (dI/I x 10−4 , t=0.1s) | −0.026 | 0.131 | 0.892 | 0.572 | 3 | 0.085 | ||
| Peak delay (ms) | 32.5 | 0.430 | 35.0 | 0.921 | 3 | 0.048 | ||
| BIR | Amplitude increase (dI/I x 10−4) | 2.26 | 0.446 | 3.37 | 1.20 | 4 | 0.094 | |
| Delayed recovery (dI/I x 10−4, t=0.2s) | 0.068 | 0.037 | 0.282 | 0.111 | 4 | 0.014 | ||
| Peak delay (ms) | 31.7 | 0.612 | 35.9 | 2.28 | 4 | 0.017 | ||
| Resting intensity decrease (μW) | 2.70 | 0.22 | 1.45 | 0.54 | 3 | 0.008 | ||
| 90S | Delayed recovery (dI/I x 10−4, t=0.2s) | 0.033 | 0.028 | −0.022 | 0.012 | 4 | 0.016 | |
| Peak delay (ms) | 35.8 | 1.74 | 40.2 | 1.63 | 4 | 0.010 | ||
| Ouabain 1–5 mM | VSD | Amplitude increase (dI/I x 10−4) | 2.83 | 0.920 | 3.49 | 1.20 | 3 | 0.060 |
| Peak delay (ms) | 34.5 | 0.680 | 36.7 | 0.440 | 3 | 0.053 | ||
| BIR | Amplitude increase (dI/I x 10−4) | 2.10 | 0.304 | 2.46 | 0.419 | 5 | 0.004 | |
| Peak delay (ms) | 32.6 | 0.293 | 35.74 | 0.541 | 5 | 0.0001 | ||
| Dextran 10% | BIR | Delayed recovery (dI/I x 10−4, t=0.15s) | 0.007 | 0.010 | 0.088 | 0.036 | 3 | 0.034 |
| Resting intensity decrease (μW) | 2.48 | 0.173 | 1.96 | 0.152 | 3 | 0.002 | ||
| 90S | Delayed recovery (dI/I x 10−4, t=0.3s) | 0.084 | 0.009 | −0.032 | 0.013 | 3 | 0.010 | |
| NaCl 250 mM | BIR | Delayed recovery (dI/I x 10−4, t=0.05s) | 0.135 | 0.015 | 0.232 | 0.050 | 3 | 0.040 |
Discussion
Pharmacological manipulations induced changes in the BIR signals that followed membrane potential, bearing a striking resemblance to the VSD measurements. In contrast, 90S signals reacted to each compound in a manner consistent with the cellular swelling and changes in refractive index in the peri-fascicular spaces. TEA, however, produced a long lasting overshoot in the 90S signal, not explained by the simple cellular swelling interpretation. Each agent exhibited mixed effects on cellular swelling, refractive index, and membrane potential. The cellular swelling and refractive index components of the agents dramatically altered 90S signals while membrane potential components changed the VSD and BIR signals. Our results showed that while large angle scattering signals (90S) arose from changes in the interstitial spaces, BIR signals closely followed changes in the membrane potential and were minimally affected by cellular swelling mechanisms. Significant variations in the time course of optical and electrical signals (for example, see sections A and B, Fig. 2) resulted from typical variability from nerve to nerve, perhaps related to differences in axon and bundle diameter and the health of the nerve.
TTX
TTX abolished downstream electrical signals while minimally degrading signal size prior to the toxin window, confirming that TTX did not inhibit generation but rather propagation of the action potential. Slow degradation of the upstream signal occurred as TTX diffused along the outer fascicle layer throughout the petroleum jelly isolated wells. The TTX results confirm previous studies (Cohen et al., 1968; Cohen and Keynes, 1971) and illustrate the relationship between sodium channels and neural activation, but provide little insight into the mechanisms mediating the BIR and 90S signals.
TEA
TEA caused the BIR signal amplitude to increase in all nerves recorded, similar to the RH795 potential measurement. Because TEA is expected to decrease potassium conductance, it is likely that the action potential amplitude increased as membrane potential approached the sodium ion Nernst potential more readily than under normal conditions, resulting in a larger amplitude. The increase in the BIR and VSD signals could also be related to the summation of broadened spikes. TEA immediately and significantly delayed the BIR signal and voltage recovery, but did not affect the initial rising phase, which suggests that inhibiting the potassium ion efflux retarded the recovery of the membrane potential and BIR signals, but did not affect sodium-mediated depolarization. TEA’s different effects on the early and late components of the optical signals suggest that modifications of voltage and current dependent components took place. However, since we could not perform voltage or current clamping in this preparation, we could not separate the two effects.
The early phases of the 90S signal appeared immune to changes in amplitude after adding TEA, suggesting that the early components of the swelling changes were not affected by a lack of potassium efflux. TEA caused a significant reversal in the late component of the 90S signal that was long lasting, consistent with Cohen et al.’s (1972) experiments. Since TEA may also block aquaporins, a significant route through which water can escape during the recovery phase is also blocked. Thus, we would expect aquaporin blockade might retard cell shrinkage, delaying cell volume and the 90S signals. However, we observed the opposite, which could be interpreted as a dramatic and long lasting shrinkage of the cells, or could also mean that part of the 90S signal is not as closely related to cellular swelling as initially hypothesized by Yao et al. (2005).
DMSO
The appearance of random action potentials in the extracellular electrical recordings suggests that DMSO caused electrical instability by disrupting membrane phospholipids or that membrane potential drifted closer to threshold, facilitating spontaneous activation. The latter hypothesis may imply a decrease in potassium conductance, which would depolarize the membrane, increase sodium channel inactivation, and slow propagation velocity. Indeed, the 35.8 ± 3.44% velocity decrease measured in our nerves agrees with a 40% decrease measured by Evans et al. in unmyelinated C fibers (1993). The increased amplitude of the BIR and VSD signals may arise from increased action potential amplitudes. Decreased potassium conductance could elicit increased amplitudes by driving the membrane potential closer to the sodium reversal potential than under control conditions.
Because the 90S signal failed to exhibit the potential-dependent amplitude increase, it is likely that the 90S late component arose from a mechanism not directly related to membrane potential, such as loosening of the membrane from its actin anchoring or trapping of hydrated potassium ions within the cell (Sanger et al., 1980; Vincent et al., 1990). Both proposed mechanisms predict an increase in activation-related cellular swelling. In contrast, both VSD and BIR late components began as brief extensions (~20 ms) and then expanded to 300 ms after one minute in the presence of DMSO. This may reflect a progressively decreasing potassium conductance as the channels fail to pass the potassium ions modified by DMSO (Mayer and Avi-Dor, 1970; Sawada and Sato, 1975). The similar shape and time course of the BIR and VSD signals ties BIR to membrane potential-altering mechanisms. Differences in the 90 degree scattered light change, again, support a swelling mechanism.
Ouabain
The appearance of random action potentials after ouabain addition suggests that the membrane potential may have been depolarized by the inhibition of the electrogenic sodium pump, an effect also noted by Kaji and Sumner in demyelinated peripheral fibers (1989). The elevated membrane potential should increase sodium channel inactivation (Cohen and Landowne, 1973) and could also explain the 27% decrease in conduction velocity. Additionally, since the membrane potential is slightly depolarized, the axons may be more excitable, resulting in the recruitment of more axons during stimulation. This may explain the increased VSD and BIR signal amplitudes.
Other factors besides membrane potential could contribute to part of the VSD signal. Fedosova et al. (1995) observed that several RH dyes, all proven indicators of membrane potential, exhibited unique responses to ouabain binding and phosphorylation states of Na,K-ATPases. This implies that the styryl dyes may respond to other changes not strictly related to the membrane dielectric, such as electrostatic interactions or ouabain-induced conformation changes in the ATPase (Fedosova et al., 1995). Because VSDs track changes in membrane potential on a sub-millisecond time scale (Loew et al., 1985), much of the initial response is probably related to membrane potential. However, the bulk of the VSD changes observed here lasted several tens of milliseconds, a long enough time period for protein conformation effects to be integrated into the observed VSD signal. Since BIR closely tracked VSD signals, we consider that these optical changes may emerge from a combination of modifications in the membrane dielectric and changes in membrane protein conformation states.
Controls
We hypothesize that the difference between mannose and dextran is related to their diffusion properties, and the origins of the optical changes. The 90S dextran results corroborate data reported by Cohen and Keynes (1971), who hypothesized that much of the 90S optical signal arises from changes in the peri-axonal space; however, our results suggest that a large fraction of the 90S signal arises from peri-fascicular spaces. Each nerve consists of an outer glial sheath containing hundreds of axons, which are grouped into sheath encased fascicles. Thus, there are three extracellular compartments: an inner compartment between the axons and within the fascicle (peri-axonal), a peri-fascicular compartment between the fascicle and the outer sheath, and the outer bath solution (Fig. 7). Mannose, a small molecule (mw = 180.2 g/mol) in comparison with dextran (mw = 32,000–48,000 g/mol), may have diffused through both the outer and inner sheaths, entering the peri-axonal space and equalizing the refractive index between the peri-fascicular and the peri-axonal spaces. Dextran’s lack of immediate effects may be attributed to its large size and slowed diffusion through the outer sheath (Fig. 6). The affects at t=10 min may have arisen as dextran diffused from outside of the bundle into the peri-fascicular space, setting up a refractive index difference between the peri-fascicular space and peri-axonal space, bringing about the later changes (Fig. 6). Aside from normal deterioration of the nerves, solutions with a 250 mM excess of NaCl had no immediate effects on the optical signals in agreement with Cohen and Keynes’s hypertonicity experiments (1971).
Figure 7.

A cross sectional hematoxylin and eosin stain of one corner of a lobster nerve shows a section of the outer sheath and three extracellular compartments including the outer bath (Bath), the peri-fascicular space (PF), separated from the bath by the outer sheath, and the peri-axonal space (PA), separated from the peri-fascicular space by the fascicular sheath, which houses large and small axons. Note the large area represented by the peri-fascicular spaces compared to the peri-axonal spaces.
Since 250 mM TEA produced an increase in refractive index comparable to that of 5% dextran (+0.006), we might expect that the changes under TEA are due in part to the refractive index changes. However, TEA produced immediate effects on the optical signals (Fig. 3), and dextran had no immediate effects (Fig. 6), suggesting that the immediate amplitude increase and peak delay after TEA application did not arise entirely from increased refractive index. In addition, TEA and dextran elicited different changes in the optical signals. For instance, TEA increased the peak amplitude of the BIR signal, and dextran did not. TEA also produced a long-lasting, positive going overshoot, which was opposite of the delayed recovery in seen in the 90S signal with dextran. Taking into consideration the mannose, sodium chloride, and dextran results, we conclude that the effects of TEA were separate from those elicited by changes in refractive index and osmolality. The delay of the 90S signal return to baseline with DMSO may be attributed to the refractive index of the bath solution; however, since DMSO has rapid diffusion characteristics (similar to mannose), we expect that DMSO penetrated outer and inner sheaths, distributing through peri-fascicular and axonal spaces, and minimizing changes in the optical signals due to refractive index. Since both BIR and VSD signals simultaneously developed a delay to resting potential, the majority of this change likely arose from the effects of DMSO on membrane potential rather than increased refractive index.
Conclusions
These experiments spawn several valuable insights and questions into fast optical signals. In all cases tested, birefringence changes tracked voltage sensitive dye signals in both shape and time course. Thus, the mechanisms that alter nerve birefringence are directly associated with membrane potential, and we have not been able to separate the two processes. This observation is not expected since birefringence should arise from molecular events while membrane potential is an electrical phenomenon. Although VSD and birefringence measurements are both reportedly potential dependent (Cohen et al., 1974; Cohen et al., 1972), we suspect that endogenous scattering events could confound a small portion of these signals and cause some fluctuations that are not directly related to membrane potential. For example, the enigmatic increase in these optical signals with ouabain implies that both electrical and molecular (i.e., protein conformational states) effects may contribute to birefringence and VSD signals. The 90 degree scattered light change, typically attributed to cellular swelling, developed a long-lasting reversal with TEA. This provocative result implies that cellular mechanisms other than swelling, refractive index and polarization could generate optical scattering signals, which may be used to optimize in-vivo recording techniques.
Many non-specific scattering events in tissue cause optical changes and contribute to background light and physiological noise. Any method that reduces the amount of background light not altered by neural activation will increase the contrast for observing such changes. The rapid scattered light signal is particularly vulnerable to being obscured by physiological noise as it is much smaller than VSD signals in cortex. As demonstrated in this study, birefringence signals present a much clearer picture of neuronal excitation than large angle scattering measurements because a larger fraction of the birefringence change evolves directly from membrane potential and activation-related conformation states, significantly reducing nonspecific light and physiological noise.
Fast intrinsic optical signals have the capacity to improve brain imaging because of their potential for high temporal and spatial resolution. However, applying these optical probes to in-vivo tissues using absorbance or backscattering changes currently requires hundreds of averages because the signals are significantly smaller than their hemodynamic correlates (Rector et al., 2005; Gratton and Fabiani, 2001; Steinbrink et al., 2000). While we still have a long way to go before birefringence measurements are practical in-vivo, single pass measurements are relatively easy in in-vitro crustacean nerve preparations (Carter et al., 2004; Cohen et al., 1970; Foust et al., 2005; Stepnoski et al., 1991).
The orientation-specific nature of the birefringence signal may seem to preclude its application in randomly oriented neural tissues. Techniques such as collecting all polar angles of the Mueller matrix could be used to measure birefringence changes at all angles of random fiber orientation (Berezhnyy and Dogariu, 2004). The Stokes vector/Mueller matrix approach, a technique for characterizing the optical parameters of a medium, can be employed by measuring the polarization states of light scattered for each polarization state of incident light. By comparing Stokes vectors from active and inactive tissue, we could potentially characterize changes in birefringence. This strategy could be tested by wrapping the lobster nerve into a loop over the detector window. Furthermore, the brain houses several specifically oriented fiber tracts; the superior longitudinal and arcuate fasciculi, and the short association fibers, all share a predominantly rostral/caudal orientation. Even though only a small fraction of the incident light is usefully scattered and picked up by the detector at the depth of these fiber tracts, valuable information may still be extracted from this small amount of light. The use of polarization optics will help to exclude nonspecific light. For example, polarization optics might be used to detect minute changes in optical rotation as a measure of blood glucose concentration (Manhas et al., 2006). Additionally, near infrared wavelengths can penetrate deeper into tissue than visible light (Eggert and Blazek, 1987). Several neuronal structures such as phospholipids, vesicles, and cytoskeletal components are also birefringent, and may exist in particular orientations in the cortex. Experiments in which we measure evoked response potentials in rat cortex with polarized light are currently underway. Clarifying the biophysical processes causing these signals will facilitate efforts to adapt the birefringence recording system to in-vivo tissue.
Acknowledgments
This work was supported by NIMH 60263, an SRS Junior Faculty Award, a Beckman Foundation Young Investigator Award, and the Murdock Foundation. The authors would also like to acknowledge Kathleen Carter for preparing the histology slide.
Abbreviations
- BIR
birefringence
- DMSO
dimethyl sulfoxide
- EP1
electrode position one
- EP2
electrode position two
- fMRI
functional magnetic resonance imaging
- LED
light emitting diode
- Na
K-ATPase, sodium potassium adenosine triphosphatase
- PET
positron emission tomography
- TEA
tetraethylammonium
- TTX
tetrodotoxin
- VSD
voltage sensitive dye
- 90S
ninety degree scattered light
Footnotes
Section Editor: Dr. Constantino Sotelo, CNRS UMR 7102, Universite Pierre et Marie Curie, 6eme etage, Bat B, Case 12, 9 Quai St. Bernard, 75005 Paris, France
Supported by: NIMH 60263, SRS Junior Faculty Award, Beckman Foundation Young Investigator Award, Murdock Foundation
Publisher's Disclaimer: This is a PDF file of an unedited manuscript that has been accepted for publication. As a service to our customers we are providing this early version of the manuscript. The manuscript will undergo copyediting, typesetting, and review of the resulting proof before it is published in its final citable form. Please note that during the production process errors may be discovered which could affect the content, and all legal disclaimers that apply to the journal pertain.
References
- Agre P, King LS, Yasui M, Guggino WB, Ottersen OP, Fujiyoshi Y, Engel A, Nielsen S. Aquaporin water channels – from atomic structure to clinical medicine. J Physiol. 2002;542(1):3–16. doi: 10.1113/jphysiol.2002.020818. [DOI] [PMC free article] [PubMed] [Google Scholar]
- Berezhnyy I, Dogariu A. Time-resolved Mueller matrix imaging polarimetry. Optics Express. 2004;12:4635–4649. doi: 10.1364/opex.12.004635. [DOI] [PubMed] [Google Scholar]
- Brooks HL, Regan JW, Yool AJ. Inhibition of aquaporin-1 water permeability by tetraethylammonium: involvement of the loop E pore region. Mol Pharmacol. 2000;57:1021–1026. [PubMed] [Google Scholar]
- Carter KM, George JS, Rector DM. Simultaneous birefringence and scattered light measurements reveal anatomical features in isolated crustacean nerve. J Neurosci Meth. 2004;135:9–16. doi: 10.1016/j.jneumeth.2003.11.010. [DOI] [PubMed] [Google Scholar]
- Cohen LB, Hille B, Keynes RD. Changes in axon birefringence during the action potential. J Physiol. 1970;11:495–515. doi: 10.1113/jphysiol.1970.sp009289. [DOI] [PMC free article] [PubMed] [Google Scholar]
- Cohen LB, Keynes RD, Hille B. Light scattering and birefringence changes during nerve activation. Nature. 1968;218:438–441. doi: 10.1038/218438a0. [DOI] [PubMed] [Google Scholar]
- Cohen LB, Keynes RD. Changes in light scattering associated with the action potential in crab nerves. J Physiol. 1971;212:259–275. doi: 10.1113/jphysiol.1971.sp009321. [DOI] [PMC free article] [PubMed] [Google Scholar]
- Cohen LB, Keynes RD, Landowne D. Changes in light scattering that accompany the action potential in squid giant axons: potential-dependent components. J Physiol. 1972;224:701–725. doi: 10.1113/jphysiol.1972.sp009919. [DOI] [PMC free article] [PubMed] [Google Scholar]
- Cohen LB, Landowne D. The temperature dependence of the movement of sodium ions associated with nerve impulses. J Physiol. 1973;236:95–111. doi: 10.1113/jphysiol.1974.sp010424. [DOI] [PMC free article] [PubMed] [Google Scholar]
- Cohen LB, Salzberb BM, Davila HV, Ross WN, Landowne D, Waggoner AS, Wang CH. Changes in axon fluorescence during activity: molecular probes of membrane potential. J Membr Biol. 1974;19:1–36. doi: 10.1007/BF01869968. [DOI] [PubMed] [Google Scholar]
- Eggert HR, Blazek V. Optical properties of human brain tissue, meninges, and brain tumors in the spectral range of 200 to 900 nm. Neurosugery. 1987;21:459–464. doi: 10.1227/00006123-198710000-00003. [DOI] [PubMed] [Google Scholar]
- Evans MS, Reid KH, Sharp JB., Jr Dimethylsulfoxide (DMSO) blocks conduction in peripheral nerve C fibers: a possible mechanism of analgesia. Neurosci Lett. 1993;150:145–148. doi: 10.1016/0304-3940(93)90522-m. [DOI] [PubMed] [Google Scholar]
- Fedosova NU, Cornelius F, Klodos I. Fluorescent styryl dyes as probes for Na,K-ATPase reaction mechanism: significance of the charge of the hydrophilic moiety of RH dyes. Biochemistry. 1995;34:16806–16814. doi: 10.1021/bi00051a031. [DOI] [PubMed] [Google Scholar]
- Foust AJ, Beiu RM, Rector DM. Optimized birefringence changes during isolated nerve activation. Appl Opt. 2005;44:2008–2012. doi: 10.1364/ao.44.002008. [DOI] [PubMed] [Google Scholar]
- Furusawa K. The depolarization of crustacean nerve by stimulation or oxygen want. J Physiol. 1929;67:325–342. doi: 10.1113/jphysiol.1929.sp002573. [DOI] [PMC free article] [PubMed] [Google Scholar]
- Gratton G, Fabiani M. Shedding light on brain function: the event-related optical signal. Trends Cogn Sci. 2001;5:357–363. doi: 10.1016/s1364-6613(00)01701-0. [DOI] [PubMed] [Google Scholar]
- Hille B. The selective inhibition of delayed potassium currents in nerve by tetraethylammonium ion. J Gen Physiol. 1967;50:1287–1302. doi: 10.1085/jgp.50.5.1287. [DOI] [PMC free article] [PubMed] [Google Scholar]
- Kaji R, Sumner AJ. Ouabain reverses conduction disturbances in single demyelinated nerve fibers. Neurology. 1989;39:1364–1368. doi: 10.1212/wnl.39.10.1364. [DOI] [PubMed] [Google Scholar]
- Kuwahara M, Gu Y, Ishibashi K, Fumiaki M, Sasaki S. Mercury-sensitive residues and pore site in AQP3 water channel. Biochemistry. 1997;36:13973–13978. doi: 10.1021/bi9711442. [DOI] [PubMed] [Google Scholar]
- Landowne D. Molecular motion underlying activation and inactivation of sodium channels in squid giant axons. J Membr Biol. 1985;88:173–185. doi: 10.1007/BF01868431. [DOI] [PubMed] [Google Scholar]
- Landowne D. Measuring nerve excitation with polarized light. Jpn J Physiol. 1993;43:S7–S11. [PubMed] [Google Scholar]
- Lee BW, Faller R, Sum AK, Vattulainen I, Patra M, Karttunen M. Structural effects of small molecules on phospholipid bilayers investigated by molecular simulations. Fluid Phase Equil. 2004;225:63–68. [Google Scholar]
- Loew LM, Cohen LB, Salzberg BM, Obaid AL, Bezanilla F. Charge-shift probes of membrane potential. Characterization of aminostyrylpyridinium dyes on the squid giant axon. Biophys J. 1985;47:71–77. doi: 10.1016/S0006-3495(85)83878-9. [DOI] [PMC free article] [PubMed] [Google Scholar]
- Manhas S, Swami MK, Buddhiwant P, Ghosh N, Gupta PK, Singh K. Mueller matrix approach for determination of optical rotation in chiral turbid media in backscattering geometry. Opt Express. 2006;14:190–202. doi: 10.1364/opex.14.000190. [DOI] [PubMed] [Google Scholar]
- Mayer M, Avi-Dor Y. Interaction of solvents with membranal and soluble potassium ion-dependent enzymes. Biochem J. 1970;116:49–54. doi: 10.1042/bj1160049. [DOI] [PMC free article] [PubMed] [Google Scholar]
- Mitchell J, Gallagher PJ. Peripheral neuropathy following intraneural injection of mercury compounds. Arch Toxicol. 1980;46:257–264. doi: 10.1007/BF00310442. [DOI] [PubMed] [Google Scholar]
- Mosher HS. Tetrodotoxin, saxitoxin and the molecular biology of the sodium channel. Ann N Y Acad Sci. 1986;479:1–448. [PubMed] [Google Scholar]
- Narahashi T, Moore JW, Scott WR. Tetrodotoxin blockage of sodium conductance increase in lobster giant axons. J Gen Physiol. 1964;47:965–974. doi: 10.1085/jgp.47.5.965. [DOI] [PMC free article] [PubMed] [Google Scholar]
- Oldenbourg R, Salmon ED, Tran PT. Birefringence of single and bundled microtubules. Biophys J. 1998;7:645–654. doi: 10.1016/S0006-3495(98)77824-5. [DOI] [PMC free article] [PubMed] [Google Scholar]
- Oxford GS, Pooler JP, Narahashi T. Internal and external application of photodynamic sensitizers on squid giant axons. J Membr Biol. 1977;36:159–73. doi: 10.1007/BF01868149. [DOI] [PubMed] [Google Scholar]
- Pantin CFA. On the excitation of crustacean muscle. I J Exp Biol. 1934;11:11–27. [Google Scholar]
- Pooler J. Photodynamic alteration of sodium currents in lobster axons. J Gen Physiol. 1972;60:367–387. doi: 10.1085/jgp.60.4.367. [DOI] [PMC free article] [PubMed] [Google Scholar]
- Rector DM, Poe GR, Kristensen MP, Harper RM. Light scattering changes follow evoked potentials from hippocampal Schaeffer collateral stimulation. J Neurophysiol. 1997;78:1707–1713. doi: 10.1152/jn.1997.78.3.1707. [DOI] [PubMed] [Google Scholar]
- Salzberg BM, Obaid AL, Gainer H. Large and rapid changes in light scattering accompany secretion by nerve terminals in the mammalian neurohypophysis. J Gen Physiol. 1985;86:395–411. doi: 10.1085/jgp.86.3.395. [DOI] [PMC free article] [PubMed] [Google Scholar]
- Salzberg BM, Kosterin PV, Muschol M, Obaid AL, Rumyantsev SL, Bilenko Y, Shur MS. An ultra-stable non-coherent light source for optical measurements in neuroscience and cell physiology. J Neurosci Methods. 2005;141:165–169. doi: 10.1016/j.jneumeth.2004.06.009. [DOI] [PubMed] [Google Scholar]
- Sanger JW, Sanger JM, Kreis TE, Jockusch BM. Reversible translocation of cytoplasmic actin into the nucleus caused by dimethyl sulfoxide. Proc Natl Acad Sci USA. 1980;77:5268–5272. doi: 10.1073/pnas.77.9.5268. [DOI] [PMC free article] [PubMed] [Google Scholar]
- Sawada M, Sato M. The effect of dimethyl sulfoxide on the neuronal excitability and cholinergic transmission in aplysia ganglion cells. Ann N Y Acad Sci. 1975;243:337–57. doi: 10.1111/j.1749-6632.1975.tb25375.x. [DOI] [PubMed] [Google Scholar]
- Schwartz A, Lindenmayer GE, Allen JC. The sodium-potassium adenosine triphosphatase: pharmacological, physiological and biochemical aspects. Pharmacol Rev. 1975;27:3–134. [PubMed] [Google Scholar]
- Steinbrink J, Kohl M, Obrig H, Curio G, Syré F, Thomas F, Wabnitz H, Rinneberg H, Villringer A. Somatosensory evoked fast optical intensity changes detected non-invasively in the adult human head. Neurosci Lett. 2000;291:105–108. doi: 10.1016/s0304-3940(00)01395-1. [DOI] [PubMed] [Google Scholar]
- Stepnoski RA, LaPorta A, Raccuia-Behling F, Blonder GE, Slusher RE, Kleinfeld D. Noninvasive detection of changes in membrane potential in cultured neurons by light scattering. Proc Natl Acad Sci USA. 1991;88:9382–9386. doi: 10.1073/pnas.88.21.9382. [DOI] [PMC free article] [PubMed] [Google Scholar]
- Tasaki I, Hagiwara S. Demonstration of two stable potential states in the squid giant axon under tetraethylammonium chloride. J Gen Physiol. 1957;40:859–885. doi: 10.1085/jgp.40.6.859. [DOI] [PMC free article] [PubMed] [Google Scholar]
- Tasaki I, Iwasa K, Gibbons RC. Mechanical changes in crab nerve fibers during action potentials. Jpn J Physiol. 1980;30:897–905. doi: 10.2170/jjphysiol.30.897. [DOI] [PubMed] [Google Scholar]
- Tasaki I, Watanabe A, Sandlin R, Carnay L. Changes in fluorescence, turbidity, and birefringence associated with nerve excitation. Proc Natl Acad Sci USA. 1968;61:883–888. doi: 10.1073/pnas.61.3.883. [DOI] [PMC free article] [PubMed] [Google Scholar]
- Vincent C, Pickering SJ, Johnson MH, Quick SJ. Dimethylsulfoxide affects the organization of microfilaments in the mouse oocyte. Molec Reprod Dev. 1990;26:227–235. doi: 10.1002/mrd.1080260306. [DOI] [PubMed] [Google Scholar]
- Watanabe A. Mechanical, thermal, and optical changes of the nerve membrane associated with excitation. Jpn J Physiol. 1986;36:635–643. doi: 10.2170/jjphysiol.36.625. [DOI] [PubMed] [Google Scholar]
- Watanabe A, Terakawa S. Alteration of birefringence signals from squid giant axons by intracellular perfusion with protease solution. Biochim Biophys Acta. 1976;436:833–842. doi: 10.1016/0005-2736(76)90410-7. [DOI] [PubMed] [Google Scholar]
- Yao XC, Rector DM, George JS. Optical lever recording of displacements from activated lobster nerve bundles and Nitella internodes. Appl Opt. 2003;42:2972–2978. doi: 10.1364/ao.42.002972. [DOI] [PubMed] [Google Scholar]
- Yao XC, Foust AJ, Rector DM, Barrowes B, George JS. Cross-polarized reflected light measurement of fast optical responses associated with neural activation. Biophys J. 2005;88:4170–4177. doi: 10.1529/biophysj.104.052506. [DOI] [PMC free article] [PubMed] [Google Scholar]