Abstract
Understanding three-dimensional (3D) morphology of the ankle is essential for a better total ankle replacement. Current designs neither mimic the articular geometry at the bearing surface interfaces nor match the native bony bed with the implant's external dimensions. This is likely due to insufficient anthropometric data on sizing and geometry. We performed this study to determine the range of possible sizes of ankle joints based on high-resolution 3D-CT images. Clinical 3D-CT images from twenty-one normal ankles (11 males, 10 females) were subjected to morphometric evaluation. A local coordinate system for measurement was established based on talar anatomic landmarks. Measurements included the width of the superior talar dome surface (measured at the anterior, middle, and posterior portions) and the arc radius of the talar dome. The results yielded an average anterior width of 29.9 ± 2.6 mm, a middle width of 27.9 ± 3.0 mm, and a posterior width of 25.2 ± 3.7 mm. The talar dome radius was 20.7 ± 2.6 mm. The width linearly decreased from anterior to posterior (p < 0.001). A significant gender difference was found in both the width and the radius (p-values < 0.05), except at the middle width (p = 0.07). The data describe talar topography in a Caucasian U.S. adult cohort, suggesting the capability of the 3D-CT approach for ankle morphometric evaluation and sizing for the fabrication of total ankle replacements.
INTRODUCTION
Advanced understanding of ankle anatomy is essential for designing better implants for total ankle replacement (TAR), especially when aiming to restore natural joint kinetics. 1 Although ankle morphology has been described in classic anatomical studies,2,3 the cadaver specimens utilized in these studies were from populations of subjects likely different from current U.S. norms due to differences in nutrition and ethnicity. Furthermore, in order to template for a best fit implant size for a patient, or to design a patient-specific custom-made implant, morphometric evaluation for the individual is necessary. This study was performed to develop a system for quickly measuring the essential geometric parameters required to characterize ankle morphology in vivo.
To date, ankle morphometry has been assessed based on plain radiographic measurements.4,5 However, this technique does not permit true estimation of ankle 3D morphology. For example, because of the wedged shape of the talar dome in the transverse plane (wider anteriorly than posteriorly on the superior surface),3 the maximum value would most likely be measured in a mortise view plain radiographic measurement. In addition, the intrinsic error on plain radiographic measurement is very sensitive to ankle positioning.6 Technological advances in high-resolution CT now permit for isotropic 3D evaluation of bone morphometry in vivo.7,8 We undertook this study to demonstrate the potential for using isotropic CT data to describe the distribution of talar morphologies in the population of patients we treat in Iowa.
METHODS
Three-dimensional ankle CT images were collected from a total of twenty-one patients (11 males, 10 females; average age 40 ± 10 years) who suffered from unilateral ankle osteoarthritis. These patients had bilateral ankle CT scanning for a research purpose in a related study under institutional IRB approval. Written, informed consent was obtained for all subjects. The CT examination was done with a multi-detector scanner (SOMATOM® Emotion 6, Siemens Medical Solutions, Munich, Germany), and the parameters for image acquisition were as follows: collimation 0.5 mm, slice thickness 0.63 mm with a reconstruction overlap of 0.3 mm, kV 130, mA 75, exposure time 1 sec, and FOV 150 mm. In this study, the images of only the unaffected ankles were utilized.
The CT images were subjected to on-display measurement of the talar dome dimensions with use of image visualization software (Vitrea® Version 2, Vital Images Inc., Minneapolis, MN). In order to reproducibly position sectional images (slices) for measurement, local reference planes based on talar anatomical landmarks were identified in a predetermined sequence (Figure 1). In the resulting "anatomical" local coordinate system, the transverse plane was defined as a plane parallel to both the tangential line of the superior surface and the line passing through the anterior and posterior ends of the dome surface. The coronal plane was parallel to the line passing through the middle points of the medial and lateral condyles and perpendicular to the transverse plane. The sagittal plane was perpendicular to both the transverse and coronal planes.
Figure 1.
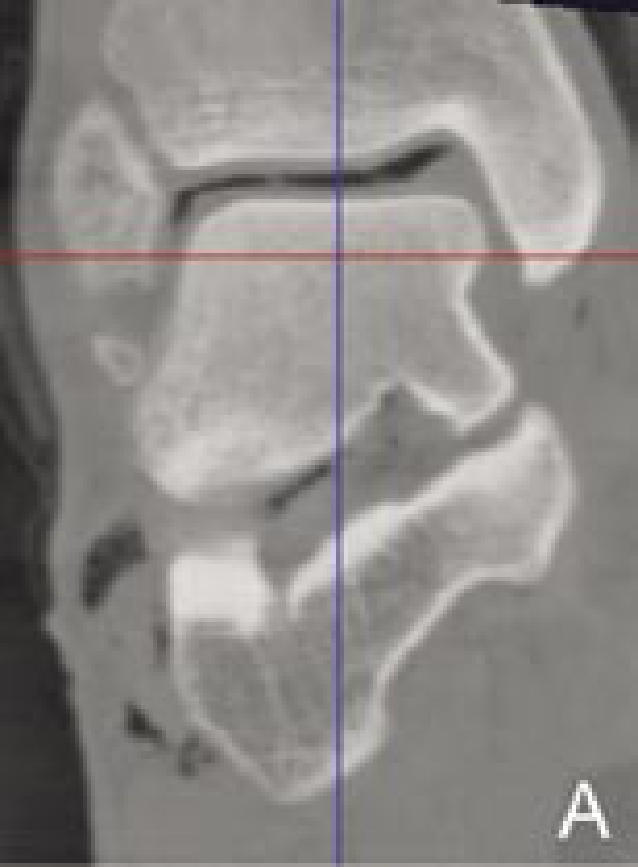
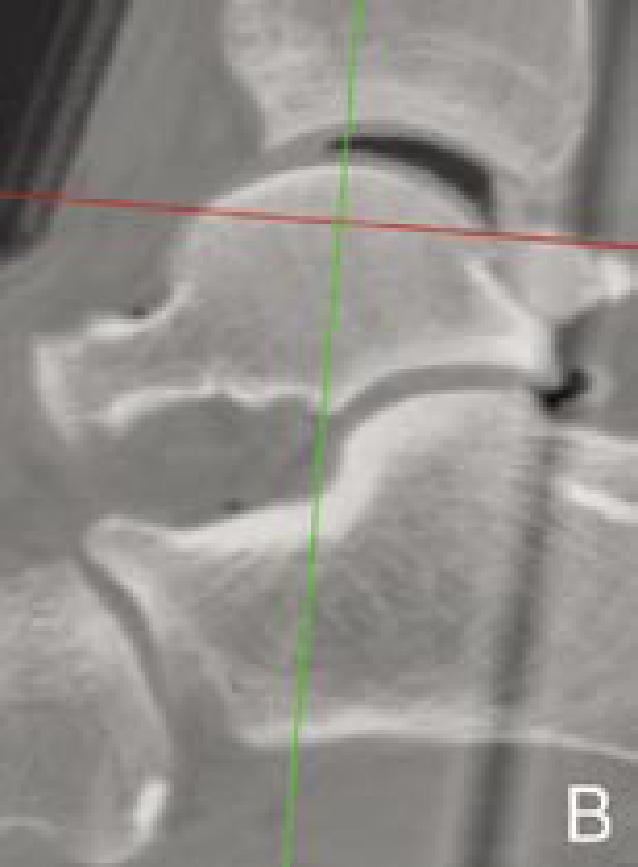
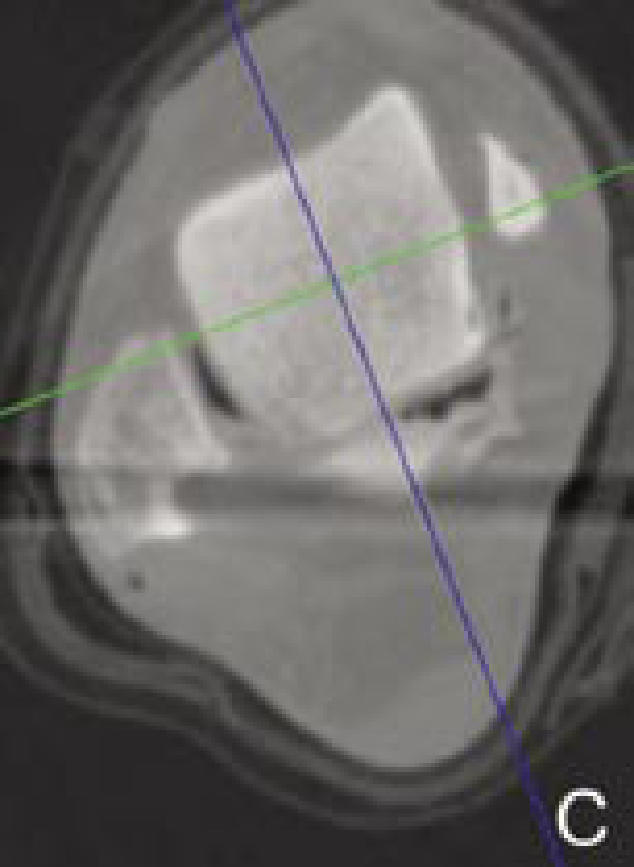
Determination of local reference planes based on anatomical landmarks. The blue, green, and red axes on the images indicate the reference planes of the 3D-CT image coordinate system (sagittal, coronal, and transverse planes, respectively). First, in a coronal section passing the middle of the talar dome (A), the coordinate system is rotated and translated so that the red axis is parallel to the superior talar surface and the blue axis will bisect the talar dome width in the middle. Next, in the sagittal section (B), the coordinate system is rotated and translated so that the red axis is parallel to the line passing through the anterior and posterior ends of the articular surface, and the green line transects the talar dome at the middle. Finally, in the transverse section (C), the coordinate system is aligned so that the blue and green axes perpendicularly transect the talar dome.
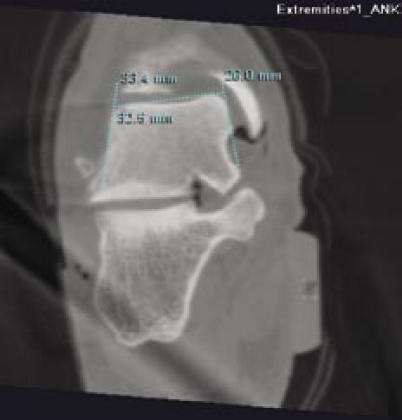
The width of the talar dome was measured at the anterior, middle, and posterior portions. The middle width was measured on the mid-coronal section. The anterior and posterior widths were measured on the 30°-oblique coronal sections rotated about the approximate center of the talar dome on the mid-sagittal plane. On each section, two lines were drawn in alignment with the medial and lateral sides of the talus, and a line connecting the two peaks on the superior talar surface was drawn to intersect the two vertical lines (Figure 2). Talar width was then measured as a distance between these intersections, similar to the method described by Stagni et al.5
Figure 2.
Measurement of the talar width on a mid-coronal slice. The vertical lines are drawn in alignment with the medial and lateral surfaces. The horizontal line is drawn connecting the two superior peaks on the talar dome, and the distance between the medial and lateral lines is the width on this slice.
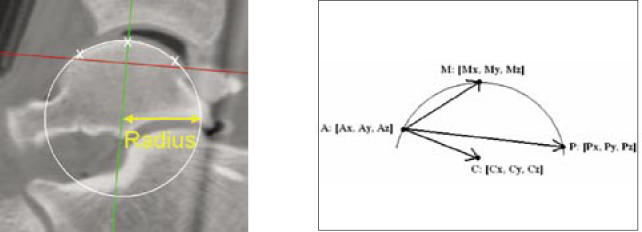
For determination of the approximate radius of the superior talar surface on the mid-sagittal section image, three points at the anterior, middle, or posterior portion of the surface (points A, M, or P, respectively) were digitized, and the x, y, z coordinates for each point were recorded. When the supposed center of the arc passing through these three points is defined as point C, because point C must be in the same plane of the other three points (Figure 3), the vector AC can be described as a function of the vectors AM and AP, with variables a and b as actual numbers, as shown in the following equation:
With use of the 'solver' tool in Microsoft® Excel 2000 (Microsoft Corp., Redmond, WA), the position of the supposed center C was optimized in order to minimize the absolute difference across the distances from each surface point while varying the variables. The distance from the optimized arc center to each surface point should be equal, and this distance was identified as the approximate radius.
Figure 3.
Talar dome arc radius is calculated from the 3D-coordinate data of three surface points digitized in a mid-sagittal slice as the radius of the circle passing through them. As the three surface points (points A, M, and P, in the model view) and the center of the circle passing them (point C) lie in the same plane, the vector AC can be identified as a function of the vectors AM and AP.
To identify the difference of talar width across anterior- posterior locations, a single factor ANOVA was utilized for statistical analysis. When a difference was found with a significance level at p < 0.05, pairwise comparisons were applied. For every measure, gender difference was assessed with a two-tailed unpaired t-test (significance level at p < 0.05).
RESULTS
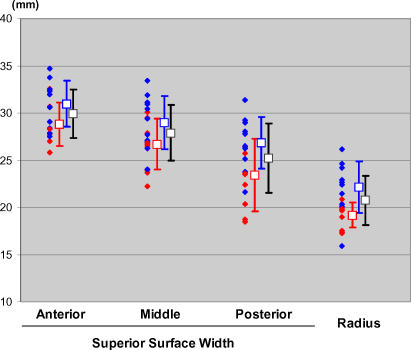
The width of the superior talar dome surface averaged 29.9 ± 2.6 mm (mean ± standard deviation) at the anterior, 27.9 ± 3.0 mm at the middle, and 25.2 ± 3.7 mm at the posterior portions (Figure 4). The width linearly decreased from anterior to posterior (p < 0.001), and the average difference between the anterior and posterior widths was 4.7 ± 2.6 mm. The radius of the surface contour on the mid-sagittal section was 20.7 ± 2.6 mm. Both the width and radius were larger in males than in females (p-values < 0.05), except for the width at the middle (p = 0.07).
Figure 4. Talar Dome Morphometric Measures (n = 21).
Morphometric data of the talar dome in the twenty-one subjects (10 females and 11 males). For each individual subject, the three talar dome widths (at the anterior, middle, and posterior parts of the superior talar surface) and arc radius (on the mid-sagittal section) are plotted as red (female) or blue (male) filled diamonds. The neighboring unfilled squares and error bars indicate the averages and standard deviations for each gender (red or blue) and those across all subjects (black.)
DISCUSSION
This study shows the potential efficacy of using isotropic CT image data to describe complex surface topographies of the talus in patients. When we compare the data acquired herein, we find that the average data of both the width and the radius of the talar dome are equivalent to those in previous studies.4,5 However, the "wedged" shape of the superior talar surface is well detailed by the current methodology but not by 2-D radiographic evaluation. Although cartilage thickness was not counted in the measurement, the technique utilized is likely useful for assessing ankle morphology and can be used as a tool to template ankle replacements or to suggest a range for the fabrication of talar surface implants.
In the present study, prior to making measurements for each subject, a local coordinate system was established using talar topography as a reference. This anatomical coordinate system allowed characterization of talar morphological features. However, determination of the coordinate system included visual identification of landmarks, which may affect reproducibility. Fortunately, slight differences in coordinate system positioning actually have minimal effects on measurements. For example, when the talar dome is assumed to be a half-cylinder, the effect of 5° of difference about the vertical axis on the width measurement is theoretically less than 1%. An automated system could be developed that would eliminate the need for manual identification of landmarks and in theory produce more reproducible results. In addition, automatic identification of the bony boundaries at each level of measurement could potentially improve reproducibility. However, the challenge of identifying distinct landmarks that could be used in an automated fashion is considerable, particularly in the setting of osteoarthritis. Thus, the current methods are likely more applicable in patients with osteoarthritis where bony landmarks can be difficult to identify.
The talar dome radius was determined by vector calculations from three points chosen on the talar dome surface under the assumption that the talar dome contour in the sagittal plane is a single arc passing through the three surface points. This assumption did not allow exploration of the previously reported feature that the talar dome radius is different across its anterior-posterior locations.2 The difference between the medial and lateral radii, another feature reported in the literature,2 also could not be explored, as talar dome radius was measured only at the mid-sagittal section. On the sagittal images taken at the medial and lateral condyles, the superior talar surface was often sectioned obliquely due to the wedged shape of the talus. This feature obscured its contour and did not allow reliable digitization of its posterior surface. Detailed morphologic evaluation of the ankle in vivo is a subject inviting future investigation.
In conclusion, the morphometric data reported in this study describe the topographical features of the superior talar dome surface in vivo more precisely than previous 2-D plain radiographic measures and is not sensitive to ankle malpositioning at the time of image capture. The 3D-CT image approach for assessing ankle geometry appears to have the potential to provide information useful for designing ankle replacement implants or for templating the optimum size of an implant.
Footnotes
Financial assistance was provided by NIH Grant AR48939
References
- 1.Leardini A. Geometry and mechanics of the human ankle complex and ankle prosthesis design. Clin Biomech. 2001;16:706–709. doi: 10.1016/s0268-0033(01)00022-5. [DOI] [PubMed] [Google Scholar]
- 2.Barnett CH, Napier JR. The axis of rotation at the ankle joint in man: Its influence upon the form of the talus and mobility of the fibula. J Anatomy. 1952;86:1–9. [PMC free article] [PubMed] [Google Scholar]
- 3.Inman VT. The joint of the ankle. Williams and Wilkins; 1976. [Google Scholar]
- 4.Fessy MH, Carret JP, Béjui J. Morphometry of the talocrural joint. Surgical Radiologic Anatomy. 1997;19:299–302. doi: 10.1007/BF01637597. [DOI] [PubMed] [Google Scholar]
- 5.Stagni R, Learndini A, Ensini A, Cappello A. Ankle morphometry evaluated using a new semi-automated technique based on X-ray pictures. Clin Biomech. 2004;20:307–311. doi: 10.1016/j.clinbiomech.2004.11.009. [DOI] [PubMed] [Google Scholar]
- 6.Tochigi Y, Suh J-S, Amendola A, Pedersen DR, Saltzman CL. Ankle alignment on lateral radiographs: Part 1: Sensitivity of measures to perturbations of ankle positioning. Foot Ankle Int. 2006;27:82–87. doi: 10.1177/107110070602700202. [DOI] [PMC free article] [PubMed] [Google Scholar]
- 7.van Schaik JJ, Verbiest H, van Schaik FD. Morphometry of lower lumbar vertebrae as seen on CT scans: Newly recognized characteristics. Am J Roentgenol. 1985;145:327–335. doi: 10.2214/ajr.145.2.327. [DOI] [PubMed] [Google Scholar]
- 8.Müller R, Hahn M, Vogel M, Delling G, Rüegsegger P. Morphometric analysis of noninvasively assessed bone biopsies: Comparison of high-resolution computed tomography and histologic sections. Bone. 1996;18:215–220. doi: 10.1016/8756-3282(95)00489-0. [DOI] [PubMed] [Google Scholar]


