Abstract
We have analyzed a newly described archaeal GimC/prefoldin homologue, termed MtGimC, by using nanoflow electrospray coupled with time-of-flight MS. The molecular weight of the complex from Methanobacterium thermoautotrophicum corresponds to a well-defined hexamer of two α subunits and four β subunits. Dissociation of the complex within the gas phase reveals a quaternary arrangement of two central subunits, both α, and four peripheral β subunits. By constructing a thermally controlled nanoflow device, we have monitored the thermal stability of the complex by MS. The results of these experiments demonstrate that a significant proportion of the MtGimC hexamer remains intact under low-salt conditions at elevated temperatures. This finding is supported by data from CD spectroscopy, which show that at physiological salt concentrations, the complex remains stable at temperatures above 65°C. Mass spectrometric methods were developed to monitor in real time the assembly of the MtGimC hexamer from its component subunits. By using this methodology, the mass spectra recorded throughout the time course of the experiment showed the absence of any significantly populated intermediates, demonstrating that the assembly process is highly cooperative. Taken together, these data show that the complex is stable under the elevated temperatures that are appropriate for its hyperthermophile host and demonstrate that the assembly pathway leads exclusively to the hexamer, which is likely to be a structural unit in vivo.
The folding of actin and tubulins in the cell depends on the concerted action of at least two molecular chaperone complexes, including the group II chaperonin TRiC and GimC/prefoldin (1–4). GimC cooperates with TRiC in vivo and, because of the co-occurrence of both complexes in eukaryotes and archaea (1, 2, 5), it has been hypothesized that GimC may represent a general cofactor of group II chaperonins (2) that is distinct from the GroES/Hsp10 type of cofactor associated with group I chaperonins such as GroEL/Hsp70 (6, 7). All eukaryotes examined so far possess a total of six GIM genes (for “Genes Involved in Microtubule biogenesis”), and the corresponding proteins have been found to assemble into a complex that binds newly synthesized nonnative actin and tubulins (4) and may serve to transfer these substrates to TRiC (2, 3). Recently, an archaeal counterpart of GimC from Methanobacterium thermoautotrophicum, MtGimC, was found to suppress the aggregation of nonnative proteins in vitro and to stabilize them for subsequent folding by chaperonins (5). MtGimC is assembled from two highly helical protein components, MtGimα and MtGimβ, which represent two general classes of Gim proteins (5).
In the present study, we have used a combined approach of MS and CD to explore the stoichiometry, quaternary structure, and stability of MtGimC. The coupling of electrospray ionization (ESI) with time-of-flight mass analyzers has greatly extended the mass-to-charge (m/z) range attainable by MS (8). Together with the careful control of experimental parameters, particularly the pressure regime after the ESI process and during acceleration of the ions within the mass spectrometer, these techniques have enabled the analysis of large protein complexes including GroEL and bacterial ribosomes (9–13). We now extend the methodology developed to enable the study of noncovalent complexes by MS to examine the thermal stability of the MtGimC complex. Implementation of a nanoflow interface incorporating a thermoelectric device capable of heating the nanoflow needle, as well as heating the drying gas, ensures that both the complex in solution and in the electrospray interface are maintained at defined temperatures up to 70°C. Moreover, we describe experiments designed to monitor the assembly process of the MtGimC complex from its component subunits. Such assembly processes are difficult to monitor, primarily because the rate of assembly is often fast, and the detection of any intermediates is difficult (14). MS, however, appears to offer an unprecedented opportunity for monitoring the assembly of macromolecular complexes because ions produced from aqueous solution can be recorded within the time scale of a few milliseconds after their formation (15) and time-of-flight analysis is capable of resolving intermediate species differing in single-protein subunits even in large assemblies (11). In addition, real-time acquisition of mass spectra enables time-dependent molecular weight changes to be observed. Here we describe the application of such an approach to monitor the assembly process of the MtGimC hexamer from its isolated components in aqueous buffer at pH 8.0.
Materials and Methods
Protein Preparation.
MtGimC was purified as described previously (5) and buffer exchanged into 10 mM ammonium acetate at pH 8.0 to give a final concentration of 15 μM by using Centricon c-100 concentrators (Amicon). For the assembly experiments, samples were buffer exchanged into 10 mM ammonium acetate, pH 8.0, by using PD-10 columns (Pharmacia). Molar ratios (1:2) of MtGimα/MtGimβ were incubated at 37°C before mixing to give a final concentration of 20 μM.
MS.
Unless stated otherwise, all spectra were recorded at room temperature on a Q-ToF or LCT mass spectrometer (Micromass, Manchester, UK) fitted with a Z-spray ionization source, by using gold-coated borosilicate needles prepared in house as described previously (16). The pressures within the quadrupole region as well as the cone and capillary voltages were optimized for each experiment as reported in the figure legends. Spectra were calibrated with CsI, and mass lynx version 3.1 (Micromass) was used for data processing.
CD.
CD experiments were carried out on a Jasco (Easton, MD) J-720 spectropolarimeter by using quartz cuvettes of 1 mm path length and 20 mM sodium phosphate buffer, pH 8.0, unless stated otherwise. Thermal unfolding experiments were performed by heating at a rate of 3 min/°C.
Results and Discussion
Masses and Stoichiometry of MtGimα, MtGimβ, and MtGimC.
Mass spectra of the two isolated subunits MtGimα (15,698.9 Da) and MtGimβ (13,862.7 Da) obtained under the normal operating pressure of the time-of-flight mass spectrometer confirm their respective masses, as shown in Table 1. Whereas MtGimβ is found to be monomeric under all MS conditions used, the application of low-energy conditions by increasing the pressure in the intermediate region of the spectrometer (10) results in two series of peaks for MtGimα, one corresponding in mass to the MtGimα monomer and the other to its dimer. Of these two, the dimeric form is found to be the most favored species under the gentlest conditions, a finding that agrees well with the results of crosslinking and gel-filtration experiments in showing that MtGimα exists predominantly as a dimer in solution (5).
Table 1.
Calculated and measured masses for the intact complex and dissociation products of MtGim C
| Subunit composition | Calculated mass/Da | Measured mass/Da | |
|---|---|---|---|
| MtGimC | MtGimα2MtGimβ4 | 86,848.6 | 86,909.8 ± 17 |
| Pentamer | MtGimα2MtGimβ3 | 72,985.9 | 72,999.4 ± 10 |
| Tetramer | MtGimα2MtGimβ2 | 59,123.2 | 59,140.4 ± 13 |
| Trimer | MtGimα2MtGimβ1 | 45,260.5 | 45,271.6 ± 11 |
| MtGimα1MtGimβ2 | 43,424.3 | 43,446.9 ± 14 | |
| Dimer | MtGimα2 | 31,397.8 | 31,399.4 ± 2 |
| Monomer | MtGimα | 15,698.9 | 15,699.8 ± 1 |
| MtGimβ | 13,862.7 | 13,861.9 ± 0.8 |
All masses have been measured from peak series containing at least four charge states. The broad nature of the peaks for the higher oligomers, most likely caused by an association of counterions or water molecules, decreases the accuracy of the m/z values, leading to an increase in the standard deviation (16).
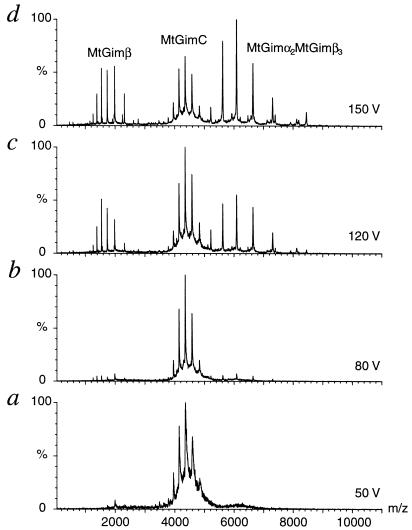
Purified MtGimC, analyzed under low-energy conditions, gives rise to a series of charge states corresponding to a mass of 86,909.8 ± 17 Da (Fig. 1a). This mass agrees well with measurements of the total mass of MtGimC by size exclusion chromatography (83.7 ± 8 kDa) (5) and is consistent with only one possible combination of the two types of protein subunits: a hexamer containing two copies of MtGimα and four copies of MtGimβ (MtGimα2MtGimβ4) giving rise to a calculated mass of 86,848.6 Da. Although the overall stoichiometry of the two subunits could be determined by sedimentation equilibrium centrifugation, it still represents a formidable task by using traditional biochemical methods to address the possibility of microscopic constitutional heterogeneities of the protein complexes present in solution, as seen in the case of heterooligomeric chaperonin TriC (17). In contrast, on the basis of the precision of the MS data reported here, the possibility of MtGimC hexamers containing different subunit stoichiometries can be firmly excluded.
Figure 1.
Collision-induced dissociation of MtGimC from a solution at 15 μM concentration in 10 mM ammonium acetate at pH 8.0. a–d were recorded on the same sample by using cone voltages from 50 V to 150 V, as indicated. a shows the charge state series of the intact complex. Increasing the cone voltage as indicated in b–d leads to a disruption of the hexamer and the observation of a pentameric species MtGimα2MtGimβ3. Correspondingly, monomeric MtGimβ can be observed at m/z values below 3,000. In d, further dissociation products are present at very low intensity: monomeric MtGimα m/z 1,000–3,000 and oligomers of the constitution α1β4, α1β3, α2β2, and α1β2 m/z 5,000–8,000. Pressures of 8.7 × 10⁻⁶ and 7.1 × 10⁻⁸ Pa were used in the source and analyzer, respectively, and a capillary voltage of 1,650 V was applied.
Arrangement of the Subunits Within MtGimC.
To investigate the quaternary architecture of the intact complex and, in particular, to assess whether the two MtGimα subunits interact directly within MtGimC, we partially disrupted the complex within the gas phase. This experiment is based on previous studies of ribosomes and the oligomeric molecular chaperone GroEL, which have shown that the resulting dissociation products can provide evidence concerning the arrangement of the subunits within an intact complex (10, 11). Starting from conditions optimized to observe intact MtGimC, we first dissociated the complex by increasing the collision energy, achieved by raising the cone voltage and keeping the pressures within the mass spectrometer constant. The most prominent series of peaks induced by such a process occurs between m/z values 5,000 and 8,000 and corresponds in mass to the pentamer MtGimα2MtGimβ3. At low m/z values, a second series of peaks, corresponding to monomeric MtGimβ, can be seen (Fig. 1 b–d). A further increase in the cone voltage leads to a greater relative intensity of the peaks assigned to the pentamer. The observed loss of a single MtGimβ molecule as an initial dissociation step suggests that these subunits are located at peripheral positions within MtGimC, thereby facilitating their selective release as the collision energy is increased.
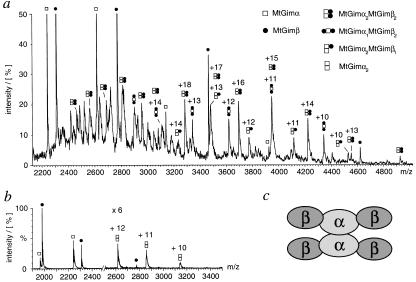
In addition to the pentamer MtGimα2MtGimβ3, a number of dissociation products can be observed at very low intensity in these spectra (Fig. 1d). However, under the high-energy conditions used in this experiment the possibility that subunit rearrangements may take place in the gas phase, generating such low-intensity species, cannot be fully ruled out. Experiments were therefore carried out in which both the collision energies and the pressure regimes within the mass spectrometer were chosen to maximize the population of small oligomeric dissociation products (Fig. 2a). Under these conditions, the major species observed in the mass spectra can be assigned to the individual subunits MtGimα and MtGimβ. However, peaks corresponding to a number of oligomeric species can also be observed, including those from a tetramer (MtGimα2MtGimβ2), the most highly populated oligomer, and two low-intensity trimers (MtGimα2MtGimβ1 and MtGimα1MtGimβ2). The absence of a trimer (MtGimβ3) and the observation of peaks originating from the MtGimα dimer at intensities of between 5 and 10% of the peak height of MtGimβ (Fig. 2b) yield a self-consistent set of dissociation products, compatible with a model proposed previously for MtGimC. In this model, two MtGimα subunits are suggested to form a structural nucleus about which MtGimβ subunits are organized to form intact MtGimC (Fig. 2c) (5).
Figure 2.
Low molecular weight dissociation products of MtGimC. (a) Dissociation of MtGimC after a 1-in-25 dilution into water of the sample solution used to obtain the spectra in Fig. 1. Expansion of the region from 2,000 to 5,000 m/z demonstrates the presence of a tetramer, MtGimα2MtGimβ2, and two trimers, MtGimα2MtGimβ1 and MtGimα1MtGimβ2. The capillary and cone voltages were set to 1,750 V and 150 V, respectively, and pressures of 1.9 × 10⁻⁵ and 7.1 × 10⁻⁷ Pa were recorded in the source and analyzer. (b) MtGimα dimer is formed as a dissociation product of MtGimC under conditions that strongly destabilize the complex. The data were recorded on a 1-μM sample in 10 mM ammonium acetate, pH 8.0. Cone and capillary voltages of 100 V and 1,480 V, respectively, were applied, and an analyzer pressure of 7.8 × 10⁻⁸ Pa was used. (c) Proposed model of the MtGimC structure (5).
Thermal Stability of MtGimC.
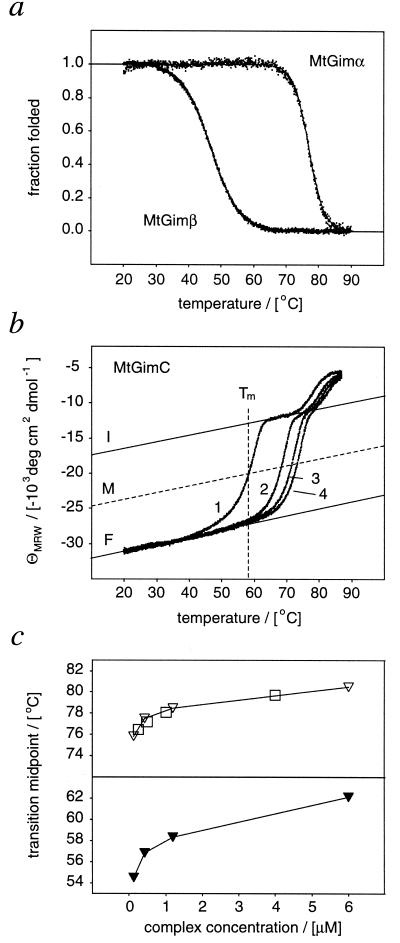
As M. thermoautotrophicum is a hyperthermophile growing optimally at 65°C, the effects of elevated temperatures on the structure of MtGimC were examined. By analysis of the temperature dependence of the far-UV CD ellipticity at 222 nm, the isolated MtGimα dimer appears to be highly stable against thermal denaturation (Fig. 3a) with a transition midpoint (Tm value) of 78.1 ± 0.8°C for a 2-μM sample. In contrast, isolated MtGimβ was found to denature at a much lower temperature (46.9 ± 1°C) (Fig. 3a). Interestingly, the thermal unfolding curve of the MtGimC hexamer contains two transition regions (Fig. 3b). The high-temperature transition depends on the protein concentration, indicating the dissociation of an oligomeric species (18). The Tm values of this transition correlate precisely with those for the unfolding of the MtGimα dimer at identical concentrations (Fig. 3c). By contrast, the Tm value of the low-temperature transition does not match exactly the data for either of the individual subunits. Within the concentration range investigated, however, this transition was found to be at a significantly higher temperature than that recorded for MtGimβ alone. Again, the transition has marked concentration dependence, indicating the dissociation of an oligomeric species. This transition is presumably either that of the entire complex or results from the dissociation and unfolding of the MtGimβ subunits releasing a MtGimα core, which subsequently unfolds at a higher temperature. This interpretation corresponds well with gel-filtration experiments carried out at 20°C and 50°C, demonstrating the structural integrity of MtGimC at the higher temperature (not shown). The reason for the distortion of the low-temperature unfolding transition of MtGimC from a symmetrical shape (Fig. 3b), however, remains to be established. Given the structural integrity of MtGimC at high temperature, such behavior may well indicate a partial loss of structural compactness within an intact complex on heating. For comparison, structural plasticity of undisrupted oligomers has been demonstrated in the function of several molecular chaperone complexes including GroEL (19, 20), GroES (21, 22), and α-crystallin (23).
Figure 3.
Thermal unfolding of MtGimα, MtGimβ, and MtGimC monitored by CD at 222 nm. (a) Thermal unfolding of isolated MtGimα and MtGimβ subunits displayed as the fractions folded and fitted to a two-state transition, as described previously (26). Subsequent cooling of the heated samples resulted in curves of identical shape and corresponded to similar Tm values (not shown). (b) Thermal unfolding of 1.2 μM MtGimC shown as the temperature dependence of the mean residue weight ellipticity (ΘMRW) at 222 nm. Changing the KCl concentration from 0 M (1), 0.2 M (2), 0.4 M (3), and 0.6 M (4) shifts the Tm values for the denaturation of MtGimC to higher temperatures. Whereas the high-temperature transition can be fitted with a two-state model, the transition midpoint of the distorted low-temperature transition was defined by approximating lines corresponding to the temperature dependences of ΘMRW of the folded complex (F) and the intermediate (I), as shown in the plot. The temperature at which the observed ΘMRW intersects a third line (M) representing the midpoint between F and I was used as the denaturation temperature. The distorted shape and Tm values did not change by using Tris- or ammonium acetate-based buffer systems or slower heating rates. The low-temperature transition is irreversible, as cooling produces a refolding curve characteristic of a cooperative process and, relative to the unfolding transition, a decreased Tm value (48.3 ± 1.5°C). (c) Concentration dependence of the transition midpoints of the MtGimC and MtGimα melting curves in the absence of salt. The Tm values of both the low- and high-temperature transition Tm values of MtGimC are concentration dependent (▾, low-temperature transition; ▿, high-temperature transition). The concentration dependence of the high-temperature transition corresponds to that of MtGimα, □.
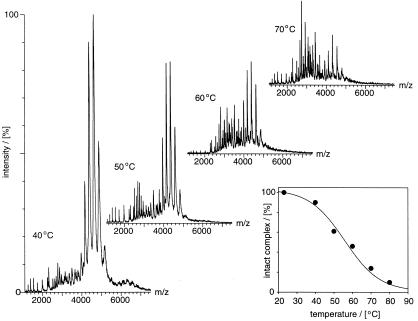
To examine the thermal stability of the complex by MS, a thermal nanoflow device was constructed that allowed a reliable adjustment of the temperature of the solution containing MtGimC. As nanoflow droplets have been calculated to contain on average one molecule per droplet (24), a potential reassembly of the complex from its dissociated subunits because of the evaporative cooling effects of the ionization process (25) may be effectively discounted. At temperatures below 60°C, MtGimC accounts for more than 50% of the total ion intensity, indicating that more than half of the complex remains intact under these conditions (Fig. 4). On increasing the temperature to 70°C, the relative intensity of the signal assigned to intact MtGimC decreases, and that of the dissociation products increases. At temperatures between 50 and 70°C, still below the melting temperature of the MtGimα dimer, MtGimα is evident both as a monomer and a dimer, presumably reflecting the stability of the latter in solution (5). MtGimβ is observed as a monomer and also as a dimer and a trimer. The latter are likely to represent aggregated or misfolded species originating from denatured MtGimβ present at high temperatures. Both CD and MS data therefore support a model in which the association of MtGimα with MtGimβ to form MtGimC stabilizes the complexed MtGimβ subunits against thermal denaturation.
Figure 4.
Thermal dissociation of MtGimC by MS. Spectra of MtGimC were recorded at the temperatures indicated in the plot by using aliquots from the same solution with identical spectrometer settings. Peaks corresponding to intact MtGimC appear between 4,000 and 5,000 m/z and represent the most intense charge state series in the spectra recorded at low temperature. By raising the temperature, MtGimC dissociates in solution giving rise to various species including MtGimβ, the dominant series at m/z values below 2,000, and α2, β2, β3 between m/z 2,000 and 5,000. The latter two species were observed at temperatures above the Tm of MtGimβ and appear to represent aggregated species. For each spectrum, MtGimC (12 μM) was placed in the main body of a borosilicate glass capillary and incubated in a thermally controlled probe. The probe incorporates a thermoelectric device with a platinum resistive sensor and direct relay feedback control and is accurate to ±0.1°C (M.A.T., unpublished work). Each sample was equilibrated at the desired temperature for 15 min. After this time, a suitable back pressure was applied to drive the sample to the tip of the capillary and a voltage applied to commence the nanoflow electrospray process. The temperature within the nanoflow source and the countercurrent drying gas was maintained to be the same as the solution, achieved by a flow of nitrogen gas (140 l/h) through a thermally controlled manifold. Capillary and cone voltages were set to 1,400 V and 120 V, and a pressure of 2.35 × 10⁻⁸ Pa was recorded in the analyzer. Each spectrum in the figure represents the summation of 10 5-s acquisition steps. (Inset) The fraction of complex present was calculated from the sum of the intensity of the ions assigned to the complex relative to the total ion counts in each of the spectra. This value is expressed as the percentage of the ion intensity of the complex at 22°C, set to 100% on the basis of its population under ideal conditions, as shown in Fig. 1a.
The finding that the thermal dissociation experiments result in a full disruption of the complex, without the loss of individual subunits, suggests a high degree of structural cooperativity of MtGimC. Such cooperativity is of significance in terms of the population in vivo of intact MtGimC relative to its isolated subunits. In particular it indicates that the hexamer is likely to be the only species present under conditions where the complex is stable. Solution conditions such as ionic strength or presence of saccharides are known to modify significantly the stability of a protein inside a cell relative to a test tube (18). Choosing the ionic strength as one representative factor, we examined the influence of an increase in the potassium chloride concentration on the stability of MtGimC (Fig. 3b). Addition of, for example, 0.2 M KCl shifts the transition midpoint from 58.3 ± 1.2°C to 68.2 ± 1.2°C, a value above the optimal growth temperature of M. thermoautotrophicum. Taken together, these data clearly indicate that the MtGimα2MtGimβ4 hexamer is a stable structural unit under conditions likely to be relevant to the functioning of this complex in vivo.
Real-Time Observation of the Assembly of MtGimC.
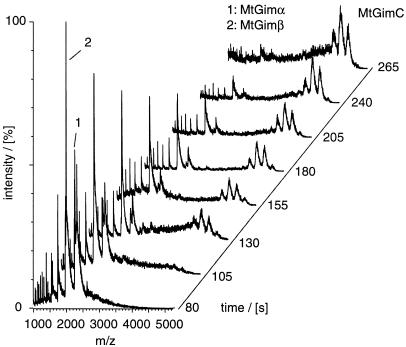
To complement the studies of the thermal dissociation of MtGimC, we have also investigated the assembly of the complex from its component subunits. To do this, solutions containing the isolated subunits were mixed at 37°C to give a 1:2 molar ratio of MtGimα/MtGimβ and were analyzed immediately. Mass spectra, recorded at various time points, were used to monitor the time-dependent mass changes of the various species (Fig. 5). The first spectrum was recorded after 80 s, the effective dead time required in the procedure for mixing and sample injection. At this time, charge-state series are evident corresponding in mass to the MtGimβ monomer and to the MtGimα monomer and dimer. In the spectra recorded 130 s after the mixing step, however, a series of broad high m/z peaks can be seen, with a molecular weight corresponding to intact MtGimC. After 205 s, only very low intensity peaks are found for MtGimα, and the peaks assigned to the intact complex are now much higher in intensity than those assigned to MtGimβ. After 265 s, the spectrum shows that the major species present in solution is MtGimC. Indeed, no other species can be detected in any of the spectra, a finding that implies that the assembly of the MtGimC complex does not progress through stable intermediates, and that such species, if formed, become rapidly converted to the hexamer.
Figure 5.
Mass spectra recorded for a 2:1 mixture of MtGimβ/MtGimα at various time intervals after mixing the two subunits. Each trace represents the average of five 5-s acquisition steps and has been normalized according to the total ion count in each spectrum. The capillary voltage was set to 1,400 V with a cone voltage of 90 V. The analyzer pressure was recorded as 1.3 × 10⁻⁷ Pa. The experiment was repeated five times to confirm the reproducibility of the assembly process.
Conclusions
MtGimC is a hexamer composed of two protein subunits representing two classes of Gim proteins. The α class has two eukaryotic members (5), a finding that matches the observation that MtGimC contains two protein subunits of this class. Correspondingly, the β class is represented by four proteins in eukaryotes (5) and occurs as four subunits within MtGimC, arguing that the basic architecture of GimC is evolutionarily conserved. The observed pattern of dissociation products generated by MS is consistent with a model for MtGimC in which MtGimα forms a dimeric core with two MtGimβ subunits bound to each MtGimα subunit (Fig. 2c) (5).
The high stability of the MtGimα dimer and the presence of four α/β contacts but only one α/α interaction are both consistent with the experimental observation that the loss of one MtGimβ subunit is the primary and indeed dominant dissociation step. On the basis of its thermal stability, revealed by CD and MS, we conclude that the intact MtGimC hexamer is most likely to represent one structural unit inside its thermophilic host M. thermoautotrophicum. Assembly of MtGimC from isolated subunits to the hexameric complex is consistent with a cooperative process reflecting a highly favorable association of the six protein subunits. More generally, this study highlights the power of MS to probe not just the stoichiometry of multiprotein complexes but also the pathways of assembly and disassembly of interacting subunits in macromolecular complexes.
Acknowledgments
This work is a contribution from the Oxford Centre for Molecular Sciences, which is supported by the Biotechnology and Biological Sciences Research Council, Medical Research Council, and Engineering and Physical Sciences Research Council. M.F. thanks the Cecil Rhodes Trust for a scholarship. M.A.T. and A.A.R. are grateful for support from CBD and Zeneca pharmaceuticals, respectively. M.R.L. acknowledges a European Molecular Biology Organization fellowship. The research of C.M.D. is supported in part by the Wellcome Trust. C.V.R. is a Royal Society University Research Fellow.
Footnotes
This paper was submitted directly (Track II) to the PNAS office.
See commentary on page 14025.
Article published online before print: Proc. Natl. Acad. Sci. USA, 10.1073/pnas.240326597.
Article and publication date are at www.pnas.org/cgi/doi/10.1073/pnas.240326597
References
- 1.Geissler S, Siegers K, Schiebel E. EMBO J. 1998;17:952–966. doi: 10.1093/emboj/17.4.952. [DOI] [PMC free article] [PubMed] [Google Scholar]
- 2.Vainberg I E, Lewis S A, Rommelaere H, Ampe C, Vandekerckhove J, Klein H L, Cowan N J. Cell. 1998;93:863–873. doi: 10.1016/s0092-8674(00)81446-4. [DOI] [PubMed] [Google Scholar]
- 3.Siegers K, Waldmann T, Leroux M R, Grein K, Shevchenko A, Schiebel E, Hartl F U. EMBO J. 1999;18:75–84. doi: 10.1093/emboj/18.1.75. [DOI] [PMC free article] [PubMed] [Google Scholar]
- 4.Hansen W J, Cowan N J, Welch W J. J Cell Biol. 1999;145:265–277. doi: 10.1083/jcb.145.2.265. [DOI] [PMC free article] [PubMed] [Google Scholar]
- 5.Leroux M R, Fändrich M, Klunker D, Siegers K, Lupas A N, Brown J R, Schiebel E, Dobson C M, Hartl F U. EMBO J. 1999;18:6730–6743. doi: 10.1093/emboj/18.23.6730. [DOI] [PMC free article] [PubMed] [Google Scholar]
- 6.Saibil H R, Zheng D, Roseman A M, Hunter A S, Watson G M F, Chen S, Dermauer A A, Ohara B P, Wood S P, Mann N H, et al. Curr Biol. 1993;3:265–273. doi: 10.1016/0960-9822(93)90176-o. [DOI] [PubMed] [Google Scholar]
- 7.Xu Z, Horwich A L, Sigler P B. Nature (London) 1997;388:741–750. doi: 10.1038/41944. [DOI] [PubMed] [Google Scholar]
- 8.Verentchikov A, Ens W, Standing K G. Anal Chem. 1994;66:126–133. doi: 10.1021/ac00073a022. [DOI] [PubMed] [Google Scholar]
- 9.Lei Q P, Cui X Y, Kurtz D M, Amster I J, Chernushevich I V, Standing K G. Anal Chem. 1998;70:1838–1846. doi: 10.1021/ac971181z. [DOI] [PubMed] [Google Scholar]
- 10.Rostom A A, Robinson C V. J Am Chem Soc. 1999;121:4718–4719. [Google Scholar]
- 11.Rostom A A, Fucini P, Benjamin D R, Juenemann R, Nierhaus K H, Hartl F U, Dobson C M, Robinson C V. Proc Natl Acad Sci USA. 2000;97:5185–5190. doi: 10.1073/pnas.97.10.5185. [DOI] [PMC free article] [PubMed] [Google Scholar]
- 12.Zhang Z G, Krutchinsky A, Endicott S, Realini C, Rechsteiner M, Standing K G. Biochemistry. 1999;38:5651–5658. doi: 10.1021/bi990056+. [DOI] [PubMed] [Google Scholar]
- 13.Tito M A, Tars K, Valegard K, Hadju J, Robinson C V. J Am Chem Soc. 2000;122:3550–3551. [Google Scholar]
- 14.Liljas L. Curr Opin Struct Biol. 1999;9:129–134. doi: 10.1016/s0959-440x(99)80017-7. [DOI] [PubMed] [Google Scholar]
- 15.Kebarle P, Tang L. Anal Chem. 1993;65:972–986. [Google Scholar]
- 16.Nettleton E J, Sunde M, Lai Z H, Kelly J W, Dobson C M, Robinson C V. J Mol Biol. 1998;281:553–564. doi: 10.1006/jmbi.1998.1937. [DOI] [PubMed] [Google Scholar]
- 17.Liou A K F, Willison K R. EMBO J. 1997;16:4311–4316. doi: 10.1093/emboj/16.14.4311. [DOI] [PMC free article] [PubMed] [Google Scholar]
- 18.Li W, Grayling R A, Sandman K, Edmondson S, Shriver J W, Reeve J N. Biochemistry. 1998;37:10563–10572. doi: 10.1021/bi973006i. [DOI] [PubMed] [Google Scholar]
- 19.Braig K, Adams P D, Brünger A T. Nat Struct Biol. 1995;2:1083–1094. doi: 10.1038/nsb1295-1083. [DOI] [PubMed] [Google Scholar]
- 20.Chen L, Sigler P B. Cell. 1999;99:757–768. doi: 10.1016/s0092-8674(00)81673-6. [DOI] [PubMed] [Google Scholar]
- 21.Mande S C, Mehra V, Bloom B R, Hol W G J. Science. 1996;271:203–207. doi: 10.1126/science.271.5246.203. [DOI] [PubMed] [Google Scholar]
- 22.Hunt J F, Weaver A J, Landry S J, Gierasch L, Deisenhofer J. Nature (London) 1996;379:37–45. doi: 10.1038/379037a0. [DOI] [PubMed] [Google Scholar]
- 23.Carver J A. Prog Ret Eye Res. 1999;18:431–462. doi: 10.1016/s1350-9462(98)00027-5. [DOI] [PubMed] [Google Scholar]
- 24.Wilm M, Mann M. Anal Chem. 1996;68:1–8. doi: 10.1021/ac9509519. [DOI] [PubMed] [Google Scholar]
- 25.Drahos L, Vékey K. J Am Soc Mass Spectrom. 1998;10:323–328. [Google Scholar]
- 26.Chiti F, van Nuland N A J, Taddei N, Magherini F, Stefani M, Ramponi G, Dobson C M. Biochemistry. 1998;37:1447–1455. doi: 10.1021/bi971692f. [DOI] [PubMed] [Google Scholar]


