

Abstract
Dystrophic neurites are swollen dendrites or axons recognizable near amyloid plaques as a part of important pathological feature of Alzheimer's disease (AD). We report herein that reticulon 3 (RTN3) is accumulated in a distinct population of dystrophic neurites named as RTN3 immunoreactive dystrophic neurites (RIDNs). The occurrence of RIDNs is concomitant with the formation of high-molecular-weight RTN3 aggregates in brains of AD cases and mice expressing mutant APP. Ultrastructural analysis confirms accumulation of RTN3-containing aggregates in RIDNs. It appears that the protein level of RTN3 governs the formation of RIDNs because transgenic mice expressing RTN3 will develop RIDNs, initially in the hippocampal CA1 region, and later in other hippocampal and cortical regions. Importantly, we show that the presence of dystrophic neurites in Tg-RTN3 mice causes impairments in spatial learning and memory, as well as synaptic plasticity, implying that RIDNs potentially contribute to AD cognitive dysfunction. Together, we demonstrate that aggregation of RTN3 contributes to AD pathogenesis by inducing neuritic dystrophy. Inhibition of RTN3 aggregation is likely a therapeutic approach for reducing neuritic dystrophy.
Keywords: BACE1, diffuse plaques, dystrophic neurites, Nogo, reticulon
Introduction
Alzheimer's disease (AD) is the most common age-related neurodegenerative disorder. The presence of neuritic plaques, which mainly contain deposits of β-amyloid peptide (Aβ) surrounded by inflammatory glial cells and dystrophic neurites, is considered one of the correlative features of the preclinical and earliest stages of AD (Morris and Price, 2001). Dystrophic neurites, referred to aberrant neuritic sproutings, swollen dendrites and/or axons (Dickson et al, 1988; Lenders et al, 1989; Onorato et al, 1989). Although Aβ deposits are also present in the brains of elderly non-demented (ND) individuals, the Aβ in ND is mainly present in a dispersed and diffuse form that lacks the dystrophic neurites and reactive glial cells characteristic of AD (Joachim et al, 1989).
Although genetic evidence supports an important role of Aβ in AD pathogenesis (Tanzi and Bertram, 2005; Masters and Beyreuther, 2006), the occurrence of dystrophic neurites, their precise molecular nature, temporal and spatial evolution, formation and pathophysiological significance are not yet understood. Dystrophic neurites in AD are previously suggested to be divided into three subgroups based on the predominant presence of the immunoreactive markers neurofilament, tau or chromogranin A (Masliah et al, 1993; Vickers et al, 1996; Dickson et al, 1999). Morphologically, dystrophic neurites in AD brains are recognized as bulb and/or ring-like structures. Based on the shapes and presence of various immunoreactive marker proteins, dystrophic neurites are hypothetically suggested to develop through three stages: first, largely labeled by neurofilaments, then predominantly by tau and, finally, stained with thioflavin S (Vickers et al, 1996). However, detection of a growing list of proteins, including APP (Shoji et al, 1990), APLP-2 (Crain et al, 1996), ubiquitin (Kowall and Kosik, 1987; Perry et al, 1987; Onorato et al, 1989), GAP-43 (Masliah et al, 1992) and SNAP-25 (Ferrer et al, 1998), in dystrophic neurites suggests a more complicated process in their formation. Current studies have not yet demonstrated whether these proteins present in the neurites are needed for an active process or are just passively trapped within dystrophic neurites.
The detection of dystrophic neurites surrounding amyloid plaques in mouse models expressing mutant APP implies that the formation of dystrophic neurites is a secondary event to Aβ deposition. Treatment of PDAPP transgenic mice with anti-Aβ to reduce amyloid deposition is shown to reduce the size and numbers of dystrophic neurites following reduction of Aβ (Brendza et al, 2005). However, it is still unclear whether removal of Aβ deposits is sufficient to abolish neuritic abnormality. Examination of postmortem brains of cases that went through Aβ vaccination trials indicates that two cases showed extensive areas cleared of plaques after 1–2 years of immunization, while tau-containing dystrophic neurites remained (Nicoll et al, 2006). Arguably, Aβ deposition is unlikely the sole factor that causes the formation of dystrophic neurites in AD, because Aβ deposition in a diffuse form is indeed present in elderly ND individuals. Therefore, in order to decipher AD-specific neuritic abnormality, it is important to understand the precise morphological and biochemical changes associated with the formation of dystrophic neurite.
While examining levels of reticulon (RTN) proteins in AD postmortem brains, we have discovered that RTN3 is markedly accumulated within dystrophic neurites in brains of AD patients and APP transgenic mice. The reticulon family of proteins (RTN1–RTN4), and particularly neuronal-enriched RTN3, has recently been identified as a negative modulator of BACE1, also known as Alzheimer's β-secretase (He et al, 2004; Murayama et al, 2006). RTN/Nogo proteins (RTNs), distinguished by the presence of a C-terminal reticulon-homology domain (RHD), are largely regarded as membrane-bound proteins shaping the tubular networks of the endoplasmic reticulum (ER) (Voeltz et al, 2006). However, RTNs can also be found along the secretory compartments and lipid rafts at lower levels (Oertle and Schwab, 2003; Yan et al, 2006). Highly conserved residues at the C-terminal region mediate the interaction of RTNs with BACE1 (He et al, 2006).
More important than the aforementioned finding of RTN3 as a marker of dystrophic neurites in AD brains, we further observed biochemical changes of RTN3 in correlation with the occurrence of dystrophic neurites. Specifically, RTN3 aggregates were accumulated in dystrophic neurites of AD samples. These results prompted us to examine whether RTN3 plays a role in forming dystrophic neurites by using RTN3 transgenic mice. Remarkably, Tg-RTN3 mice develop dystrophic neurites that are morphologically similar to those seen in AD brains, and their formation relies on the expression levels of RTN3 and an aging process, and can be completely independent of the occurrence of amyloid deposition. Finally, we demonstrate that the presence of dystrophic neurites in Tg-RTN3 mice impairs spatial learning and memory, as well as reduction in long-term potentiation (LTP). As a result, we are able to link, for the first time, the presence of dystrophic neurites to cognitive failure in Alzheimer's patients. Together, our findings suggest that dystrophic neurites do not necessarily form through passive process. If increased accumulation and aggregation of RTN3 occurs early under an abnormal circumstance, the formation of dystrophic neurites might precede the occurrence of excessive amyloid deposition within the AD brain.
Results
RTN3 is enriched in dystrophic neurites of AD brains
To investigate the effect of RTN3 localization on the formation of amyloid plaques, we examined postmortem brain sections with the previously well-characterized RTN3 N-terminal (R454) and C-terminal (R458) antibodies (He et al, 2004). Interestingly, both antibodies detected abnormally distributed RTN3 immunoreactivity (RI) surrounding amyloid plaques in the AD postmortem brains (Figure 1A and B). Morphologically, globular-, bulb- and ring-shaped profiles were present in the RI (Figure 1A and B). Since the RI was clearly similar to the previously described dystrophic neurites in AD brains, we tested potential coexistence of the RI with known markers for dystrophic neurites. Surprisingly, we found that only a small portion of the RI overlapped with the dystrophic neurites labeled by phosphorylated tau, ubiquitin, neurofilaments or APP (Figure 1C–E and Supplementary Figure 1A–G). The overlap between RI and thioflavin S-labeled dystrophic neurites was also partial (Figure 1F). Since we failed to identify a protein to coexist completely with RTN3 in RTN3 immunoreactive dystrophic neurites (RIDNs), and RIDNs appear to cover a broader area, RIDNs may represent a distinct population of dystrophic neurites in the postmortem AD samples. Moreover, RTN3 does not mark tangles and is present distinctly less in neurophil threads.
Figure 1.

RTN3 labels dystrophic neurites in AD brain samples. (A, B) Sections of AD postmortem brain tissues were immunostained with antibody 6E10 for amyloid plaques (red) and antibodies R454 and R458 recognizing the N-terminus and C-terminus of RTN3 (green), respectively, for labeling dystrophic neurites around amyloid plaques. The red immunoreactivity of phospho-tau (AT8; C), ubiquitin (D) or neurofilaments (Smi31: E) in dystrophic neurites showed only partial colocalization with the green RTN3 immunoreactivity. (F) The AD brain section was first chemically stained with thioflavin S (green) to label dystrophic neurites and tangles and then reacted with antibody R458 (red). Blue or purple signals in the figures represent autofluorescence, and arrowheads denote tangles. (G, H) Immediately adjacent AD brain sections (12 μm thickness) were either labeled with antibody 6E10 (G) or R458 (H) in an immunohistochemical method. The dystrophic neurites labeled by R458 are largely colocalized with amyloid plaques, as indicated with dotted circles. The yellow arrows indicate that amyloid plaques are evident but that nearby dystrophic neurites are not found. The white arrows indicate the opposite. (I, J) RIDNs are not found near diffuse amyloid plaques that are evident in ND brains. Antibody R458 clearly labels neurons in normal frontal cortical neurons. Scale bar in (A–F), 30 μm; (G–J), 125 μm.
Since RTN3 is largely considered an ER membrane protein (Oertle and Schwab, 2003; Yan et al, 2006), we tested the possibility that RIDNs stem from abnormal ER structures or other secretory vesicles. The same AD frozen sections were immunostained with antibodies to markers for the ER vesicles (calnexin and GRP-78), the Golgi/TGN (β-COP and p58), the early endosome (EEA1) and dendrites (MAP2), as well as synaptic vesicles (SV2). Although these marker antibodies labeled the expected structures, none of the above was accumulated within RIDNs (see examples in Supplementary Figure 1H). Furthermore, RIDNs did not overlap with antibodies specific to microglia and astrocytes (Supplementary Figure 1I–J).
Consistent with the knowledge that dystrophic neurites are found mainly in neuritic plaques in AD brains (Figure 1G and H), we have not yet observed RIDNs near diffuse plaques in ND control brain samples as evidenced in Figure 1I and J together with the summary in Supplementary Table 1. In APP transgenic mouse models, RIDNs were found to either surround a core plaque or intermingle with large plaques (Supplementary Figure 1K). Antibody R461, that specifically recognizes Nogo-A/B only, detected oligodendrocytes in these samples (Supplementary Figure 1L). The failure to detect Nogo in dystrophic neurites is likely due to the epitope being preferential to human sequence. Taken together, our results show that RTN3 is specifically and abnormally accumulated in a distinct population of dystrophic neurites in Alzheimer's brains.
Correlation of RTN3 aggregates with the enrichment of RTN3 in dystrophic neurites
Since the levels of RTN3 are likely important for RTN3 accumulation in dystrophic neurites and its effects on negative modulation of BACE1 activity, we then examined protein levels of RTN3 in postmortem brains of AD patients compared with ND controls. Western blot analysis of samples with antibody R458 from 18 AD and 10 ND samples exhibited variable levels of the 25 kDa full-length RTN3 protein (denoted by an arrowhead in Figure 2A). Quantification of RTN3 chemiluminescent signals after normalizing them to the loading control calnexin, another ER protein, revealed a significant reduction in RTN3 levels in AD samples compared with ND controls (Figure 2B). The reduced levels of RTN3 may reduce its negative modulation of BACE1 activity.
Figure 2.

RTN3 forms more HMW oligomers in AD brains. (A) Western analysis of frozen frontal cortexes from 18 AD samples and 10 ND controls indicated that the levels of RTN3 monomer were reduced while HMW-RTN3 was increased in most AD samples. The order of samples loaded into each lane was based on the order of sample numbers (Emory sample collections). (B) Quantitative analysis of monomeric RTN3 levels after normalizing the RTN3 to calnexin exhibited significant reduction of RTN3 monomer in AD samples compared with ND controls. (C, D) RTN3 forms SDS-resistant oligomers in vitro. Lysates from HR3M cells that stably express myc-tagged RTN3 were used for affinity purification with the myc antibody. Aliquots of elutes were resolved on an SDS–PAGE gel and stained by Colloidal blue (C). Aliquots were also examined by Western blot and formation of SDS-resistant RTN3 multimers was seen in elutes (D). Each dot represents one molecule of RTN3. (E) Myc-tagged rab5 was similarly enriched by affinity purification with anti-myc, but oligomers were not seen. L, lysates; FT, flow-through from affinity column; W1 and W2, wash 1 and wash 2; E, elution and M, protein MW marker.
Although the levels of monomeric RTN3 seemed reduced, we surprisingly noticed an increased presence of high-molecular-weight RTN3 (HMW-RTN3) proteins in a majority of the AD samples compared with the ND samples (Figure 2A, visible upon a longer exposure). Incubation of the same blots with antibody R454 confirmed that HMW-RTN3 indeed contains full-length RTN3 (data not shown). Furthermore, similar HMW-RTN3 was also detectable in brain samples from the APP/PSEN1 transgenic mice (Supplementary Figure 2), suggesting that the enhanced levels of HMW-RTN3 correlate with the formation of neuritic plaques. These results suggest that formation of HMW-RTN3 is coincident with the occurrence of RIDNs.
To explore whether RTN3 has the capacity to form HMW-RTN3 in vitro, we purified RTN3 from lysates of HR3M cells, which stably express myc-tagged RTN3, by immunoaffinity chromatography. As expected, the Colloidal blue-stained SDS gel showed a predominant band that migrated at a molecular weight of 27 kDa (Figure 2C). Additional bands at higher-molecular-weight ranges were determined to be RTN3 dimers, trimers and oligomers by both Western analysis (Figure 2D) and by tryptic peptide sequencing (Supplementary Table 2). In a control experiment, we showed that the same C-terminal myc-tagged rab5, purified by a similar method, did not form rab5 oligomers (Figure 2E). BACE1, another membrane-bound protein, when either enriched by immunoprecipitation (He et al, 2004) or purified from CHO cells (Yan et al, 1999), also fails to form stable SDS-resistant oligomers. Therefore, these in vitro and in vivo biochemical results confirm that RTN3 is prone to forming HMW oligomers and/or aggregates.
Induced formation of both HMW-RTN3 and RIDNs
Next, we investigated why RTN3 is accumulated and HMW-RTN3 is formed within the AD brain. Given that the total levels of RTN3 (monomer plus HMW-RTN3; Figure 2) were abnormally higher in AD brains, one might hypothesize the presence of a reduced turnover of RTN3 within the AD brain. Indeed, we found that treatment of RTN3 expressing cells with proteasomal inhibitor MG-132 induced the formation of HMW-RTN3 (Supplementary Figure 3), suggesting that the reduced turnover rate of RTN3 at least partially occurs through the ubiquitin–proteasome system.
We then examined the factors that could be responsible for the connection between AD, impaired proteasomal function and the formation of HMW-RTN3 and RIDNs. Several pieces of evidence suggest that Aβ deposition may alter proteasomal function (van Leeuwen et al, 1998; Keller et al, 2000; Lopez et al, 2000; Keck et al, 2003; Lindsten et al, 2003), and that fibrillar Aβ42 selectively inhibits the chymotrypsin-like activity of the proteasome by binding to 20S subunit (Gregori et al, 1997). To make a potential connection between this and the formation of HMW-RTN3, we cultured primary neurons from wild-type (wt) mice and treated them with 20 μM of fibrillized Aβ42. Our results demonstrated that fibrillized Aβ42, like the two cell-permeable proteasomal inhibitors MG-132 and lactacystin, significantly enhanced formation of HMW-RTN3 in cultured neurons (Figure 3A). On the contrary, camptothecin (Figure 3A) and staurosporin (data not shown) did not result in the accumulation of HMW-RTN3. Instead, the apoptosis inducers resulted in large amount of cell death in culture and an unusual proteolytic cleavage of RTN3 (Figure 3A). Thus, our data suggest that within the AD brain, enriched fibrillar Aβ, but not nanomolar ranges of Aβ (data not shown), may cause the proteasomal inhibition that subsequently induces an accumulation of RTN3 and the formation of HMW-RTN3.
Figure 3.

Induced formation of HMW-RTN3. (A) Cultured primary cortical and hippocampal neurons from wt mouse embryos were treated with the indicated reagents for 24 h. Neuronal lysates were examined by Western blot analysis with antibody R458. (B, C) Mouse embryonic primary neurons were cultured on coverslips and then treated with preaggregated Aβ42 for 48 h (C) or left untreated (B). Neurons were then fixed and immunostained with antibodies against RTN3 (R458, green), β-III-tubulin (Tuj1, red) or 6E10 (red) to show aggregated Aβ42 added to the medium. The yellow arrowheads represent RTN3 staining in the growth cone. The white arrowheads indicate clumpy RI. Scale bar in (B, C), 30 μm.
Consistent with the above biochemical evidence, cultured primary mouse neurons also showed clumpy morphology of the RI when 20 μM of preaggregated Aβ42 was added to the culture (denoted in white arrowheads; Figure 3C). Mock-treated neurons, on the other hand, exhibited normal RTN3 staining in the neuronal perikarya, axons and the growth cones (denoted with yellow arrowhead in Figure 3B). Thus, in vitro, fibrillar Aβ induces the formation of both HMW-RTN3 and RIDNs, thereby partially explaining the formation of RIDNs in APP transgenic mice.
Generation of Tg-RTN3 mice
If the accumulation of RTN3 leads to the formation of HMW-RTN3, which is correlated to the formation of RIDNs, we hypothesized that mice overexpressing RTN3 will produce RIDNs. To test this, the C-terminally myc-tagged human RTN3 (hRTN3) cDNA was inserted into the coding region of a Mo-PrP vector that utilizes the mouse prion protein (PrP) promoter (Thinakaran et al, 1996; Borchelt et al, 1997) to drive the expression of the transgene in mouse neurons (Figure 4A).
Figure 4.

Generation and characterization of hRTN3 transgenic mice. (A) Schematic representation of the transgene construct of hRTN3 cDNA under the control of the mouse prion protein gene promoter. The myc-tagged hRTN3 cDNA was inserted between exon 2 and exon 3 of the mouse prion protein genomic DNA as illustrated. (B) Expression of the transgene in the three lines (L1–L3) of Tg-RTN3 mice was compared with non-transgenic control. Protein extracts were prepared from frontal cortex, hippocampus and cerebellum, and equal amounts of proteins were analyzed by Western blotting with polyclonal antibody R458. (C) Western analysis of the RTN3 protein levels in L3 Tg-RTN3 mice at different ages compared with non-transgenic mice (wt). The myc antibody only recognizes the transgene.
After pronuclear microinjection of the linearized hRTN3 transgene, three independent founder lines of mice that expressed different levels of hRTN3 were recovered (Figure 4B). By the Western analysis of protein extracts using antibody R458, we noticed that RTN3 levels in the cerebral cortex were slightly higher than those in the hippocampus and the lowest in the cerebellum (Figure 4B). Line 3 Tg-RTN3 mice expressed the highest levels of the transgene in the hippocampus and the cerebrum, with ∼3- to 5-fold more total RTN3 than wt littermates. In contrast, line 1 and 2 mice expressed about 1- to 2-fold more RTN3 than their wt littermates. Overall, the levels of RTN3 correlated with the copy numbers of the transgene (data not shown). Expression of RTN3 appeared stable between 4 and 10 months of age (Figure 4C).
Overexpression of RTN3 results in abnormal neuritic swelling in hippocampal CA1
To detect potential formation of RIDNs in Tg-RTN3 mouse brains, we performed a confocal examination of frozen brain sections using R454, R458 and myc antibodies. In the hippocampi of non-transgenic mice, antibody R458 primarily labeled pyramidal cells (Figure 5A). Remarkably, all three lines of Tg-RTN3 mice developed dispersed globular-, bulb- or ring-shaped RIDNs throughout the CA1 regions (Figure 5E). Since Tg-RTN3 L3 mice express highest levels of RTN3 (about 3- to 5-fold more than non-Tg mice), RIDNs in L3 mice had highest density. Staining with RTN3 N-terminal R454 or myc antibody revealed a pattern of RIDNs identical to that shown by antibody R458 (Supplementary Figure 4A–C), confirming that the occurrence of RIDNs in Tg-RTN3 is due to overexpression of the RTN3 transgene. The RIDNs were detectable at 4 months of age (Supplementary Figure 4D), and developed more densely in the CA1 region, and also spread into entire hippocampal regions at 9 months of age (Supplementary Figure 4E). In the cortical regions, RIDNs were largely absent in early age and were evident at the age of 12 to 14 months (Figure 5E). The presence of beads-on-a-string morphology (Figure 5E) confirmed the occurrence of axonal or dendritic swellings that are typical features to define dystrophic neurites.
Figure 5.
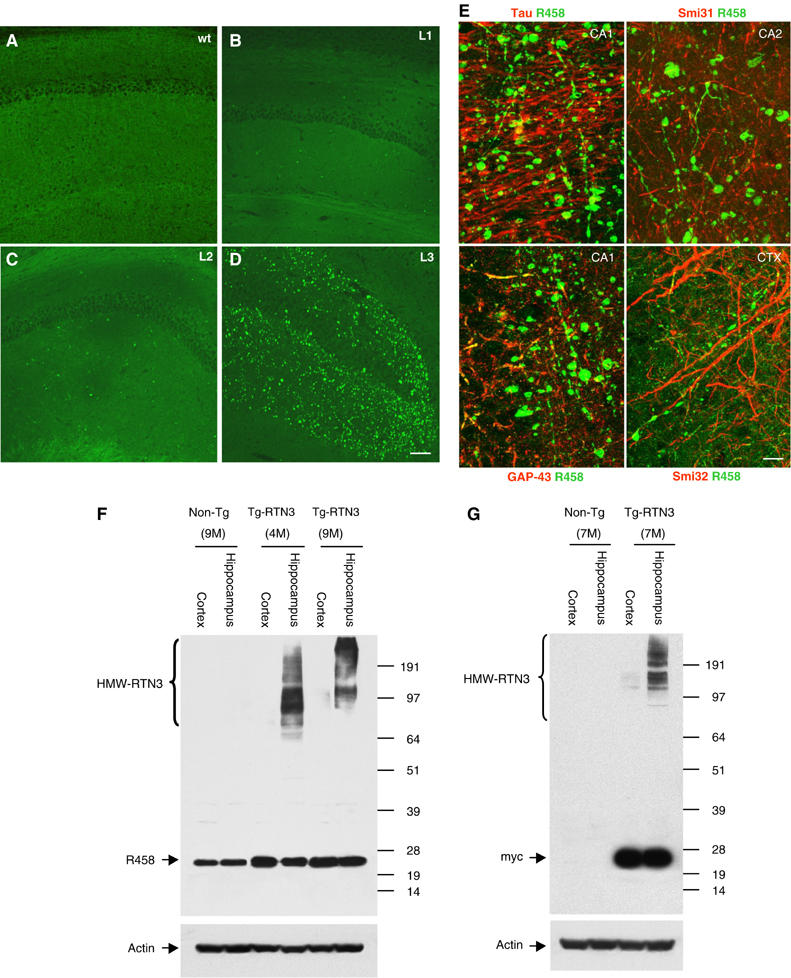
RTN3-containing neuritic swelling correlated with the formation HMW-RTN3 in the hippocampus of hRTN3 transgenic mice. Immunofluorescent staining of RTN3 (green) in the hippocampal CA1 region of a non-transgenic mouse (A), line 1 Tg-RTN3 mice (B), line 2 Tg-RTN3 mice (C) and line 3 mice at 12 months (D). Normal neuronal localization of RTN3 was found in pyramidal cells and neurons in the exhibited region. RIDNs were found in all three lines of Tg-RTN3 mice, with the highest density in Tg-RTN3 line 3 mice. (E) Enlarged view exhibits beads-on-a-string type neuritic swellings present in the hippocampal and cortical regions. The brain sections from 14-month-old Tg-RTN3 (L3) mice were double labeled with antibody R458 for RTN3 (green) and tau, Smi31, GAP-43 or Smi32 antibody (red). Tau and Smi31 antibodies label axonal structures; Smi32 labels dendrites and GAP-43 mainly labels growth cones where RTN3 also resides. Only a few immunoreactivity of the marker antibody was overlapped with RIDNs in Tg-RTN3 samples. The bulb- or ring-shaped RIDNs in the Tg-RTN3 mice resembled the RIDNs present in AD brains. Scale bar in (A–D), 125 μm; (E), 15 μm. (F, G) HMW-RTN3 was significantly increased in the hippocampi of Tg-RTN3 mice, but evidently less in the cortical region where RIDNs were fewer. Mice at the age of 4 months (4M), 7 months (7M) and 9 months (9M) were selected for the Western blot. Antibody R458 recognizes both wt RTN3 and myc-tagged RTN3 transgene, whereas the myc antibody only reacts with myc-tagged transgene.
Remarkably similar to the observations of RIDNs in AD brains, the RIDNs in Tg-RTN3 mice contained only a few punctated overlaps with markers for tau, GAP-43 and neurofilaments (Figure 5E). GAP-43 is a marker for growth cones where RTN3 is also localized (Figure 3B), but GAP-43 was mostly not in the RIDNs. The formation of RIDNs in Tg-RTN3 mice cannot be simply attributed to the excessive overexpression of this transgene because merely 1- to 2-fold more total RTN3 than wt littermates was expressed in two other lines of Tg-RTN3 mice in which the RIDNs also developed (Figure 5B and C). In all, our data suggest that the formation of RIDNs in the hippocampus is dependent on both the expression levels of the RTN3 and the aging process.
Correlatively, we also found that HMW-RTN3 was present in lysates prepared from the hippocampus but significantly less from the frontal cortex of Tg-RTN3 mice (Figure 5F and G). The samples from three different age groups of mice showed consistent correlation: the higher the density of RIDNs, the higher the levels of HMW-RTN3. Together, our results suggest that overexpression of RTN3 alone, even by only one-fold, is sufficient to cause the formation of HMW-RTN3 and RIDNs within brains of Tg-RTN3 mice, and the formation of RIDNs correlates with the levels of HMW-RTN3.
Ultrastructure of RIDNs
Since the formation of RTN3 aggregates is coincident in time and space with the formation of dystrophic neurites, we speculate that RIDNs in both Tg-RTN3 mouse and AD patients' brains might contain RTN3 oligomers or aggregates. electron microscopy (EM) analysis of optimally fixed Tg-RTN3 mouse brains revealed the presence of protofibril-like accumulations in various types of neuronal elements (Figures 6A–D), in agreement with our speculation. The filamentous structures within the accumulations were about 20 nm thick and unbranched (Figure 6A, inset). Protofibril-like accumulations were predominantly found within large membrane-enclosed structures whose sizes ranged 3–5 μm, similar to the results obtained with a light microscope. Surrounding these membrane-enclosed profiles were numerous neuronal processes and small caliber axons. Axon terminals were sometimes seen adjacent to these structures, but they were rarely seen forming synapses onto the structures (Figure 6B). While some of these structures still contained subcellular organelles, many were completely engorged with the protofibril-like accumulations (Figure 6A–C). Vesicles that resembled synaptic vesicles were often seen peripherally within the structures (Figure 6B and C). Also, fragmented membrane stacks that morphologically resembled myelin sheets were frequently found buried in the protofibril-like accumulations. Protofibril-like accumulations could also be found within myelinated axons and axon termini where synapses and synaptic vesicles were clearly visible.
Figure 6.
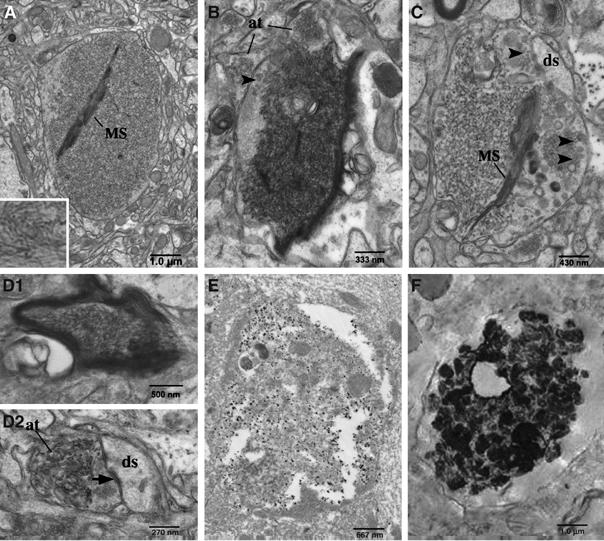
Electron micrographs of protofibril-like accumulations in RIDNs. Electron micrographs of RIDNs in hippocampi from Tg-RTN3 mice. (A–C) Large membrane-enclosed structures that filled with protofibril-like accumulations are obvious. Arrowheads specify synaptic vesicles. MS, membrane stacks morphologically resembled myelin sheets. The abbreviation ‘at' stands for axonal terminus and ‘ds' for dendritic synapses. (D1) Protofibril-like accumulations are found in a myelinated axon and (D2) protofibril-like accumulations are found in an axonal terminus that had a synaptic contact with a dendritic spine. (E) Mild fixative samples from Tg-RTN3 (L3) mouse hippocampus were labeled by the primary antibody R458 and gold-conjugated secondary antibody. (F) The pre-embedded human AD postmortem samples are examined by EM. The strong signals in contrast to the background were produced by immunolabeling RTN3 with antibody R458.
To confirm whether the protofibril-like accumulations seen in these neuronal elements actually contained RTN3, we performed immuno-EM on hippocampal samples from Tg-RTN3 mice using the specific antibody R458. As revealed in Figure 5E, gold particles were clearly concentrated within membrane-enclosed structures similar to those seen in Figure 6A–C even though the tissue ultrastructure quality was less than optimal due to the use of a milder fixture, indicating that the protofibril-like accumulations contained RTN3. Strikingly, postmortem AD samples, examined by a pre-embedding immuno-EM approach according to a published procedure (Arroyo-Jim nez et al, 1999), also exhibited compacted and densely immunoreactive signals either within a swelling axon (Figure 6F) or in close proximity to Aβ fibrils (data not shown). Clumpy and winding protofibril-like structures were clearly visible (Figure 6F); these types of structures were not detected in the control samples or if the RTN3 antibody was omitted from these samples (data not shown). Hence, our biochemical and ultrastructural characterizations demonstrate that RIDNs contain RTN3 oligomers or RTN3 aggregates.
Impairment of spatial memory in Tg-RTN3 mice
The presence of dystrophic neurites is part of AD pathology, but whether their presence affects cognitive function has never been fully elucidated. The occurrence of RIDNs in the hippocampi of Tg-RTN3 mice offers a great opportunity to examine whether RIDNs affect cognitive function in animals. To this end, we assessed spatial learning and memory performance of Tg-RTN3 mice and their wt littermates. Performance of rodents in a Barnes maze task has been shown to depend on a functional hippocampus (Barnes et al, 1990; Pompl et al, 1999; Nguyen et al, 2000), and mice with defects in the hippocampal CA1 area perform poorly on the Barnes maze in correlation with their reduced LTP (Bach et al, 1995; Seeger et al, 2004). We examined the performance of Tg-RTN3 mice on a 40-hole Barnes circular maze for 7 consecutive days following an initial 2-day training period. Wild-type mice steadily learned to navigate to a specified location based on available cues (Figure 7A). However, Tg-RTN3 mice took a considerably longer time to enter the specified escape box (P<0.05, unpaired t-test). We also noticed that learning and memory were so impaired in several of the Tg-RTN3 mice that they could never find the specified box within the maximum given time (300 s) on any day during the entire test period, but none of the control littermates exhibited this pattern.
Figure 7.

Impaired spatial learning and memory of Tg-RTN3 mice on Barnes maze trial. (A) Tg-RTN3 mice (n=12, ∼300 days old) and wt mice (n=9) were tested on a Barnes circular maze for 7 days after a 2-day training period. Escape latency (mean and s.e.m.) measured the time elapsed from the raising of the start chamber to the entry of the mouse into the escape box (P<0.05, unpaired t-test). (B) The Rotarod test is used to assess functional changes in the basal ganglia and cerebellum that control sensor motor coordination. The time during which the animals remained on the rotating rod was recorded until they fell. (P=0.087, t-test).
The presence of RIDNs in the CA1 region of Tg-RTN3 mice apparently do not affect other brain functions such as sensor motor coordination, which is governed by the basal ganglia and the cerebellum. In our rotarod test, we found that Tg-RTN3 mice did not differ from non-transgenic littermates in term of their dwelling time on the rod (Figure 7B; P=0.087, t-test). Thus, occurrence of RIDNs in the hippocampi of Tg-RTN3 mice can cause the impaired hippocampal function such as spatial reference learning and memory that is commonly seen in AD patients.
Reduced LTP in Tg-RTN3 mice
To further determine whether the impaired spatial memory in Tg-RTN3 is due to the changes of synaptic plasticity in hippocampus, we performed electrophysiological experiments by recording LTP on hippocampal slices prepared from non-transgenic and Tg-RTN3 mice. The MED64 system (Panasonic) was used to deliver conditioning stimulation to a hippocampal slice, and to observe the amplitude of filed excitatory postsynaptic potentials (fEPSPs) evoked by stimulating the Schaffer collateral pathway at a low frequency and recorded at stratum radiatum of CA1 region according to the procedure described (Shimono et al, 2002; Baba et al, 2003; Itoh et al, 2005). After reaching a stable baseline, theta burst stimulation was delivered to Schaffer collateral/commissural fibers to induce LTP. We found that non-transgenic control mice elicited a typical LTP lasting greater than 30 min (Figure 8; 9- to 10-month-old mice, n=4). However, the Tg-RTN3 mouse showed some STP but returned to near preconditioned baseline levels in about 10 min. The mean fEPSP slope of Tg-RTN3 mice was significantly lower than that of non-transgenic mice (114.90±8.98 versus 144.73±3.24%; P<0.01, Student's t-test). These results indicate that the Tg-RTN3 mice exhibit a significant attenuation in LTP magnitude compared with non-transgenic control mice. The reduced LTP response indicates impairment in synaptic plasticity and explains the impaired spatial and learning memory seen in Tg-RTN3 mice.
Figure 8.

Attenuated LTP in Tg-RTN3 mice. Freshly prepared hippocampal slice from Tg-RTN3 mice (closed) and wt mice (open; 9- to 10-month-old) were used for LTP assay. Multiple slices (7–8 slices) from four mice of each group were recorded. Top panels show typical field potentials recorded at times 0 (pre) and 30 (post) from Tg-RTN3 and non-transgenic control mouse slices. The baseline responses and post conditioning responses are superimposed in general. The fEPSP slopes are expressed as a percentage of changes from baseline. LTP induced by theta burst stimulation (TBS, 10 × 4 pulse at 100 Hz, 0.2 ms duration, 200 ms interburst interval) lasted for at least 30 min in wt animals, but decreased significantly in RTN3 transgenic animals (144.73±3.24 versus 114.90±8.98%; P<0.01, Student's t-test). Scale bar, 0.2 mV, 5 ms.
Discussion
The presence of dystrophic neurites has long been identified as one of the distinguishing pathological features in the brains of patients with AD. However, the molecular nature of dystrophic neurites was not fully elucidated. The findings that many proteins and abnormal vesicles are accumulated in the dystrophic neurites (Teter and Ashford, 2002; Yu et al, 2005) implicate a complicated process in the formation of dystrophic neurites. In this report, we demonstrate that dystrophic neurites in brains of AD patients contain protofibril-like accumulations that are enriched with RTN3 immunoreactivity. The formation of HMW-RTN3 and RTN3 aggregates, which occur in brains of both human AD patients and animal models, accounts for the accumulations of RTN3-containing protofibrils in dystrophic neurites. It appears that a modest increase of RTN3, that is, by only 1- to 2-fold (Figures 4B, 5B and C), is sufficient to cause the formation of dystrophic neurites in the brains of an animal model. Therefore, RTN3 is not just simply another protein trapped within the dystrophic neurites, but participates in the formation of dystrophic neurites.
It should be noted that this is the first animal model that produces dystrophic neurites without association with either amyloid deposition or PHF when a modest level of RTN3 protein is expressed in mice. Many transgenic mice including those expressing wt APP, an abundant membrane protein found in neurons, do not simply develop dystrophic neurites in their brains. For example, the wt APP transgenic mice (line 163) that expresses 10-fold more APP in the transgenic mice than their non-transgenic littermates have not been reported to develop dystrophic neurites (Mucke et al, 2000). Similarly, transgenic mice expressing all of three neurofilament subunits do not result in the formation of dystrophic neurites in spite of the fact that these mice produce the pathology of human motor neuron disease or neurofilamentous accumulation (Xu et al, 1993; Vickers et al, 1994; Couillard-Despres et al, 1998). Mice overexpressing human four-repeat tau, another protein found in dystrophic neurites, develop central and peripheral axonopathy, but these mice do not simply develop dystrophic neurites (Gotz, 2001). Finally, transgenic mice expressing a constitutive active mutant form of GAP-43, a protein often used to mark dystrophic neurites in AD models, do not develop dystrophic neuritis, although these mice exhibit enhancements in both short-term and long-term memory (Hulo et al, 2002). Hence, the results from the above animal models have demonstrated that most proteins found in the dystrophic neurites, unlike RTN3, will not cause the formation of dystrophic neurites when extensively overexpressed in mice. Because of this fact, RTN3 may possess an intrinsic capability in spontaneously forming RIDNs in the transgenic mice.
The RIDNs in Tg-RTN3 mice share the same pathological features as that in AD brains according to the following evidences: (1) RIDNs in these two cases exhibit the same morphology based on light microscopic results (comparing Figure 1 to 5E); (2) RIDNs in these two cases contain RTN3-labeled-filamentous aggregates in light of ultrastructural results (Figure 6); (3) Western analysis indicates a good correlation of the RIDNs formation to the levels of HMW-RTN3 (comparing Figure 2 to 5F and G) and (4) the data reported here provide a direct mechanistic link between Aβ aggregation and the RIDNs formation because large amounts of Aβ aggregates promote accumulation of RTN3 (Figure 3). Altogether, our studies demonstrate for the first time the presence of biochemical alterations: dystrophic neurites or RIDNs contain RTN3 protein oligomers or aggregates. Thus, the Tg-RTN3 mouse model presented here is an incredibly useful experimental tool in deciphering the pathological role of dystrophic neurites in AD pathology. We have shown that the presence of large amount of RIDNs causes impairments in spatial learning and memory (Figure 7), and this defect is consistent with impaired LTP.
How RTN3 forms aggregates remains to be experimentally determined. However, formation of dimers or higher-molecular weight multimers of RTN proteins has been previously described (Senden et al, 1994; Dodd et al, 2005; He et al, 2006). In this study, we have demonstrated that increased levels of RTN3 are sufficient to facilitate the formation of HMW-RTN3 (Figures 2C and D, 5F and G). We speculate that RTN3 is a structural membrane protein of a vesicle that can be transported via kinesin-1-mediated machinery. When the levels of RTN3 are high, the quantity of RTN3-containing vesicles is increased, and these vesicles can be more readily transported to axonal terminus. This may result in imbalanced anterograde and retrograde transports; the subsequent accumulation of RTN3 in the neuritic regions may increase the opportunity for RTN3 to form HMW-RTN3 that is deposited in the neuritic regions. Although this hypothesis may explain axonal swelling seen in RIDNs, additional experiments are required to fully address the above hypothesis.
One surprising finding in our Tg-RTN3 mice is that despite the fact that RTN3 is overexpressed in both the hippocampus and the cortex, the RIDNs are largely or firstly observed within the CA1 of the hippocampus. One possibility for this regional disparity is that RTN3 may be more readily transported to the hippocampal axons than other brain regions. Our Western analysis results shown in Figure 5F and G indicate that more HMW-RTN3 is formed in the hippocampus than in the cortical regions. Therefore, the formation of HMW-RTN3 is an important indicative parameter for the formation of RIDNs.
We have previously demonstrated that RTN3 interacts with BACE1, and this increased interaction can inhibit the processing of APP to Aβ peptides (He et al, 2004). While its in vivo effect on amyloid deposition will be discussed in details elsewhere (Q Shi and R Yan, unpublished results), the present study demonstrates an alternative role that RTN3 plays in AD pathogenesis. All mice expressing the RTN3 transgene develop spontaneous RIDNs within the hippocampal and other brain regions, and RIDNs are indeed present in AD brains but not ND control brains. More importantly, our study, using Tg-RTN3 mice for the learning and memory tests demonstrates that the occurrence of dystrophic neurites contributes to cognitive deficits in AD brains. Hence, together with a recent study that implicates RTN4A (Nogo-A) and Nogo-receptor in AD pathogenesis (Park et al, 2006), accumulating evidence suggests that the RTN family of proteins plays important roles in the pathogenesis of AD. Suppression of RTN3 aggregation may not only potentially delays neuronal dysfunction but also inhibits BACE1 activity.
Materials and methods
Brain samples and reagents
Postmortem brain cortical and hippocampal samples were obtained from the following two sources: Emory University and the Cleveland Clinic Foundation postmortem brain collections. Antibodies against β-amyloid peptide (6E10), calnexin, myc tag and ubiquitin were purchased from Sigma (St Louis, MO); β-tubulin and actin from Santa Cruz Biotechnology (Santa Cruz, CA); AT8 for phosphorylated tau from Innogenetics-Biotechnology for Health (Gent, Belgium); Tuj1 from Covance; GFAP and MAC Class II from DakoCytomation (Glostrup, Denmark) and Smi31 and Smi32 from Sternberger Monoclonal Inc. (Lutherville, MD). Alexa-488- and Alexa-568-labeled secondary antibodies were purchased from Molecular Probes (Eugene, OR). Antibodies R454 and R458 recognize the N-terminus and C-terminus of RTN3, respectively, whereas R461 recognizes the N-terminus of Nogo-A/B isoforms (He et al, 2004). The ubiquitin–proteasome inhibitor MG-132 was purchased from Calbiochem (San Diego, CA) and clasto-Lactacystin β-lactone from Biomol Research Laboratory (Plymouth Meeting, PA). The Aβ42 peptide was purchased from Biosources (Camarillo, CA). B6C3-Tg-APPsw/PSEN1DE9 mice were purchased from Jackson Laboratory (stock #004462). HR3M cells are HEK-293-derived cells that stably express myc-tagged RTN3 (He et al, 2004).
Immunohistochemistry and immunofluorescent confocal microscopy
Immunohistochemical and confocal experiments were performed according to standard methods as described previously (Yan et al, 2001; He et al, 2004). Frozen brain tissues from AD patients and mice were cut on a freezing microtome (Microm GmbH, Walldorf, Germany). The fixed sections were treated with 3% Sudan Black B for 10 min to remove autofluorescence. Amyloid deposition was detected with monoclonal antibody 6E10 (Sigma, 1:1000); RI was detected with polyclonal R458 (1:1000) or R454 (1:1000); β-III-tubulin with monoclonal Tuj1 (1:1000, Covance) or according to the product data sheets. Lipofucsin autofluorescence is common in human brain sections and produced robust autofluorescence in all confocal channels. We compensated by imaging it alone using a laser/filter combination that was not utilized by immunostaining. In these experiments, tissue was illuminated with the 633 nm laser line and autofluorescence was detected at 650 nm and a higher wavelength. The resulting image was saved as the blue channel in RGB image composites.
The generation of transgenic hRTN3 mice
The transgene of hRTN3was generated by inserting cDNA encoding hRTN3between exon 2 and exon 3 of mouse prion protein gene DNA at two unique XhoI sites in the Mo-Prp plasmid vector (Borchelt et al, 1997). The purified DNA transgene was microinjected into the male pronuclei of fertilized mouse oocytes (FVB/N × FVB/N). The oocytes were then implanted into the oviduct of pseudo-pregnant mothers. The following pair of primers 5′-CGCTGCCCTTATTTTCATGT-3′ and 5′-CCAGGTAGGCTTTGAATGGA-3′, for the transgene, was used for PCR-based genotyping. The mouse RTN3-specific primers 5′-CACAGGTAGAAATGGCCAAGA-3′ and 5′-CAGCTTGAATGACAGACTTATAGACT-3′ were included in the PCR to identify mouse sequence. Three different transgenic mice were identified and used to establish three transgenic mouse lines by crossing with C57BL/6J mice. In order to reduce the possible effects of genetic background on amyloid deposition, as well as other phenotypes, the founder mice were first backcrossed with C57BL/6 mice for three generations to ensure a relatively pure genetic background (∼87.5% identical to C57BL/6) before any experiment.
Western blot analysis of the brain samples
Human samples (18 AD postmortem brains and 10 ND control brains) or adult mice brains (two APP/PSEN1 bigenic mice and two age-matched wt mice) were used for Western blots and immunohistochemistry. For Western blots, the fresh samples were homogenized on ice in a solution containing 50 mM Tris–HCl (pH 7.5), 150 mM NaCl, 0.5% NP-40 and 1 × protease inhibitor cocktails (Roche Biosciences, Palo Alto, CA). The homogenates were rotated on a rotator for 30 min at 4°C. After removal of tissue debris by centrifugation, the protein concentrations of the supernatants were determined with the Bradford protein assay reagent (Bio-Rad Laboratories). Equal volumes of the supernatant containing 50 μg of protein were then separated on a 4–12% bis–tris NuPage gel (Invitrogen, Carlsbad, CA), followed by a Western blot with antibodies specified in the text.
Treatment of cultured neurons with Aβ42
Neuronal cultures were derived from day 15–16 mouse embryos according to the procedures as described (Qahwash et al, 2003). Briefly, the cerebral cortex and hippocampus were dissected from embryonic brains and incubated for 15 min in trypsin/EDTA (0.05%/0.02% in PBS) at 37°C. The samples were added to dissociation medium (DMEM with 10% FBS, 10 mM HEPES, 44 mM glucose, 100 U penicillin+streptomycin per milliliter, 2 mM L-glutamine, 2 μM insulin), mechanically dissociated by repeated passage through a fire-polished Pasteur pipette, followed by filtration through 40 μm nylon mesh, centrifugation (800 r.p.m. for 3 min at 25°C) and redissociation in starter medium (neurobasal medium with 2%B27, 0.5 mM L-glutamine, 25 μM glutamate, 0.2 mM uridine, 0.1 mM deoxyuridine, 100 U penicillin+streptomycin per milliliter). Dissociated cells were plated onto poly-L-lysine-coated glass coverslips at a density of 2.0 × 10⁴ cells/cm2 for immunofluorescence and onto coated six-well plates at 1.5 × 10⁵ cells/cm2 for Western blots. Cells were incubated in the starter medium at 37°C with 5% CO2 for 3 days and then transferred to the cultivating medium (starter medium without glutamate) by replacing half of the medium twice a week. A stock of 1 mM Aβ42 was prepared with sterile water and incubated at 37°C for 48 h before treatment (Qahwash et al, 2003). Primary neurons cultured on coverslips for 10 days were treated with 20 μM of Aβ42 for 48 h. The treated neurons were then rinsed with PBS, fixed with 4% paraformaldehyde in PBS for 20 min, permeabilized with 0.2% Triton-X 100 in PBS for 10 min and immunostained with the specified antibodies. For the Western blot, neurons were cultured in six-well plates and treated with the indicated reagents for 24 h. After treatment, the lysates were prepared for Western blot analysis.
Rotarod test
Before the test, mice were acclimated to the rod for 3 min while the rod remained stationary. To start the test, each mouse was placed on the rod and then the rod was rotated. The speed of rotation was gradually increased. The time during which the animals remained on the rotating rod before falling was recorded.
Barnes maze test
Spatial reference learning and memory were tested on a Barnes maze (Columbus Instruments, OH) according to the procedures described previously (Barnes et al, 1990; Nguyen et al, 2000). The Barnes maze was a white circular platform (122 cm in diameter) and was installed 140 cm above the floor in a large square enclosure (2.4 m high and 1.9 m wide). The platform contained 40 holes equally spaced around its perimeter. An escape box: an open light beige plastic box (12 × 8.5 × 5 cm) with fresh bedding was used as the escape box. It was randomly attached to one of the 40 holes for each mouse and each trial, although the spatial orientation of the escape box to the enclosure was always the same. Four simple colored individually mounted on the enclosure walls figures were served as visual cues. Eight halogen floor lamps (3000 watt in total) were mounted 90 cm above the platform. The Barnes maze experiment included a training and a trial phase. During the 2-day training period, the mice were placed in the center of the Barnes maze and gently guided to the hole where the escape box was located. They were allowed to enter the hole and habituate for 30 s. During the trial period, the spatial learning memory of each mouse was examined on the Barnes maze once a day for the indicated days. In each trial, the mouse was placed in a black start chamber in the center of the maze. After a 10-s delay, the halogen lights were turned on and the start chamber was immediately raised. Mice were free to find the escape box. After each mouse entered the escape box, it was allowed to remain in the box for 1 min. The escape latency was time elapsed from the raising of the start chamber to the entry of the mouse into the box (specifically, at the moment the animal had its four paws on the bottom of the box). After each trial, the surface of the maze was cleaned with cooking vinegar (1:30 dilution in water) and the bedding in the escape box was replaced to eliminate any possible olfactory cues from preceding animals. All trials were monitored through a video monitor and recorded on videodisks via a CCD camera hanging over the maze.
LTP recording
The recoding of LTP on a hippocampal slice was performed according the previously described procedures (Shimono et al, 2002; Baba et al, 2003; Itoh et al, 2005). Briefly, horizontal hippocampal slices (350 μm thickness) were prepared from the brains of 9-month-old Tg-RTN3 and non-transgenic control mice in ice-cold, 95% O2/5% CO2 oxygenated artificial cerebrospinal fluid (ACSF) consisting of the following ingredients: 124 mM of NaCl, 3 mM of KCl, 1.24 mM of KH2PO4, 1.5 mM of MgSO4, 2.0 mM of CaCl2, 26 mM of NaHCO3 and 10 mM of glucose. The prepared slices were incubated at room temperature for at least 1 h before recording. The slices were then placed at the center of a MED-P210A probe (Panasonic International Inc., USA) and perfused with in a 95% O2/5% CO2-saturated ACSF. The device has an array of 64 planar microelectrodes arranged in an 8 × 8 pattern 64 planar electrodes across a hippocampal slice. Each electrode is 20 × 20 μm, with an interelectrode distance of 100 μm. Two electrodes were selected to provide alternating stimulation from Stratum Radiatum to collect typical responses in CA1. Field-excited potentials caused by stimulation were recorded at a 20 kHz sampling rate from CA1 stratum radiatum, and confirmed to be fEPSPs by paired-pulse facilitation. Control fEPSPs were recorded for at least 15 min before the conditioning stimulation. After stable baseline was established, LTP was induced by theta burst conditioning stimulation (TBS), a 10-burst train of four-pulses (100 Hz) with 200 ms intertrain intervals. Stimulus intensity was set to produce fEPSP with a half-maximal slope (15–50 μA), and synaptic strength was evaluated by measuring changes in the fEPSP slopes relative to that in baseline. The pairwise statistics was calculated by Student's test.
Supplementary Material
Supplementary Figure Legends
Supplementary Figures and Tables
Acknowledgments
We thank Dr Bruce Trapp and Dr Bruce Lamb for their critical reading and editing of this manuscript, as well as for their constructive comments; Drs Grahame Kidd and Ansi Chang for technical assistance in immunohistochemistry and confocal microscopy; James Lah (Emory University) for discussions; David Borchelt for the Mo-Prp vector; Ted Abel (University of Pennsylvania) for discussions on behavioral tests; Jonathan Smith for the APP transgenic mice; Ping Huang for the assistance in sciatic nerve ligation and Alison Szabo and Caitlin Hicks for help during the studies. This work was partly supported by NIH grants to RY (AG025493) and AL (AG025688), and an award from Ralph Wilson Foundation to RY, and a young investigator award from NARSAD to QS.
References
- Arroyo-Jim nez MM, Bourgeois JP, Marubio LM, Le Sourd AM, Ottersen OP, Rinvik E, Fairen A, Changeux JP (1999) Ultrastructural localization of the alpha4-subunit of the neuronal acetylcholine nicotinic receptor in the rat substantia nigra. J Neurosci 19: 6475–6487 [DOI] [PMC free article] [PubMed] [Google Scholar]
- Baba A, Yasui T, Fujisawa S, Yamada RX, Yamada MK, Nishiyama N, Matsuki N, Ikegaya Y (2003) Activity-evoked capacitative Ca2+ entry: implications in synaptic plasticity. J Neurosci 23: 7737–7741 [DOI] [PMC free article] [PubMed] [Google Scholar]
- Bach ME, Hawkins RD, Osman M, Kandel ER, Mayford M (1995) Impairment of spatial but not contextual memory in CaMKII mutant mice with a selective loss of hippocampal LTP in the range of the theta frequency. Cell 81: 905–915 [DOI] [PubMed] [Google Scholar]
- Barnes CA, Markowska AL, Ingram DK, Kametani H, Spangler EL, Lemken VJ, Olton DS (1990) Acetyl-1-carnitine. 2: effects on learning and memory performance of aged rats in simple and complex mazes. Neurobiol Aging 11: 499–506 [DOI] [PubMed] [Google Scholar]
- Borchelt DR, Ratovitski T, van Lare J, Lee MK, Gonzales V, Jenkins NA, Copeland NG, Price DL, Sisodia SS (1997) Accelerated amyloid deposition in the brains of transgenic mice coexpressing mutant presenilin 1 and amyloid precursor proteins. Neuron 19: 939–945 [DOI] [PubMed] [Google Scholar]
- Brendza RP, Bacskai BJ, Cirrito JR, Simmons KA, Skoch JM, Klunk WE, Mathis CA, Bales KR, Paul SM, Hyman BT, Holtzman DM (2005) Anti-Abeta antibody treatment promotes the rapid recovery of amyloid-associated neuritic dystrophy in PDAPP transgenic mice. J Clin Invest 115: 428–433 [DOI] [PMC free article] [PubMed] [Google Scholar]
- Couillard-Despres S, Zhu Q, Wong PC, Price DL, Cleveland DW, Julien JP (1998) Protective effect of neurofilament heavy gene overexpression in motor neuron disease induced by mutant superoxide dismutase. Proc Natl Acad Sci USA 95: 9626–9630 [DOI] [PMC free article] [PubMed] [Google Scholar]
- Crain BJ, Hu W, Sze CI, Slunt HH, Koo EH, Price DL, Thinakaran G, Sisodia SS (1996) Expression and distribution of amyloid precursor protein-like protein-2 in Alzheimer's disease and in normal brain. Am J Pathol 149: 1087–1095 [PMC free article] [PubMed] [Google Scholar]
- Dickson DW, Farlo J, Davies P, Crystal H, Fuld P, Yen SH (1988) Alzheimer's disease. A double-labeling immunohistochemical study of senile plaques. Am J Pathol 132: 86–101 [PMC free article] [PubMed] [Google Scholar]
- Dickson TC, King CE, McCormack GH, Vickers JC (1999) Neurochemical diversity of dystrophic neurites in the early and late stages of Alzheimer's disease. Exp Neurol 156: 100–110 [DOI] [PubMed] [Google Scholar]
- Dodd DA, Niederoest B, Bloechlinger S, Dupuis L, Loeffler JP, Schwab ME (2005) Nogo-A, -B, and -C are found on the cell surface and interact together in many different cell types. J Biol Chem 280: 12494–12502 [DOI] [PubMed] [Google Scholar]
- Ferrer I, Marti E, Tortosa A, Blasi J (1998) Dystrophic neurites of senile plaques are defective in proteins involved in exocytosis and neurotransmission. J Neuropathol Exp Neurol 57: 218–225 [DOI] [PubMed] [Google Scholar]
- Gotz J (2001) Tau and transgenic animal models. Brain Res Brain Res Rev 35: 266–286 [DOI] [PubMed] [Google Scholar]
- Gregori L, Hainfeld JF, Simon MN, Goldgaber D (1997) Binding of amyloid beta protein to the 20 S proteasome. J Biol Chem 272: 58–62 [DOI] [PubMed] [Google Scholar]
- He W, Hu X, Shi Q, Zhou X, Lu Y, Fisher C, Yan R (2006) Mapping of interaction domains mediating binding between BACE1 and RTN/Nogo proteins. J Mol Biol 363: 625–634 [DOI] [PubMed] [Google Scholar]
- He W, Lu Y, Qahwash I, Hu XY, Chang A, Yan R (2004) Reticulon family members modulate BACE1 activity and amyloid-beta peptide generation. Nat Med 10: 959–965 [DOI] [PubMed] [Google Scholar]
- Hulo S, Alberi S, Laux T, Muller D, Caroni P (2002) A point mutant of GAP-43 induces enhanced short-term and long-term hippocampal plasticity. Eur J Neurosci 15: 1976–1982 [DOI] [PubMed] [Google Scholar]
- Itoh K, Shimono K, Lemmon V (2005) Dephosphorylation and internalization of cell adhesion molecule L1 induced by theta burst stimulation in rat hippocampus. Mol Cell Neurosci 29: 245–249 [DOI] [PMC free article] [PubMed] [Google Scholar]
- Joachim CL, Morris JH, Selkoe DJ (1989) Diffuse senile plaques occur commonly in the cerebellum in Alzheimer's disease. Am J Pathol 135: 309–319 [PMC free article] [PubMed] [Google Scholar]
- Keck S, Nitsch R, Grune T, Ullrich O (2003) Proteasome inhibition by paired helical filament-tau in brains of patients with Alzheimer's disease. J Neurochem 85: 115–122 [DOI] [PubMed] [Google Scholar]
- Keller JN, Hanni KB, Markesbery WR (2000) Impaired proteasome function in Alzheimer's disease. J Neurochem 75: 436–439 [DOI] [PubMed] [Google Scholar]
- Kowall NW, Kosik KS (1987) Axonal disruption and aberrant localization of tau protein characterize the neuropil pathology of Alzheimer's disease. Ann Neurol 22: 639–643 [DOI] [PubMed] [Google Scholar]
- Lenders MB, Peers MC, Tramu G, Delacourte A, Defossez A, Petit H, Mazzuca M (1989) Dystrophic neuropeptidergic neurites in senile plaques of Alzheimer's disease precede formation of paired helical filaments. Acta Neurol Belg 89: 279–285 [PubMed] [Google Scholar]
- Lindsten K, Menendez-Benito V, Masucci MG, Dantuma NP (2003) A transgenic mouse model of the ubiquitin/proteasome system. Nat Biotechnol 21: 897–902 [DOI] [PubMed] [Google Scholar]
- Lopez SM, Morelli L, Castano EM, Soto EF, Pasquini JM (2000) Defective ubiquitination of cerebral proteins in Alzheimer's disease. J Neurosci Res 62: 302–310 [DOI] [PubMed] [Google Scholar]
- Masliah E, Mallory M, Hansen L, Alford M, DeTeresa R, Terry R (1993) An antibody against phosphorylated neurofilaments identifies a subset of damaged association axons in Alzheimer's disease. Am J Pathol 142: 871–882 [PMC free article] [PubMed] [Google Scholar]
- Masliah E, Mallory M, Hansen L, Alford M, DeTeresa R, Terry R, Baudier J, Saitoh T (1992) Localization of amyloid precursor protein in GAP43-immunoreactive aberrant sprouting neurites in Alzheimer's disease. Brain Res 574: 312–316 [DOI] [PubMed] [Google Scholar]
- Masters CL, Beyreuther K (2006) Alzheimer's centennial legacy: prospects for rational therapeutic intervention targeting the Abeta amyloid pathway. Brain 129: 2823–2839 [DOI] [PubMed] [Google Scholar]
- Morris JC, Price AL (2001) Pathologic correlates of nondemented aging, mild cognitive impairment, and early-stage Alzheimer's disease. J Mol Neurosci 17: 101–118 [DOI] [PubMed] [Google Scholar]
- Mucke L, Masliah E, Yu GQ, Mallory M, Rockenstein EM, Tatsuno G, Hu K, Kholodenko D, Johnson-Wood K, McConlogue L (2000) High-level neuronal expression of abeta 1–42 in wild-type human amyloid protein precursor transgenic mice: synaptotoxicity without plaque formation. J Neurosci 20: 4050–4058 [DOI] [PMC free article] [PubMed] [Google Scholar]
- Murayama KS, Kametani F, Saito S, Kume H, Akiyama H, Araki W (2006) Reticulons RTN3 and RTN4-B/C interact with BACE1 and inhibit its ability to produce amyloid beta-protein. Eur J Neurosci 24: 1237–1244 [DOI] [PubMed] [Google Scholar]
- Nguyen PV, Abel T, Kandel ER, Bourtchouladze R (2000) Strain-dependent differences in LTP and hippocampus-dependent memory in inbred mice. Learn Mem 7: 170–179 [DOI] [PMC free article] [PubMed] [Google Scholar]
- Nicoll JA, Barton E, Boche D, Neal JW, Ferrer I, Thompson P, Vlachouli C, Wilkinson D, Bayer A, Games D, Seubert P, Schenk D, Holmes C (2006) Abeta species removal after abeta42 immunization. J Neuropathol Exp Neurol 65: 1040–1048 [DOI] [PubMed] [Google Scholar]
- Oertle T, Schwab ME (2003) Nogo and its paRTNers. Trends Cell Biol 13: 187–194 [DOI] [PubMed] [Google Scholar]
- Onorato M, Mulvihill P, Connolly J, Galloway P, Whitehouse P, Perry G (1989) Alteration of neuritic cytoarchitecture in Alzheimer disease. Prog Clin Biol Res 317: 781–789 [PubMed] [Google Scholar]
- Park JH, Gimbel DA, GrandPre T, Lee JK, Kim JE, Li W, Lee DH, Strittmatter SM (2006) Alzheimer precursor protein interaction with the Nogo-66 receptor reduces amyloid-beta plaque deposition. J Neurosci 26: 1386–1395 [DOI] [PMC free article] [PubMed] [Google Scholar]
- Perry G, Friedman R, Shaw G, Chau V (1987) Ubiquitin is detected in neurofibrillary tangles and senile plaque neurites of Alzheimer disease brains. Proc Natl Acad Sci USA 84: 3033–3036 [DOI] [PMC free article] [PubMed] [Google Scholar]
- Pompl PN, Mullan MJ, Bjugstad K, Arendash GW (1999) Adaptation of the circular platform spatial memory task for mice: use in detecting cognitive impairment in the APP(SW) transgenic mouse model for Alzheimer's disease. J Neurosci Methods 87: 87–95 [DOI] [PubMed] [Google Scholar]
- Qahwash I, Weiland KL, Lu Y, Sarver RW, Kletzien RF, Yan R (2003) Identification of a mutant amyloid peptide that predominantly forms neurotoxic protofibrillar aggregates. J Biol Chem 278: 23187–23195 [DOI] [PubMed] [Google Scholar]
- Seeger T, Fedorova I, Zheng F, Miyakawa T, Koustova E, Gomeza J, Basile AS, Alzheimer C, Wess J (2004) M2 muscarinic acetylcholine receptor knock-out mice show deficits in behavioral flexibility, working memory, and hippocampal plasticity. J Neurosci 24: 10117–10127 [DOI] [PMC free article] [PubMed] [Google Scholar]
- Senden NH, van de Velde HJ, Broers JL, Timmer ED, Kuijpers HJ, Roebroek AJ, Van de Ven WJ, Ramaekers FC (1994) Subcellular localization and supramolecular organization of neuroendocrine-specific protein B (NSP-B) in small cell lung cancer. Eur J Cell Biol 65: 341–353 [PubMed] [Google Scholar]
- Shimono K, Kubota D, Brucher F, Taketani M, Lynch G (2002) Asymmetrical distribution of the Schaffer projections within the apical dendrites of hippocampal field CA1. Brain Res 950: 279–287 [DOI] [PubMed] [Google Scholar]
- Shoji M, Hirai S, Yamaguchi H, Harigaya Y, Kawarabayashi T (1990) Amyloid beta-protein precursor accumulates in dystrophic neurites of senile plaques in Alzheimer-type dementia. Brain Res 512: 164–168 [DOI] [PubMed] [Google Scholar]
- Tanzi RE, Bertram L (2005) Twenty years of the Alzheimer's disease amyloid hypothesis: a genetic perspective. Cell 120: 545–555 [DOI] [PubMed] [Google Scholar]
- Teter B, Ashford JW (2002) Neuroplasticity in Alzheimer's disease. J Neurosci Res 70: 402–437 [DOI] [PubMed] [Google Scholar]
- Thinakaran G, Borchelt DR, Lee MK, Slunt HH, Spitzer L, Kim G, Ratovitsky T, Davenport F, Nordstedt C, Seeger M, Hardy J, Levey AI, Gandy SE, Jenkins NA, Copeland NG, Price DL, Sisodia SS (1996) Endoproteolysis of presenilin 1 and accumulation of processed derivatives in vivo. Neuron 17: 181–190 [DOI] [PubMed] [Google Scholar]
- van Leeuwen FW, de Kleijn DP, van den Hurk HH, Neubauer A, Sonnemans MA, Sluijs JA, Koycu S, Ramdjielal RD, Salehi A, Martens GJ, Grosveld FG, Peter J, Burbach H, Hol EM (1998) Frameshift mutants of beta amyloid precursor protein and ubiquitin-B in Alzheimer's and Down patients. Science 279: 242–247 [DOI] [PubMed] [Google Scholar]
- Vickers JC, Chin D, Edwards AM, Sampson V, Harper C, Morrison J (1996) Dystrophic neurite formation associated with age-related beta amyloid deposition in the neocortex: clues to the genesis of neurofibrillary pathology. Exp Neurol 141: 1–11 [DOI] [PubMed] [Google Scholar]
- Vickers JC, Morrison JH, Friedrich VL Jr, Elder GA, Perl DP, Katz RN, Lazzarini RA (1994) Age-associated and cell-type-specific neurofibrillary pathology in transgenic mice expressing the human midsized neurofilament subunit. J Neurosci 14: 5603–5612 [DOI] [PMC free article] [PubMed] [Google Scholar]
- Voeltz GK, Prinz WA, Shibata Y, Rist JM, Rapoport TA (2006) A class of membrane proteins shaping the tubular endoplasmic reticulum. Cell 124: 573–586 [DOI] [PubMed] [Google Scholar]
- Xu Z, Cork LC, Griffin JW, Cleveland DW (1993) Increased expression of neurofilament subunit NF-L produces morphological alterations that resemble the pathology of human motor neuron disease. Cell 73: 23–33 [DOI] [PubMed] [Google Scholar]
- Yan R, Bienkowski MJ, Shuck ME, Miao H, Tory MC, Pauley AM, Brashier JR, Stratman NC, Mathews WR, Buhl AE, Carter DB, Tomasselli AG, Parodi LA, Heinrikson RL, Gurney ME (1999) Membrane-anchored aspartyl protease with Alzheimer's disease beta-secretase activity. Nature 402: 533–537 [DOI] [PubMed] [Google Scholar]
- Yan R, Han P, Miao H, Greengard P, Xu H (2001) The transmembrane domain of the Alzheimer's beta-secretase (BACE1) determines its late Golgi localization and access to beta -amyloid precursor protein (APP) substrate. J Biol Chem 276: 36788–36796 [DOI] [PubMed] [Google Scholar]
- Yan R, Shi Q, Hu X, Zhou X (2006) Reticulon proteins: emerging players in neurodegenerative diseases. Cell Mol Life Sci 63: 877–889 [DOI] [PMC free article] [PubMed] [Google Scholar]
- Yu WH, Cuervo AM, Kumar A, Peterhoff CM, Schmidt SD, Lee JH, Mohan PS, Mercken M, Farmery MR, Tjernberg LO, Jiang Y, Duff K, Uchiyama Y, Naslund J, Mathews PM, Cataldo AM, Nixon RA (2005) Macroautophagy—a novel Beta-amyloid peptide-generating pathway activated in Alzheimer's disease. J Cell Biol 171: 87–98 [DOI] [PMC free article] [PubMed] [Google Scholar]
Associated Data
This section collects any data citations, data availability statements, or supplementary materials included in this article.
Supplementary Materials
Supplementary Figure Legends
Supplementary Figures and Tables