

Abstract
A processive molecular motor must coordinate the enzymatic state of its two catalytic domains in order to prevent premature detachment from its track. For myosin V, internal strain produced when both heads of are attached to an actin track prevents completion of the lever arm swing of the lead head and blocks ADP release. However, this mechanism cannot work for myosin VI, since its lever arm positions are reversed. Here, we demonstrate that myosin VI gating is achieved instead by blocking ATP binding to the lead head once it has released its ADP. The structural basis for this unique gating mechanism involves an insert near the nucleotide binding pocket that is found only in class VI myosin. Reverse strain greatly favors binding of ADP to the lead head, which makes it possible for myosin VI to function as a processive transporter as well as an actin-based anchor. While this mechanism is unlike that of any other myosin superfamily member, it bears remarkable similarities to that of another processive motor from a different superfamily—kinesin I.
Keywords: gating, kinetics, motility, processivity, unconventional myosin
Introduction
The term ‘processivity' is generally used to describe molecular motors such as kinesin I and myosin V, that are capable of taking a large number of steps along their respective tracks without dissociating. Both are dimers whose motor domains alternate binding and release from their respective tracks in a hand-over-hand manner (Yildiz et al, 2003, 2004a, 2004b) and they have two kinetic specializations necessary to optimize this. First, the individual motor domains spend the majority of their catalytic cycle strongly bound to their track. Second, they have developed a mechanism of communication between the two heads to further increase the degree of processivity—one mediated via the intramolecular strain generated when both heads are strongly bound to their track. Among processive motors that have been studied so far, this appears to involve ‘stalling' the lead head in a strongly bound state until the rear head can detach from the track and make its forward step (Rosenfeld et al, 2003; Klumpp et al, 2004; Rosenfeld and Sweeney, 2004).
In the case of myosin V, gating is achieved by greatly slowing the release of ADP from the lead head, until the rear head releases from actin (Veigel et al, 2002, 2005; Rosenfeld and Sweeney, 2004; Purcell et al, 2005). However, myosin VI, which is also processive (Rock et al, 2001, 2005; Nishikawa et al, 2002; Okten et al, 2004), cannot use this mechanism. This is because myosin VI moves toward the pointed (−) end of the actin filament (Wells et al, 1999). It accomplishes this by repositioning its lever arm so that it points in the opposite direction of barbed (+)-end-directed myosins. Since this repositioning is not associated with any major reorganization of the motor domain, the intramolecular strain imposed on the heads is likewise in the opposite direction. If the mechanism myosin V uses for processivity (Rosenfeld and Sweeney, 2004; Purcell et al, 2005; Veigel et al, 2005) were applied to myosin VI, it would predict that intramolecular strain would slow ADP release from the rear head. This would abolish processive movement, since the lead head would detach from actin before the rear head. Consequently, myosin VI must have developed another mechanism for it to be processive. In this study, we examine how this mechanism works.
Results
Steady-state actin-activated ATPase of myosin VI
In order to dissect the mechanism of gating of myosin VI, we compared the kinetic properties of a single-headed construct (S1) to that of a dimer (HMM). We generated our HMM dimer by inserting a leucine zipper (Rock et al, 2001, 2005). This construct has the same gated, processive movement as the full-length native dimer, but is more stable (Park et al, 2006). Because the number of steps taken by single molecules of HMM is maximal at ∼30°C (H Park, PR Selvin, unpublished observations), we performed all our measurements at this temperature. Table I summarizes the rate constants that characterize the S1 and HMM mechanochemical cycle.
Table 1.
Summary of rate constants for actoS1 and actin HMM at 30°C
 |
General approach
We start with the framework kinetic scheme that has been described for other myosin motors (Rosenfeld and Taylor, 1984a, 1984b; Rosenfeld et al, 2000): 
where A is actin, M is myosin, T is ATP, D is ADP, and Pi is inorganic phosphate. States that bind actin with high affinity (‘strong binding') are indicated in bold face and those that bind with low affinity (‘weak binding') are indicated in italics. There are two goals for this study. First, we wish to see if scheme I, which was developed from studies of ‘+'-end-directed myosins, works as well for one that is ‘−'-end directed. Second, we also wish to see if differences between the rate constants for a dimeric, processive myosin VI construct and a monomeric, non-processive construct provide us with an insight into how myosin VI uses mechanical strain to be processive.
Our experimental approach relies on the use of fluorescent probes that can monitor the reactions depicted in scheme I. For nucleotide binding and release, we use fluorescent analogues of ATP and ADP—2′ deoxy mant ADP (2′dmD) and 2′ deoxy mant ATP (2′dmT)—which bind to myosin VI with affinities and kinetics similar to those for the unlabeled nucleotides (De La Cruz et al, 2001). For formation of strong actin binding states, we use actin labeled at cysteine 374 with pyrene iodoacetamide (Taylor, 1991). Finally, for phosphate binding, we use a recombinant phosphate binding protein (PBP) labeled with the fluorophore MDCC (Rosenfeld et al, 2003), and measure the fluorescence increase produced by phosphate binding to PBP. By monitoring these fluorescence changes in the stopped flow and fitting to a sum of exponentials (Materials and methods), we can also determine if the fluorescence transitions we observe occur in one or more steps.
The weak-to-strong transition, phosphate release, and ADP release are not affected by strain
The experiments in this section all examine the kinetics of interaction of the myosin VI:ADP:Pi intermediate with actin, and utilize an experimental design illustrated in Supplementary Figure 1A. In each case, myosin VI (top cyan syringe) is mixed first with ATP (middle cyan syringe) and incubated in a delay line (Supplementary Figure 1A, magenta cylinder) to generate myosin VI:ADP:Pi. This intermediate is then mixed with actin +2 mM ADP (bottom cyan syringe) and the contents are driven into a flow cell (red cube) for monitoring of fluorescence intensity. The 2 mM ADP in the actin syringe is needed to prevent rebinding of residual ATP. Adequately performing these experiments requires at least partially satisfying two mutually exclusive conditions—the ATP concentration after the first mix must be high enough to occupy most of the myosin VI catalytic sites but still low enough to prevent it from rebinding to the actomyosin VI complex after the second mix.
We examined this issue by varying the concentration of ATP in the experiment illustrated in Supplementary Figure 1A, and by using the fluorescence of pyrene actin to give us a measure of what fraction of HMM heads are in the HMM:ADP:Pi state. In these experiments, we included a 2 s delay between the first and second mixings, to allow for ATP hydrolysis and formation of the myosin VI:ADP:Pi intermediate. The resulting fluorescence transients are depicted in Supplementary Figure 1B on a logarithmic time base. When the syringe marked ‘ATP' contains only buffer, the resulting transient (blue) consists of a single exponential decrease in fluorescence, with a rate constant of 66.7±2.5 s−1, reflecting binding of rigor heads to the 10 μM final actin concentration in this experiment (Robblee et al, 2004). When this syringe instead contains 400 μM ATP, the resulting fluorescence transient (green) deviates slightly from a single phase (green arrow), due to the presence of a low amplitude, faster phase. Approximately 90% of the signal amplitude fits a single exponential process, defining a rate constant of 9.2±6.6 s−1. We interpret this to mean that ∼90% of HMM heads contain ADP+Pi under these conditions, and the remainder are in rigor. Finally, with 100 μM ATP, the resulting fluorescence transient (red) fits two exponential terms, yielding rate constants of 59.2±4.5 and 10.1±1.6 s−1. The slower phase, representing the content of the HMM:ADP:Pi state, still constitutes the large majority of the transient, at 78% of the total signal amplitude. These results are consistent with the affinities of ATP for HMM reported earlier (De La Cruz et al, 2001). Increasing the delay after the first mix to 15 s has no appreciable effect on these transients (data not shown).
We then measured the kinetics of the weak-to-strong transition as a function of actin concentration by mixing HMM or S1 with 100 μM ATP and after 2 s, with pyrenyl actin +2 mM ADP. Over the range of actin concentrations examined, the fluorescence transients (Supplementary Figure 1B) always consisted of a biphasic process, with the slow phase predominating—constituting >75% of the total signal amplitude. We found that the rate constant of the predominant phase of this process for S1 varied with actin concentration in a manner similar to HMM (Supplementary Figure 1C). Furthermore, the amplitude of this phase per head is essentially the same for both constructs (Supplementary Figure 1C, inset), indicating that both heads are able to strongly attach to actin and do so at the same rate.
We next measured the kinetics of phosphate release by mixing HMM or S1 with 100 μM ATP, delaying 2 s, and then mixing with actin+2 mM ADP. The burst phase of the resulting fluorescence increase represents release of phosphate from the myosin VI:ADP:Pi complex, and fit a single exponential process whose rate constant varied hyperbolically with [ATP], defining maximal rate constants of 178±51 s−1 for S1 and 210±25 s−1 for HMM (Supplementary Figure 2; Table I). The amplitude of the phosphate release burst per head for S1 is close to that for HMM over a range of actin concentrations (Supplementary Figure 2, inset), implying that both heads of the dimer release phosphate simultaneously and at the same rate as the unstrained S1 monomer.
ADP release was monitored by mixing 200 μM 2′dmT with myosin VI in a sequential stopped flow. After an initial delay of 6 s to allow for hydrolysis of the bound mant nucleotide, the resulting myosin VI:ADP:Pi complex was then mixed with actin +2 mM ADP. The resulting fluorescence decrease consists of two phases for both S1 (red) and HMM (blue) (Supplementary Figure 3A). In both cases (Supplementary Figure 3B), the rate constant of the faster phase (solid circles) varies with actin concentration in a manner similar to that for phosphate release (solid triangles). This phase reflects the conformational changes in the catalytic site that accompany phosphate release, as we demonstrated in our earlier study of myosin V (Rosenfeld and Sweeney, 2004). The second phase shows relatively little actin concentration dependence. For S1, the rate constant for this phase averages 5.3±0.9 s−1, whereas for HMM it averages 4.9±0.4 s−1 (Table I).
ATP binding is regulated by strain
Mixing actoS1 or actoHMM with 2′dmT produces a fluorescence increase consisting of two exponential phases followed by a third, low amplitude linear tail (Supplementary Figure 4, red), even in the presence of phalloidin. We determined that the slow, linear phase was due to binding of mant ATP to a small amount of G-actin (Supplementary Figure 4, cyan). As a result, we fit the resulting fluorescence transients to two exponential processes plus a linear phase in order to correct for the G-actin-associated signal change. The amplitudes of the two exponential phases are nearly identical for both S1 and HMM (Supplementary Figure 5). By contrast, mixing HMM or S1 in the absence of actin with 2′dmT produces only a mono-exponential increase in fluorescence (Supplementary Figure 4, inset).
For actoS1, rate constants for the rapid (Figure 1, solid red circles) and slow phases (Figure 1, open red circles) vary linearly with [2′dmT]. Scheme I would have predicted instead that binding of 2′dmT would produce a single phase of fluorescence increase. This discrepancy could be explained by three possibilities. The first is that our 2′dmT preparations are contaminated with its main hydrolysis product—2′dmD. However, our 2′dmT preparations were >95% pure by HPLC. The second is that approximately half of the myosin VI heavy chains are phosphorylated. However, we consistently find that >80% of the heavy chains are phosphorylated (Morris et al, 2003). The third possibility is that scheme I needs to be modified in order to explain how ATP binding dissociates myosin VI from actin: 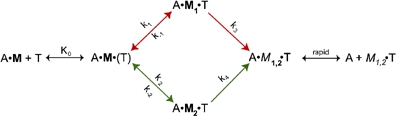 where
where  . Formation of an initial collision complex, A·M·(T), characterized by equilibrium constant Ko, is followed by two conformational changes that can occur independently of each other and that lead to the weak binding A·M1,2·T state. Scheme II thus describes two discrete pathways, marked by the red and green arrows. Applying scheme II to the results in Figure 1 allows us to assign values to several of the rate constants that are summarized in Table I. Note that one of the pathways (red) equilibrates roughly 10 times faster than the other (green). However, our data do not reveal the values of k3 and k4, since the fluorescence signal produced by binding of 2′dmT appears only to sense the initial binding reaction. Determining their values requires experiments utilizing pyrene-labeled actin, which detects the strong-to-weak transition (see below).
Figure 1.

Kinetics of binding of 2′dmT to actin-S1 (red) and actin-HMM (blue) with 2′dmT (ATP). (A) Mixing a complex of 4 μM S1+20 μM actin with 200 μM 2′dmT (red) or 4 μM HMM (concentration of active sites) +20 μM actin with 100 μM 2′dmT (blue) produces fluorescence increases that can be fit to equation 2 (black curves). For actoS1, λ1,2=73.6±1.2 and 6.5±0.5 s−1 and for actoHMM, λ1,2=98.0±2.8 and 2.7±0.1 s−1. Mixing actin with 2′dmT and observing over a much longer time course produces a low amplitude linear increase in fluorescence (cyan). (B) Plots of rate constant versus [2′dmT] for the fast (solid circles) and slow (open circles) phases. Both rate constants vary linearly, with [2′dmT] for S1 (red) while only that for the rapid phase does so for HMM (blue). Inset: on an expanded y-axis, the slower phase for HMM shows no 2′dmT concentration dependence. Conditions: 50 mM KCl, 25 mM HEPES, 2 mM MgCl2, 1 mM DTT, pH 7.50, 30°C. (C) Schematic representation of results. Energy transfer (black arrows) from tryptophan residues in the motor domain (yellow) to 2′dmT (blue and gold spheres) produces a sensitized fluorescence emission (blue jagged lines), which is monitored in the experiment.
We next examined the effect of strain on the red and green pathways by mixing actoHMM with 2′dmT in the stopped flow and comparing our results with those for actoS1. The resulting fluorescence increase for HMM also consists of two phases (Figure 1A, blue) of similar amplitudes (data not shown). The rate constant of the faster phase varies linearly with [2′dmT], defining an apparent second-order rate constant of 0.78±0.08 μM−1 s−1 (Table I). Note that this is essentially identical to the value of K0k1 for S1 (red pathway) in scheme II. However, the rate constant for the slower phase shows no dependence on [2′dmT]. It averages 2–3 s−1 over a 10-fold concentration range of [2′dmT] when we fit data over a time course long enough to include the slow binding of 2′dmT to residual G-actin (see above). Fitting over shorter timer periods that effectively eliminates the contribution of this slow binding to actin increases this rate constant by no more than a factor of 1.5 (data not shown).
The corresponding experiment with HMM in the absence of actin produces a single phase of fluorescence increase whose rate constant varies linearly with [2′dmT], defining an apparent second order rate constant of 0.67±0.05 μM−1 s−1, a dissociation rate constant of 3.7±1.7 s−1, and an apparent dissociation constant of 5.5±2.5 μM (Supplementary Figure 4). Note that this is similar to the value for K0(k1) for S1 in scheme II. These findings indicate that in the absence of actin and strain, the two heads of HMM only populate the M1·T state.
Our results lead directly to a model of strain-induced gating in myosin VI, in which intramolecular strain has two distinct effects: rearward strain on the leading head blocks binding of 2′dmT to the catalytic site and forward strain on the trailing head forces ATP binding to occur exclusively along the red pathway in scheme II. Explicitly testing this model requires measuring the timing of the ATP-induced strong-to-weak transition for actoS1 and actoHMM, and correlating these results with those for 2′dmT binding. We address this issue in the following sections.
The strong-to-weak transition for actoS1
We measured the kinetics of the ATP-induced transition from strong to weak binding for actoS1 by mixing a complex of pyrene-labeled actin+S1 in the stopped flow with ATP. Between 80 to 85% of the resulting fluorescence increase occurred in a single phase (Figure 2A) whose rate constant varied with ATP concentration (Figure 2C, red circles), defining an apparent second-order rate constant of 0.03±0.01 μM−1 s−1 and a maximum rate of approximately 40 s−1. The remaining 15–20% of the amplitude (Figure 2A, black arrow) was associated with a rate constant that averaged 2–3 s−1.
Figure 2.

Kinetics of the actomyosin VI strong-to-weak transition. (A) Fluorescence increase produced by mixing 2 μM wild-type S1+10 μM pyrene-labeled actin (red) or 2 μM S1(del)+10 μM actin (green) with 2 mM ATP. For wild-type S1, the black line is a fit to two exponential terms, while for S1(del), the black line is a fit to a single exponential phase. The black arrow indicates the presence of a slower phase in the wild-type S1 transient, corresponding to a rate of 2.7±0.1 s−1. (B) Fluorescence increase produced by mixing 2 μM wild-type HMM+10 μM pyrene-labeled actin with 2 mM ATP (blue) or 2 μM wild-type HMM+10 μM actin with 2 mM ATP+20 μM blebbistatin (pink). Inset: the fluorescence increase produced by mixing 2 μM wild-type HMM+10 μM pyrene-labeled actin (blue, on shortened time scale) or 2 μM HMM(del)+10 μM actin with 2 mM ATP (magenta) fit a single exponential process (black line). (C) Plot of rate constant versus [ATP] for the experiments depicted in panels A and B. The rate constant for the major phase for wild-type S1 (red) shows a similar ATP concentration dependence to that for wild-type HMM (blue). Fitting the latter to a rectangular hyperbola yields (solid blue line) a maximum rate of 40±17 s−1 (Table I). The rate constant for S1(del) (green) likewise shows a similar ATP concentration dependence to that for HMM(del) (magenta). Fitting the latter to a rectangular hyperbola (dashed magenta line) yields a maximum rate of 498±78 s−1 (Table I).
Our results with S1 indicate that in the absence of strain, the values of k3 and k4 in scheme II are equal to the maximum, extrapolated rate constants for the two phases in this fluorescence increase—approximately 40 s−1 for the major phase and 2–3 s−1 for the minor phase (Figure 2A; Table I). Note that the major phase of this transient has an apparent second-order rate constant very similar to K0(k2) in scheme II. We conclude that this phase is caused by binding of ATP along the green pathway in scheme II. This in turn implies that in the absence of strain, k4, is approximately 40 s−1 and, therefore, k3 is 2–3 s−1.
The strong-to-weak transition for HMM
Mixing a complex of 10 μM pyrene-labeled actin+2 μM HMM in the stopped flow with 2 mM ATP produced a low amplitude fluorescence increase that returns to baseline over the next 3 min, as the remaining ATP is hydrolyzed. When observed over a shorter time course (Figure 2B, inset, blue), the fluorescence increase fits a single exponential process (solid black line) whose rate constant varies hyperbolically with actin concentration, defining a maximum rate of 40±17 s−1 and an apparent second-order rate constant of 0.07±0.01 μM−1 s−1 (Table I; Figure 2C, blue circles).
The low amplitude of the signal with HMM suggests that under steady state, processive conditions, most molecules of HMM are strongly attached to actin via both heads. We verified this conclusion by mixing pyrene actin+HMM in the stopped flow with ATP+20 μM blebbistatin. Blebbistatin prevents rebinding of the detached heads (Ramamurthy et al, 2004). Results are depicted in Figure 2B. In the presence of blebbistatin (pink), the fluorescence increase produced after mixing pyrene actin-S1 with ATP is nearly 10-fold larger in amplitude than in its absence. Its slow rate constant of approximately 0.002 s−1 reflects the time required for blebbistatin to trap a weak actin binding conformation.
We had proposed in the previous section that forward strain forces the trailing head to bind ATP exclusively along the red pathway in scheme II. This could only occur if forward strain makes k3≫k4 and shunts the binding reaction along the red pathway. However, because myosin VI is highly processive and because blebbistatin binds slowly to HMM, we cannot use the pyrene signal to test this hypothesis by directly measuring the value of k3. We have therefore utilized several complementary approaches that are described in the next three sections.
A unique insert near the nucleotide binding pocket contributes to gating
There are two unique inserts within the myosin VI motor domain (Ménétrey et al, 2005). One of these, insert 1, is near the nucleotide binding pocket (Ménétrey et al, 2005), and could physically impede the entry of the gamma phosphate of ATP into the binding pocket, providing the physical basis for strain-modulated ATP binding. To assess the role of insert 1 in gating, we removed it from the monomeric and dimeric constructs (deletion of C278-A303).
Mixing of 2′dmT with either the monomeric, S1(del), or dimeric, HMM(del), deletion construct produced an increase in fluorescence that occurred in a single phase, with essentially identical amplitudes and similar rates (Figure 3). If gating in myosin VI requires a strain-dependent blockage of ATP binding to the catalytic site, it follows that HMM(del) should not be processive. This is consistent with single-molecule motility studies, which reveal that adding ATP to a complex of HMM(del)+actin produces no processive movement (data not shown). However, the mutant HMM(del) and S1(del) constructs do move actin filaments in an in vitro filament gliding assay via multiple motors, at mean (±s.d.) velocities of 0.76±0.10 μm s−1 (n=182) and 0.34±0.04 μm s−1 (n=47), respectively. This demonstrates that deletion of insert 1 does not affect the power stroke. These velocities are approximately twice that of wild type (Morris et al, 2003), consistent with the increased ATPase rates (Table I). A plot of rate versus nucleotide concentration for the binding of 2′dmT (Figure 3) defines apparent second-order rate constants for actoHMM(del) and actoS1(del) summarized in Table I. Note that these rate constants are similar in value to K0(k1), defined by the red pathway in scheme II.
Figure 3.

Kinetics of 2′dmT binding to either monomeric (S1) or dimeric (HMM) insert 1 deletion constructs (del) bound to actin. Mixing 400 μM 2′dmT with actin-S1(del) (green) and actin-HMM(del) (magenta) produces a fluorescence increase that occurs in a single phase (inset), with rate constants of 206.3±38.9 and 121.5±14.7 s−1, respectively. The rate constants for both constructs vary linearly with [2′dmT], defining apparent second-order rate constants listed in Table I.
We also examined the kinetics of the strong-to-weak transition in these constructs. Mixing pyrene actin+S1(del) with ATP produced a fluorescence increase, whose amplitude was essentially identical to the corresponding experiments with wild-type S1 (Figure 2A). However, for S1(del), the strong-to-weak transition occurred in a single phase (Figure 2C, dotted magenta line). The rate constant for this process varied hyperbolically with ATP concentration, extrapolating to a maximum rate of 498±78 s−1 and an apparent second-order rate constant of 1.11±0.05 μM−1 s−1 (Table I). Nearly identical results were seen with HMM(del). Note that this apparent second-order rate constant is also similar to K0(k1) in scheme II. This implies that deletion of insert 1 drives the ATP binding reaction along the red pathway in scheme II. However, deletion of insert 1 also accelerates k3 nearly 200-fold (Table I).
If forward strain and deletion of insert 1 both drive ATP binding along the red pathway in scheme II, does it then follow that the effect of forward strain is mimicked structurally by deletion of insert 1? If so, we would conclude that forward strain accelerates k3 from 2–3 s−1 to nearly 500 s−1. We address this issue by examining the kinetics of ADP binding to actomyosin VI and by measuring the effect of ADP on the steady-state turnover of the HMM molecules (see below).
ADP binding is not affected by strain
Mixing 2′dmD with actoHMM and actoS1 in the stopped flow produces a fluorescence increase that consists of two phases (data not shown). Although these results superficially resemble those for 2′dmT, they differ in one significant way—the rate constants for both phases vary linearly with 2′dmD concentration, not only for S1 but also for HMM (open and closed red circles in Figure 4, depicted on an expanded y-axis in the inset). These results imply a pathway analogous to scheme II:  where the red pathway in scheme III equilibrates approximately 10-times faster than the green pathway. Since ADP binding has no effect on the fluorescence of a pyrene actin:S1 or pyrene actin:HMM complex (data not shown), we conclude that both the A·M1·D and A·M2·D states are strongly bound to actin. Finally, our results argue that whereas rearward strain on the leading head blocks ATP binding, it has no effect on ADP binding.
Figure 4.

Kinetics of ADP binding to either monomeric (S1) or dimeric (HMM) myosin VI bound to actin. Plots of rate constant versus [2′dmD] for the fast (solid circles) and slow (open circles) phases. For both S1 (red) and HMM (blue), both rate constants vary linearly, with [2′dmD], defining apparent second-order rate constants listed in Table I. Inset: on an expanded y-axis, the slow phase for both S1 (red) and HMM (blue) vary linearly with [2′dmD], unlike the case with [2′dmT] (Figure 1).
Single-molecule motility studies
Our results predict that since ADP will preferentially outcompete ATP for binding to the lead head, increasing the ADP concentration should enhance the myosin VI run-length and increase processivity. We examined the processivity of the wild-type zippered dimer in the presence of low and high ADP concentrations. In this assay, myosin VI constructs were initially bound to actin filaments in the absence of nucleotide. Processive runs were initiated by the addition of 2 mM ATP. As summarized in the histogram of Figure 5A and C, single molecules of the wild-type dimer had an average run-length (±s.d.) of 554±283 nm (n=28), with average velocity (±s.d.) of 156±61 nm s−1 in the absence of ADP. As summarized in Figure 5B and D, the average run-length increased in length to 796±639 nm (n=77) and the average velocity was unchanged (173±77 nm s−1) in the presence of 100 μM ADP, which is likely to be the maximum physiological concentration (Roth and Weiner, 1991). The run-length data in the presence of ADP deviated from a normal distribution, and thus a Mann–Whitney U-test was applied to evaluate possible significance. The test gave U=750 (z=2.377), whereas the value if the two distributions had the same mean would have been 1078. The probability of a discrepancy that large or greater for (n, m)=(28,77) being due to chance is less than 0.02. Thus, the addition of 100 μM ADP significantly increased the average run-length myosin VI by more than 200 nm.
Figure 5.

Single-molecule motility. (A) Histogram of the processive run lengths of individual myosin VI dimers moving at 2 mM ATP and no added ADP. (B) Histogram of the processive run lengths of individual myosin VI dimers moving at 2 mM ATP and 100 μM ADP. (C) Histogram of the average velocity of individual myosin VI dimers moving at 2 mM ATP and no added ADP. (D) Histogram of the average velocity of individual myosin VI dimers moving at 2 mM ATP and 100 μM ADP. Note that the dimer with insert 1 deleted did not take any steps in the presence of 2 mM ATP at either ADP concentration.
Dissociation from actin is accelerated by forward strain
The fact that the single-molecule HMM velocity was not slowed by 100 μM ADP implies that actin dissociation (k3 in scheme II) must be accelerated by forward strain. If not, the stepping rate would be slowed at high [ADP], since ADP would occupy the lead head until the rear head dissociates. In this scenario, ADP would then dissociate at ∼5 s−1 (Table I) and this would rate-limit the binding of ATP the new rear head. Likewise, the steady-state ATPase rate would also be expected to decrease in the presence of 100 μM ADP if k3 were not accelerated by forward strain. This is because the normal rate-limiting step of ADP dissociation, at ∼5 s−1, would then be followed by another similarly rate-limiting step—the slow dissociation of the trailing head from actin (with k3=2–3 s−1). In fact, we observe that the steady-state actin-activated ATPase rate of actoHMM at 2 mM ATP is unaffected by 100 μM ADP (2.7±0.5 s−1head−1 versus 2.9±0.9 s−1head−1 in the absence of ADP). Hence, we conclude that forward strain accelerates the rate of ATP-induced dissociation from actin, consistent with our results with the insert 1 deletion constructs.
Discussion
Strain regulates ATP binding in myosin VI
The major finding of this study is that the ATPase cycles of dimeric and monomeric myosin VI constructs differ from each other in one important respect—in the kinetics of ATP binding. We infer that this difference reflects the effect of the intramolecular strain that develops when both heads of a dimer are strongly bound to actin—something that occurs under physiologically-relevant conditions (Figure 2). Like myosin V, the major effect of strain in myosin VI is on the lead head, which remains strong binding until strain is relieved by rear head dissociation (Rosenfeld and Sweeney, 2004). However, strong binding is maintained in myosin V by using rearward strain to block ADP release, whereas in myosin VI, it is maintained by using rearward strain to block ATP binding. Finally, whereas forward strain on the rear head modestly accelerates ADP release in myosin V, it accelerates ATP binding in myosin VI 10-fold by shunting the binding reaction along the red pathway defined in scheme II.
A key feature of the myosin VI mechanism is that ATP binding occurs through a branched pathway, depicted in scheme II. There is, however, an alternative possibility that the rigor actomyosin VI complex itself is an equilibrium mixture of two states (A·M1 and A·M2). If these two states were to interconvert very rapidly, the kinetics of ATP binding would be identical to those we describe in scheme II. In this regard, we note that two actomyosin rigor conformations with different ATP binding rates have been previously described for a class I myosin (myo1b) (Geeves et al, 2000; Clark et al, 2005). The existence of two conformational changes in rapid succession induced by ATP binding also has been described previously for myosin II (Rosenfeld and Taylor, 1984b) and myosin V (Yengo et al, 2002), and is easily detected when using nucleotide analogues that bind more slowly and with lower affinity (Rosenfeld and Taylor, 1984b; Yengo et al, 2002).
Given these findings, we propose a model in which: (1) rearward strain on the leading head blocks ATP binding, by reducing K0 in scheme II and preventing formation of a collision complex; and 2) forward strain on the trailing head makes k3k4 so that ATP binding is shunted along the red pathway in scheme II. The structural basis for these strain-dependent effects on ATP binding involves insert 1, which is specific to the myosin VI class.
Insert 1 is the structural determinant of strain-mediated gating in myosin VI
Based on our earlier work on insert 1, we predicted that its removal would eliminate strain-dependent blockade of ATP binding, and thus gating and processivity. We were able to confirm these predictions by measuring the rate of ATP binding to the deletion mutants (Figure 3), by demonstrating the loss of gating in the ATPase assays (Table I), and by failure of the HMM(del) to move as a single molecule. Our data therefore suggest that insert 1 can assume one of three orientations whose distribution is altered by strain. In the first, which is favored by rearward strain, insert 1 assumes a blocking position in the catalytic site which prevents ATP, but not ADP, from binding. In the second, which is favored in the absence of strain, insert 1 assumes a rapid equilibrium distribution of two orientations—unblocking and partially blocking—which partition the kinetics of ATP binding to the red and green pathways in scheme II. We also propose that forward strain shifts this equilibrium to favor the unblocking position and thereby shunts ATP binding to the red pathway in scheme II. Furthermore, in the absence of strain, we propose that insert 1 influences the actin binding cleft and interface of myosin VI in such a way as to slow ATP-induced dissociation (k3 in scheme II). However, forward strain accelerates k3 in a manner equivalent to removing insert 1. Taken together, our results allow us to describe a comprehensive model for how strain drives the processivity of myosin VI. This is summarized in Figure 6.
Figure 6.

Model for myosin VI gating. On the left, a dimeric myosin VI construct is attached to an actin filament in rigor. The two heads are labeled magenta and cyan to distinguish them. The trailing (magenta) head experiences forward strain (magenta arrow), whereas the leading head (cyan) experiences rearward strain (cyan arrow). Under these conditions, insert 1 (gold ellipse) is in an ‘unblocking' orientation on the trailing head and in a ‘blocking ‘orientation on the leading head. ATP can only bind to the trailing head along the red pathway in scheme II. Dissociation of the trailing head relieves the rearward strain on the leading head. With forward stepping and strong attachment of the formerly trailing head (magenta) into a new, leading position, forward strain on the new trailing (cyan) head pulls insert 1 out of the way and allows rapid binding of ATP. The figure illustrates the conditions of Figure 1—where excess ADP is not present. Under physiologic conditions, intracellular ADP concentrations would be high enough to occupy the empty catalytic sites, since ADP binding is not affected by strain (Figure 4). However, this would not affect the mechanism of gating, since ADP release is likewise unaffected by strain (Supplementary Figure 3).
An alternative model for myosin VI gating
In a recent study (Robblee et al, 2004), it was proposed that myosin VI gating is accomplished instead by preventing the lead head from strongly binding to actin and releasing product under steady-state, physiologic conditions (millimolar ATP concentration). This model would argue that intramolecular strain is not relevant to gating under physiologic, processive conditions. However, our results are not consistent with this model, as our transient data demonstrate that both heads can release phosphate and ADP (Supplementary Figures 2 and 3) and can bind strongly to actin (Supplementary Figure 1) under steady-state conditions (Figure 2B). Furthermore, whereas the model of Robblee et al (2004) would predict that run length would be insensitive to [ADP], our model correctly predicts (Figure 5) that run length should increase with increasing [ADP].
Relationship of the gating to anchoring
In a previous study, Altman et al (2004) applied levels of reverse load on dimeric myosin VI bound to actin that exceeded the stall force—conditions that would mimic those where myosin VI would function as an anchor, instead of as a transport motor. They found that these levels of load enhanced ADP binding to actomyosin VI and only slightly reduced the rate of ATP binding. This finding may appear at odds with our results. However, their results can be accommodated by our model if externally applied reverse strain on the rear head maintains insert 1 in the partially blocking position. In this orientation, insert 1 would drive binding of both ATP and ADP along the slower, green pathway in schemes II and III. However, the apparent second-order rate constant for ADP binding along the green pathway in scheme III is still 3–4 times faster than the corresponding rate for ATP binding along the green pathway in scheme II, and the rate constant for ADP dissociation is approximately three-fold slower (Table I). Thus, the affinity of ADP for the catalytic site along this pathway is over 12-fold higher than the corresponding value for ATP, and at physiologic nucleotide concentrations, ADP could effectively compete with ATP for binding to the rear head.
Additionally, Altman et al (2004) observed that as rearward strain increased beyond the stall force, ADP binding was further accelerated. This implies that levels of rearward strain much higher than those generated when the two heads pull against each other accelerate one of the forward rate constants for ADP binding. Thus, the mechanism that maintains attachment of the two heads of a dimer that is acting as an anchor, under a high external load, is different from that for a processively moving dimer. For a processively moving myosin VI, ATP outcompetes ADP for binding to the rear head, whereas the reverse is true for the lead head. By contrast, when myosin VI acts as an anchor against a large, reverse-directed external load, ADP can effectively compete with ATP for binding to both heads.
ADP enhances myosin VI processivity
Since a processive run is terminated by dissociation of the lead head before the rear head, one would predict that increasing [ADP] would increase the run-length for myosin VI by further slowing lead head detachment. This is demonstrated in Figure 5. This is not a minor point, since it has been argued (Frank et al, 2004) that myosin VI is ill suited to be a vesicle transporter, due to its short run-length. However, all in vitro estimates of run lengths of myosin VI have been at much lower than physiological [ADP].
In contrast to myosin VI, increasing [ADP] decreases the run-length of myosin V (Baker et al, 2004). We suggest that in that case, ADP successfully competes with ATP on the rear head of myosin V, slowing its detachment. Although dissociation of ADP from the lead head of myosin V is extremely slow due to the rearward strain, it can occur (Rosenfeld and Sweeney, 2004). If it does, ATP would bind rapidly and not be affected by ADP. Thus, the effect of slowing detachment of the rear head of myosin V by increasing ADP concentration would be to give more time for the lead head to release ADP, bind ATP, and detach. This would terminate a processive run.
Physiology drives enzymology
The roles of myosin VI as both a highly processive transporter and an anchor relies on reverse strain greatly favoring binding of ADP. Of all of the classes of myosins that have been studied, only myosin VI displays these properties. These dual roles of processive transporter and actin-based anchor cannot both be optimized in a +-end-directed myosin, since reverse strain would enhance both ADP and ATP binding.
While the mechanism of strain-dependent processivity in myosin VI differs from myosin V, it is shared by another processive motor from another superfamily—kinesin I. As with myosin VI, rearward strain on the forward head of kinesin I blocks ATP binding (Rosenfeld et al, 2003). Intriguingly, while there are examples of reverse-direction kinesins, such as ncd (Walker et al, 1990), no processive reverse-direction kinesins have been found. This would require a different type of gating within the kinesin motor, perhaps mirroring the mechanism for myosin V. The existence of cytoplasmic dynein as a processive, −-end-directed microtubule motor (Paschal and Vallee, 1987) might also have removed the evolutionary pressure to produce a processive ncd. Nevertheless, optimal motor function of ncd would require a different effect of strain on the ncd motor as compared with kinesin. The fact that the ncd lever arm is attached to the N-terminus of the motor (Sablin et al, 1996), whereas in kinesin I, the neck linker is attached to the C-terminus of the motor (Kull et al, 1996), could provide the basis for differential effects of strain.
In all three documented cases of gating in processive motors—myosin V, myosin VI, and kinesin I—there is a common mechanistic theme. In each case, the major effect of strain is on the lead head, which is induced to remain in a strong binding state until strain is relieved. Whether other processive motors use a similar mechanism will require further investigation.
Materials and methods
Reagents
The N-methylanthraniloyl derivative of 2′deoxy ADP was synthesized as described (Hiratsuka, 1983). N-1 pyrenyl iodoacetamide was obtained from Molecular Probes (Portland, OR). Protease inhibitors and chemicals used for buffers were obtained from Sigma. Prepoured Sephadex G25 columns (PD10) were obtained from Amersham Biosciences. Actin and PBP were prepared as described (Rosenfeld and Sweeney, 2004).
Myosin VI constructs, expression, and ATPase assays
As previously described (De La Cruz et al, 2001), a ‘zippered' dimer myosin VI construct was created by truncation at Arg-994, followed by a leucine zipper (GCN4; Lumb et al, 1994), to ensure dimerization. The myosin VI-S1 (monomer) construct was created by truncation at amino acid 839 (Park et al, 2006). To remove insert 1 for the S1 and zippered dimer constructs, mutagenesis was used to delete residues 278–303. In all cases, a Flag tag was appended to the C-terminus to facilitate purification (Sweeney et al, 1998). These constructs were used to create a baculovirus for expression in SF9 cells (Sweeney et al, 1998). ATPase assays were performed as previously described (De La Cruz et al, 2001).
Kinetic methodologies
Kinetic measurements were made using a KinTek stopped flow spectrophotometer for 1.1 ms. The excitation and emission wavelengths for monitoring pyrene-labeled actin and MDCC-labeled PBP fluorescence have been described (Rosenfeld and Sweeney, 2004). For studies of 2′dmD and 2′dmT binding and release, mant fluorescence was monitored by both direct excitation (λex=356 nm) and by energy transfer from vicinal tryptophan residues (λex=295 nm), and both methods gave similar results. Phosphate release transients were fit to the burst equation (Rosenfeld and Sweeney, 2004): 
where F(t) is the time-dependent fluorescence, λp is the rate of phosphate release in the burst phase, and kss is the steady-state rate at the microtubule concentration achieved after mixing in the stopped flow.
For kinetic studies of mant nucleotide binding to actoHMM and actoS1 preparations, the fluorescence transients were fit to two exponential terms and one linear term, the latter to correct for nucleotide binding to residual G-actin: 
Rate constants were typically derived from averaging eight to 12 individual reactions, repeated on 2–3 separate preparations, and are expressed in the text as mean±one s.d.
In general, the relationship of λ to individual rate constants depends on the model. When applied to scheme II, the values λ1,2 are as follows: 

At low [2′dmT], where K0[dmT]≪1, the effective rate constants, keff, for the red and green pathways are described by equations 5 and 6, respectively: 
 and the fractional amplitude of the fast phase in the absence of strain (e.g., for S1) would therefore be defined by equation 7:
Supplementary Figure 5 displays a plot of equation 7 and the data for the fractional amplitude of the fast phase in Figure 1 as a function of [2′dmT]. As the supplement shows, there is reasonable agreement between the data and the fit.
In vitro motility and single molecule motility assays and the determination of run-length and velocity
The in vitro motility assay (gliding actin filaments via multiple motors) was performed following a published protocol (Sellers et al, 1993). The single-molecule motility assay was performed following procedures in Yildiz et al (2003), as modified for myosin VI (Yildiz et al, 2004a, 2004b). Run-length is defined as the total distance between the appearing and the disappearing location of Cy3-labeled myosin VI. The velocity is defined as the run-length divided by run-time. Data where run-length <200 nm or run-time <1.5 s were discarded to eliminate the Brownian motion of Cy3-labeled myosin VI detached from actin filaments. Run lengths and velocities are expressed as mean±standard error of the mean.
Supplementary Material
Supplementary Figure 1b
Supplementary Figure 2
Supplementary Figure 3b
Supplementary Figure 1a
Supplementary Figure 1c
Supplementary Figure 1d
Supplementary Figure 3a
Supplementary Figure 3c
Supplementary Figure 4
Supplementary Figure 5
Supplementary Figure Legends
Acknowledgments
This work was supported by grants from the National Institutes of Health (AR048931 to HLS, GM068625 and AR044420 to PRS, and AR048565 to SSR). We thank Anna Li and Xiaoyan Liu for preparing the recombinant proteins. We thank Drs Ronald Milligan and Anne Houdusse for their thoughtful review of the manuscript and Dr Martin Pring for his statistical expertise.
References
- Altman D, Sweeney HL, Spudich JA (2004) The mechanism of myosin VI translocation and its load-induced anchoring. Cell 116: 737–749 [DOI] [PubMed] [Google Scholar]
- Baker JE, Krementsova EB, Kennedy GG, Armstrong A, Trybus KM, Warshaw DM (2004) Myosin V processivity: multiple kinetic pathways for head-to-head coordination. Proc Nat Acad Sci USA 101: 5542–5546 [DOI] [PMC free article] [PubMed] [Google Scholar]
- Clark R, Ansari MA, Dash S, Geeves MA, Coluccio LM (2005) Loop 1 of transducer region in mammalian class I myosin, Myo1b, modulates actin affinity, ATPase activity, and nucleotide access. J Biol Chem 280: 30935–30942 [DOI] [PubMed] [Google Scholar]
- De La Cruz EM, Ostap EM, Sweeney HL (2001) Kinetic mechanism and regulation of myosin VI. J Biol Chem 276: 32373–32381 [DOI] [PubMed] [Google Scholar]
- Frank DJ, Noguchi T, Miller KG (2004) Myosin VI: a structural role in actin organization important for protein and organelle localization and trafficking. Curr Opin Cell Biol 16: 189–194 [DOI] [PubMed] [Google Scholar]
- Geeves MA, Perreault-Micale C, Coluccio LM (2000) Kinetic analyses of a truncated mammalian myosin I suggest a novel isomerization event preceding nucleotide binding. J Biol Chem 275: 21624–21630 [DOI] [PubMed] [Google Scholar]
- Hiratsuka T (1983) New ribose-modified fluorescent analogs of adenine and guanine nucleotides available as substrates for various enzymes. Biochim Biophys Acta 742: 496–508 [DOI] [PubMed] [Google Scholar]
- Klumpp LM, Hoenger A, Gilbert SP (2004) Kinesin's second step. Proc Nat Acad Sci USA 101: 3444–3449 [DOI] [PMC free article] [PubMed] [Google Scholar]
- Kull FJ, Sablin EP, Lau R, Fletterick RJ, Vale RD (1996) Crystal structure of the kinesin motor domain reveals a structural similarity to myosin. Nature 380: 550–555 [DOI] [PMC free article] [PubMed] [Google Scholar]
- Lumb KJ, Carr CM, Kim PS (1994) Subdomain folding of the coiled coil leucine zipper from the bZIP transcriptional activator GCN4. Biochemistry 33: 7361–7367 [DOI] [PubMed] [Google Scholar]
- Ménétrey J, Bahloul A, Wells AL, Yengo CM, Morris CA, Sweeney HL, Houdusse A (2005) The structure of the myosin VI motor reveals the mechanism of directionality reversal. Nature 435: 779–785 [DOI] [PMC free article] [PubMed] [Google Scholar]
- Morris CA, Wells AL, Yang Z, Chen LQ, Baldacchino CV, Sweeney HL (2003) Calcium functionally uncouples the heads of myosin VI. J Biol Chem 278: 23324–23330 [DOI] [PubMed] [Google Scholar]
- Nishikawa S, Homma K, Komori Y, Iwaki M, Wazawa T, Hikikoshi Iwane A, Saito J, Ikebe R, Katayama E, Yanagida T, Ikebe M (2002) Class VI myosin moves processively along actin filaments backward with large steps. BBRC 290: 311–317 [DOI] [PubMed] [Google Scholar]
- Okten Z, Churchman LS, Rock RS, Spudich JA (2004) Myosin VI walks hand-over-hand along actin. Nat Struct Mol Biol 11: 884–887 [DOI] [PubMed] [Google Scholar]
- Park H, Ramamurthy B, Travaglia M, Safer D, Chen L.-Q, Franzini-Armstrong C, Selvin PR, Sweeney HL (2006) Full-length myosin VI dimerizes and moves processively along actin filaments upon monomer clustering. Mol Cell 21: 331–336 [DOI] [PubMed] [Google Scholar]
- Paschal BM, Vallee RB (1987) Retrograde transport by the microtubule-associated protein MAP 1C. Nature 330: 181–183 [DOI] [PubMed] [Google Scholar]
- Purcell TJ, Sweeney HL, Spudich JA (2005) A force-dependent state controls the coordination of processive myosin V. Proc Natl Acad Sci USA 102: 13873–13878 [DOI] [PMC free article] [PubMed] [Google Scholar]
- Ramamurthy B, Yengo CM, Straight AF, Mitchison TJ, Sweeney HL (2004) Kinetic mechanism of blebbistatin inhibition of nonmuscle myosin IIb. Biochemistry 43: 14832–14839 [DOI] [PubMed] [Google Scholar]
- Robblee JP, Olivares AO, De La Cruz EM (2004) Mechanism of nucleotide binding to actomyosin VI: evidence for allosteric head–head communication. J Biol Chem 279: 38608–38617 [DOI] [PubMed] [Google Scholar]
- Rock RS, Ramamurthy B, Dunn AR, Beccafico S, Morris C, Spink B, Rami B, Franzini-Armstrong C, Spudich JA, Sweeney HL (2005) A flexible domain is essential for the large step size and processivity of myosin VI. Mol Cell 17: 603–609 [DOI] [PubMed] [Google Scholar]
- Rock RS, Rice SE, Wells AL, Purcell TJ, Spudich JA, Sweeney HL (2001) Myosin VI is a processive motor with a large step size. Proc Natl Acad Sci USA 98: 13655–13659 [DOI] [PMC free article] [PubMed] [Google Scholar]
- Rosenfeld SS, Taylor EW (1984a) The ATPase mechanism of skeletal and smooth muscle acto-subfragment 1. J Biol Chem 259: 11908–11919 [PubMed] [Google Scholar]
- Rosenfeld SS, Taylor EW (1984b) Reactions of 1-N6-ethenoadenosine nucleotides with myosin subfragment 1 and acto-subfragment 1 of skeletal and smooth muscle. J Biol Chem 259: 11920–11929 [PubMed] [Google Scholar]
- Rosenfeld SS, Sweeney HL (2004) A model of myosin V processivity. J Biol Chem 279: 40100–40111 [DOI] [PubMed] [Google Scholar]
- Rosenfeld SS, Fordyce PM, Jefferson GM, King PH, Block SM (2003) Stepping and stretching: how kinesin uses internal strain to walk processively. J Biol Chem 278: 18550–18556 [DOI] [PMC free article] [PubMed] [Google Scholar]
- Rosenfeld SS, Xing J, Whitaker M, Cheung HC, Brown F, Wells A, Milligan RA, Sweeney HL (2000) Kinetic and spectroscopic evidence for three actomyosin:ADP states in smooth muscle. J Biol Chem 275: 25418–25426 [DOI] [PubMed] [Google Scholar]
- Roth K, Weiner MW (1991) Determination of cytosolic ADP and AMP concentrations and the free energy of ATP hydrolysis in human muscle and brain tissues with 31P NMR spectroscopy. Magn Reson Med 22: 505–511 [DOI] [PubMed] [Google Scholar]
- Sablin EP, Kull FJ, Cooke R, Vale RD, Fletterick RJ (1996) Crystal structure of the motor domain of the kinesin-related motor ncd. Nature 380: 555–559 [DOI] [PubMed] [Google Scholar]
- Sellers JR, Cuda G, Wang F, Homsher E (1993) Myosin-specific adaptations of the motility assay. Methods Cell Biol 39: 23–49 [DOI] [PubMed] [Google Scholar]
- Sweeney HL, Rosenfeld SS, Brown F, Faust L, Smith J, Xing J, Stein LA, Sellers JR (1998) Kinetic tuning of myosin via a flexible loop adjacent to the nucleotide binding pocket. J Biol Chem 273: 6262–6270 [DOI] [PubMed] [Google Scholar]
- Taylor EW (1991) Kinetic studies on the association and dissociation of myosin subfragment 1 and actin. J Biol Chem 266: 294–302 [PubMed] [Google Scholar]
- Veigel C, Schmitz S, Wang F, Sellers JR (2005) Load-dependent kinetics of myosin-V can explain its high processivity. Nat Cell Biol 7: 861–869 [DOI] [PubMed] [Google Scholar]
- Veigel C, Wang F, Bartoo ML, Sellers JR, Molloy JE (2002) The gated gait of the processive molecular motor, myosin V. Nat Cell Biol 4: 59–65 [DOI] [PubMed] [Google Scholar]
- Wells AL, Lin AW, Chen LQ, Safer D, Cain SM, Hasson T, Carragher BO, Milligan RA, Sweeney HL (1999) Myosin VI is an actin-based motor that moves backwards. Nature 401: 505–508 [DOI] [PubMed] [Google Scholar]
- Yengo CM, De la Cruz EM, Safer D, Ostap EM, Sweeney HL (2002) Kinetic characterization of the weak binding states of myosin V. Biochemistry 41: 8508–8517 [DOI] [PubMed] [Google Scholar]
- Yildiz A, Forkey JN, McKinney SN, Ha T, Goldman YE, Selvin PR (2003) Myosin V walks hand-over-hand: single fluorophores imaging with 1.5 nm localization. Science 300: 2061–2065 [DOI] [PubMed] [Google Scholar]
- Yildiz A, Park H, Safer D, Yang Z, Chen LQ, Selvin PR, Sweeney HL (2004a) Myosin VI steps via a hand-over-hand mechanism with its lever arm undergoing fluctuations when attached to actin. J Biol Chem 279: 37223–37226 [DOI] [PubMed] [Google Scholar]
- Yildiz A, Tomishige M, Vale RD, Selvin PR (2004b) Kinesin walks hand-over-hand. Science 303: 676–678 [DOI] [PubMed] [Google Scholar]
Associated Data
This section collects any data citations, data availability statements, or supplementary materials included in this article.
Supplementary Materials
Supplementary Figure 1b
Supplementary Figure 2
Supplementary Figure 3b
Supplementary Figure 1a
Supplementary Figure 1c
Supplementary Figure 1d
Supplementary Figure 3a
Supplementary Figure 3c
Supplementary Figure 4
Supplementary Figure 5
Supplementary Figure Legends