Abstract
Longitudinal in vivo micro-computerized tomography (CT) imaging was used to monitor bone resorption in a rat fibula osteotomy model. Quantitative image post-processing techniques were developed for spatially aligning the longitudinal data sets. Nominal length and bone volume in the proximal and distal segments of the fibula after the osteotomy were measured, and quantitative comparisons of bone loss over a 13-week period post-surgery were made in five individual rats. A significant decrease in nominal length and bone volume of the distal segment was observed 13 weeks post surgery. A significant decrease in bone volume was also observed in the proximal segment. However, no change in nominal length was observed for the proximal segment of the fibula. This study illustrates the power of this non-invasive technology to measure in vivo small changes in bone length and volume using just a small cohort of animals.
INTRODUCTION
Micro-computed tomography (micro-CT) is a non-invasive imaging technology that has been used widely to monitor various treatment effects in small animals over time. For example, it has been used to study in vivo changes in trabecular architecture of the tibia in ovariectomized rats1 and the effects of hormone replacement therapy in estrogen-depleted rats.2 Although previous studies were typically performed using a synchrotron light source, more recent longitudinal in vivo studies have utilized commercially available micro-CT imaging systems.3 Some of the advantages of this system are that it provides high-resolution (50-100 µm) three-dimensional images of the structures under investigation and the image acquisition is faster (less than 15 minutes per sample) as compared to other non-invasive high-resolution imaging techniques.
In the present study, we investigated the dynamic changes in bone tissue volume using a critical-sized osteotomy of the rat fibula. We chose a critical-sized osteotomy, since this experimental bone trauma often exhibits detectable changes in bone structure over time. The goal of this study was to accurately monitor changes in bone area and volume over time post-osteotomy, and to develop a methodology that could be potentially useful in the development and validation of treatment plans for bone-related pathological conditions.
METHODS
Study Sample
All animal procedures used in this study were reviewed and approved by the Institutional Animal Care and Use Committee. The protocol involved the use of five adult (11 months old) male Sprague-Dawley rats (Harlan Sprague-Dawley, Inc., Indianapolis, Indiana) weighing 500-600 g. Bilateral fibula osteotomies were performed on the animals' hind limbs using a modification of the procedure first described by Petersson and Johnell.4 Each rat was anesthetized with an intraperitoneal (IP) injection of Nembutal (Abbot Laboratories, Abbot Park, Illinois; 60 mg/kg body weight (BW). They were also given an IP injection of cefazolin (Abbot Laboratories, Abbot Park, Illinois; 30 mg/kg BW) as an antibiotic prophylaxis. A fine-toothed clipper was used to circumferentially shave the entire hind limb from the knee to the ankle and the shaved region was disinfected with Betadine solution.
The rats were draped and under sterile conditions, a lateral incision was made that extended vertically from immediately below the knee joint to a point just above the ankle joint. The deep fascia was incised and the lateral intermuscular septum was divided by blunt dissection to separate the anterior and posterior compartment muscles, and to gain access to the lateral surface of the fibula and the attachments for the musculus peronei longus and brevis. With the anterior and posterior muscle groups fully retracted, a six-millimeter portion of the exposed fibula was excised by proximal and distal cuts using a high-speed rotary saw-tooth blade (Fine Science Tools, Foster City, CA). To prevent heat-induced necrosis at the osteotomy site, the rotating blade was pre-cooled to four degrees Celsius by constant irrigation with sterile physiological saline containing antibiotics. After completion of the fibula osteotomies, the gastrocnemius lateralis and medialis muscles were rejoined by a 3-0 absorbable suture (Ethicon, Inc, U.S.A.). The skin incision was closed using a pair of Michele clips and bacitracin ointment was applied to the closed wound. The rats were allowed unrestricted cage activities after surgery and were examined daily for evidence of infection, malnutrition or pain. None of these signs was detected in any of the animals.
Micro-CT Data Acquisition and Three-Dimensional Reconstruction
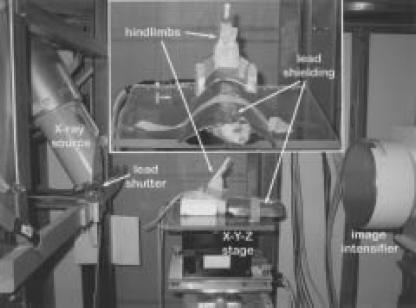
The animals' osteotomized hind limbs were imaged using X-ray micro-computed tomography three, five, ten and 13 weeks following surgery. For each imaging session, the animals were anesthetized for approximately 60 minutes by IP injection of Nembutal (Abbot Laboratories, Abbot Park, Illinois; 60 mg/kg BW). While under anesthesia, the animals were secured in a supine position onto the rotating platform of the micro-CT imaging system,5 and their hind limbs were rigidly supported in the X-ray beam (Figure 1). The animal's torso, head and hind quarters were shielded with a 2-mm thick lead covering to limit the amount of X-ray exposure to other parts of the body. The images were collected at 34 kV, 450 A and one-second exposure time. A lead shuttering system was used to shield the animal from unnecessary exposure to X-ray beam during stage rotation. Isotropic (voxel size = 0.1 x 0.1 x 0.1 mm) three-dimensional volumes were reconstructed (5123) of the hind limbs (Figure 2).6
Figure 1.
Photograph of the rat mounted on the X-Y-Z rotating platform stage with hind limbs secured and raised into the X-ray source beam. The X-ray source is on the left side of the photograph and the detector and CCD camera are located on the right side of the photograph. The inset figure represents a magnified view looking toward the X-ray source and illustrates the complete shielding of the rodent's body from the X-ray source.
Figure 2.
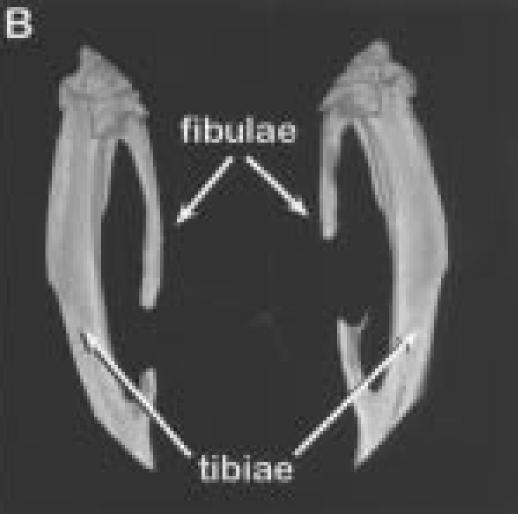
Three-dimensional reconstructions of hind limbs from animal number three.
A.
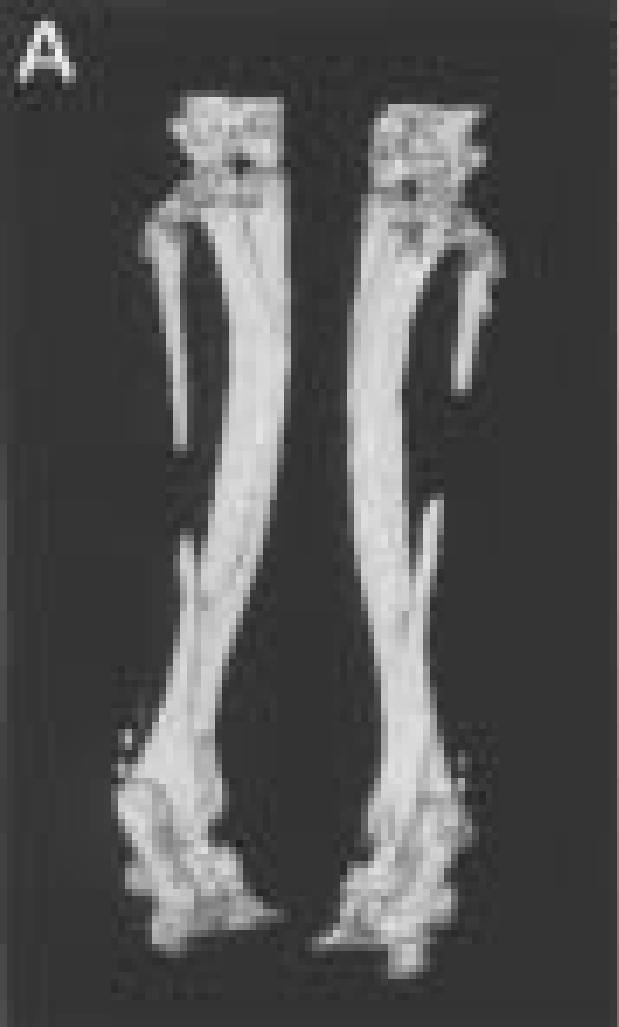
Posterior view of the hind limbs showing the fibula osteotomies.
B.
Enlarged views of the left (on left side), and right legs (on right).
Three-Dimensional Spatial Registration
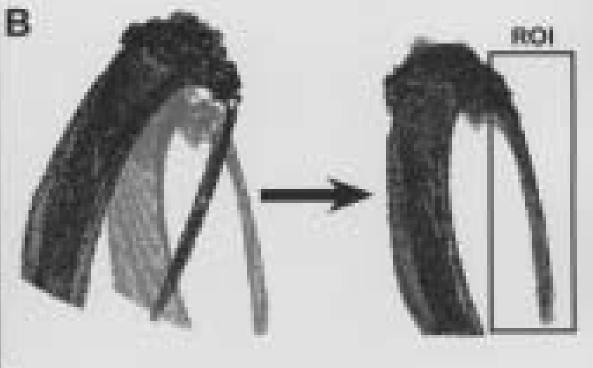
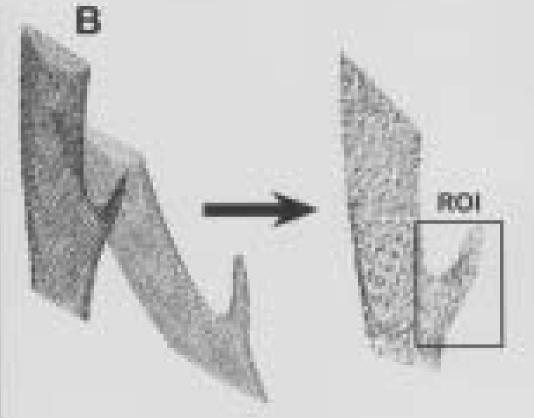
To accurately assess bone resorption longitudinally at the osteotomy site, the data collected at different timepoints was spatially registered to a reference data set (micro-CT data from three weeks post surgery). Because the two fibular segments were unconstrained and free to move relative to one another after the osteotomy, spatial registration of the proximal and distal ends of the fibula was performed separately. The three-dimensional reconstructed images of the hind limbs were manually cropped into a sub-image of the left and right hind limbs (Figure 2B). The left and right hind limbs were further manually cropped into images of the proximal (Figure 3A) and distal (Figure 4A) ends of the fibula. The bone in these sub-images was segmented from its surrounding background using a global threshold. The outer boundary of the segmented bone was automatically identified and these boundary points were used for the spatial registration. For the proximal segment of the fibula, a ROI that extended from the joint between the fibular head and the upper end of the tibia, to the osteotomy site was used for the spatial registration (Figure 3B). For the distal segment, a region of interest (ROI) that included the distal third of the fibula and the region of the bony fusion between the distal ends of the tibia and fibula was used for spatial registration (Figure 4B). An iterative closest point (ICP) method was used for registering the outer boundaries of the segmented regions.7 The ICP algorithm is a least-squares approach that minimizes the distances between two sets of data points. Single-value decomposition was used to calculate the transformation for minimizing the distances between the two sets of data points. The ICP algorithm is complete when the mean distance between the paired points does not change in successive iterations more than a fixed amount (that is, 0.5). Once the data transformation matrices from the registration were obtained, tri-linear interpolation was used for the rigid body transformations of five, 10 and 13 weeks post-surgery (Figures 3B and 4B).
Figure 3.
A.
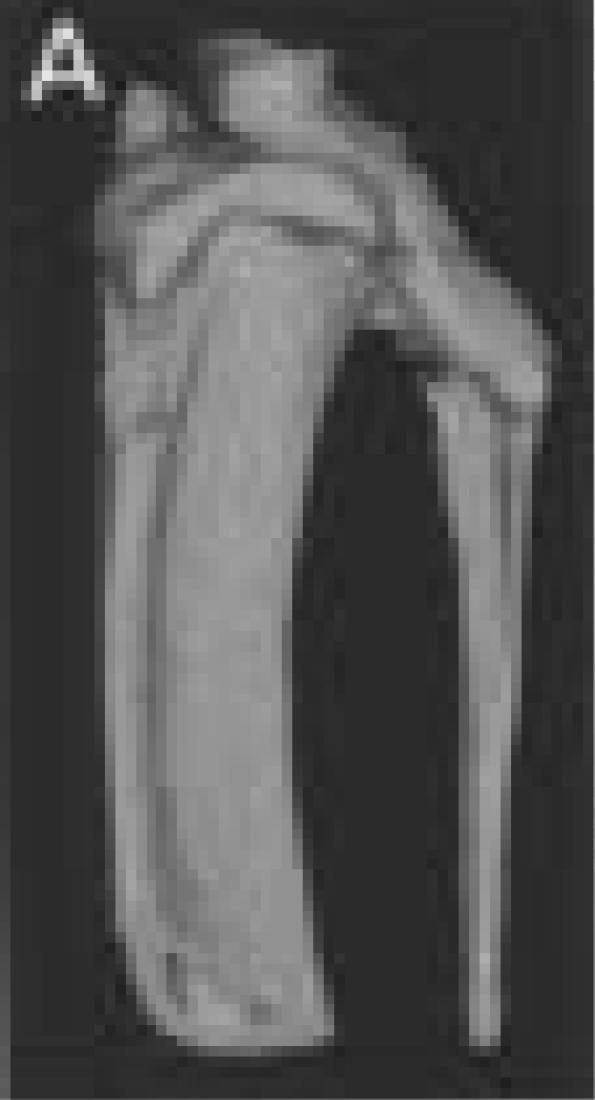
Three-dimensional reconstruction of left proximal tibia and fibula from animal number three taken three weeks post surgery.
B.
Outer outlines of segmented left proximal tibia and fibula from three weeks (grey) and 13 weeks (black) post surgery. These data sets are shown before and after spatial registration to one another.
Figure 4.
A.
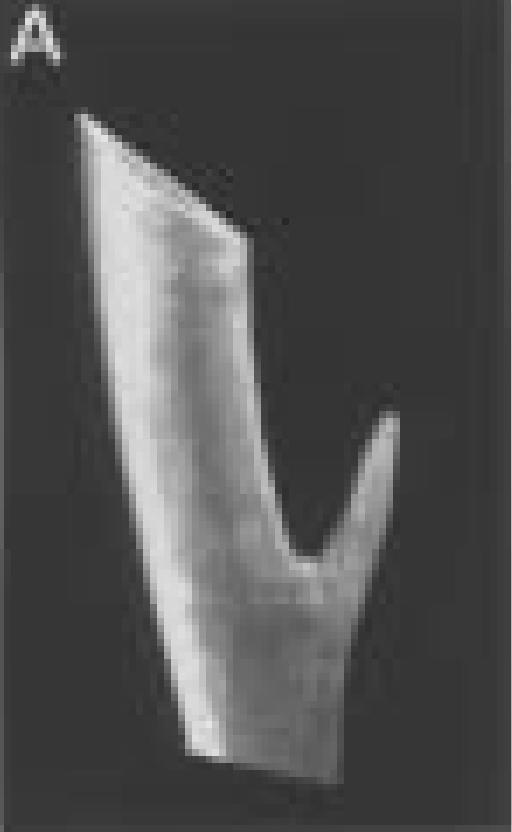
Three-dimensional reconstruction of left distal tibia and fibula from animal number three taken three weeks post surgery.
B.
Outer outlines of segmented left distal tibia and fibula from three weeks (grey) and 13 weeks (black) post-surgery. These data sets are shown before and after spatial registration to one another.
Once the data were spatially registered to the reference data sets, the proximal and distal ends of the fibula were further segmented from the tibia by identifying an oblique clipping plane in a three-dimensional volume visualization program (Volsuite v2.2) and cropping the volumetric images along this clipping plane. The clipping plane for the proximal end was chosen at the start of the growth plate for the fibula. The clipping plane for the distal end was chosen at the fusion point of the fibula with the tibia. These cropped data sets were then spatially oriented relative to their principal axis and minor manual adjustments were made to the clipping planes based on review of the principally oriented datasets.
Quantitative Morphometrics
The lengths of the proximal and distal fibula segments were determined along the principal axis of each segment. The cross-sectional area as a function of nominal length was calculated by summing the segmented pixels in each cross-sectional slice orthogonal to the principal axis of the bone segment. The change in cross-sectional area along the bone segment was plotted for each imaging time-point and changes in area relative to the first time-point (three weeks post surgery) in the longitudinal imaging sequence were noted. Visual inspection of the spatially registered three-dimensional data sets was used to verify the changes in cross-sectional area and nominal length calculated using the quantitative analyses. The bone volume of the segment was calculated by integrating the cross-sectional areas along the length of the bone. Normalized bone volume was calculated relative to the volume calculated three weeks post surgery.
Statistics
Paired t-tests (α = 0.05) were performed to determine whether there was a significant difference in the nominal lengths or in bone volume of the proximal and distal bone segments five, 10 and 13 weeks post surgery relative to three weeks post surgery.
RESULTS
The spatially registered data sets for the proximal and distal ends of the fibula (animal number three) are presented in Figures 3 and 4, respectively. The ICP registration technique worked well for most cases; however, it was extremely sensitive to the ROI chosen for registration. Although care was taken to identify ROIs that were similar in both data sets (particularly in the distal ends of the fibula), there were cases where the ROI had to be adjusted multiple times to obtain the best registration possible. Additionally, the registration technique tended to perform better in the distal segment of the fibula than in the proximal segment. This was due to the beam-hardening artifacts (that is, high grey-level intensity streaks in the image) coming from the larger tibia near the proximal end of the fibula (Figure 3A). These artifacts resulted in a poor segmentation of the proximal fibula, and thus, inaccurate boundary points in this region.
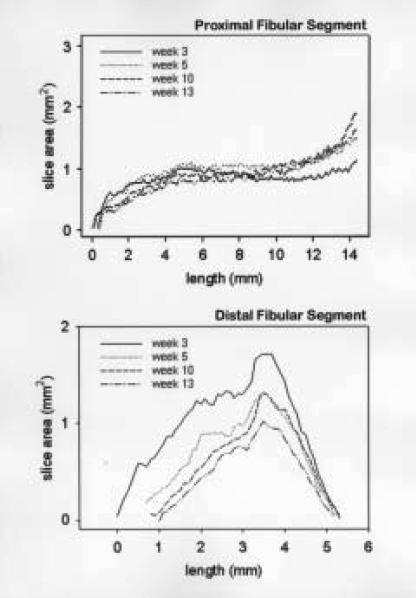
The change in cross-sectional area as a function of nominal length and time are presented for the proximal and distal segments (animal number three) in Figure 5. In this example, we observed a slight decrease in bone volume along the entire length of the proximal segment without a change in the nominal length of the proximal segment. We observed a much larger decrease in bone volume in the distal segment than its corresponding proximal segment (63% versus 20% decreases, respectively), with a concurrent decrease in the distal segment nominal length.
Figure 5.
Plots of cross-sectional area versus length for three, five, ten and 13 weeks post surgery for animal number three. Staring point (nominal length=0) is located at the site of the osteotomy for both the proximal and distal end. The nominal length is oriented along the principal axis of each segment.
The nominal lengths of the proximal and distal segments for all animals and time-points are listed in Table 1. No significant change in nominal length was observed in the proximal segment 13 weeks post surgery. The small differences (± 0.2 mm) in nominal length observed in this region could be attributed to errors in segmentation and registration of the longitudinal data sets. A significant decrease in nominal length was observed in the distal segment starting at five weeks post surgery. This decrease was particularly evident in those cases where the distal segment was less than six millimeters in length by three weeks post surgery. In these cases we observed as much as a 33% decrease in nominal length 13 weeks post surgery.
TABLE 1. Bone Length (mm).
| Animal | Proximal End |
Distal End |
||||||
|---|---|---|---|---|---|---|---|---|
| Weeks (post surgery) |
Weeks (post surgery) |
|||||||
| 3 | 5 | 10 | 13 | 3 | 5 | 10 | 13 | |
| 1 | 12.0 | 12.0 | 11.9 | 12.2 | 6.9 | 6.9 | 6.6 | 6.8 |
| 2 | 13.7 | 13.7 | 13.6 | 13.7 | 5.5 | 5.2 | 4.6 | 4.9 |
| 3 | 14.4 | 14.3 | 14.6 | 14.7 | 3.5 | 2.8 | 2.9 | 2.5 |
| 4 | 10.7 | 10.7 | 10.7 | 10.6 | 7.8 | 7.4 | 7.2 | 7.2 |
| 5 | 15.7 | 15.7 | 15.6 | 15.8 | 4.0 | 3.3 | 2.9 | 2.7 |
The normalized bone volume for the proximal and distal ends, over time, is listed in Table 2. We observed a 20-25% decrease in bone volume in the proximal end 13 weeks post surgery with the exception of animal number three, which showed very little change in bone volume. We also observed a 15% decrease in bone volume by 13 weeks post surgery in the distal end of the fibula, except in the cases where it was less than six millimeters in nominal length by three weeks post-surgery. These cases exhibited as much as a 63% decrease in bone volume. For the study sample, there was a statistically significant difference in normalized bone volume for both the distal and proximal segments 13 weeks post surgery. However, the statistical power of this test was below 0.8 for the distal segment. This indicates that additional samples need to be obtained in order to verify this finding.
TABLE 2. Normalized Bone Volume.
| Animal | Proximal End |
Distal End |
||||||
|---|---|---|---|---|---|---|---|---|
| Weeks (post surgery) |
Weeks (post surgery) |
|||||||
| 3 | 5 | 10 | 13 | 3 | 5 | 10 | 13 | |
| 1 | 1.0 | 0.79 | 0.79 | 0.81 | 1.0 | 0.85 | 0.69 | 0.84 |
| 2 | 1.0 | 0.79 | 0.88 | 0.88 | 1.0 | 1.14 | 0.80 | 0.85 |
| 3 | 1.0 | 1.14 | 1.06 | 0.98 | 1.0 | 0.60 | 0.47 | 0.37 |
| 4 | 1.0 | 0.97 | 0.82 | 0.83 | 1.0 | 0.94 | 0.84 | 0.87 |
| 5 | 1.0 | 0.83 | 0.78 | 0.76 | 1.0 | 0.78 | 0.58 | 0.55 |
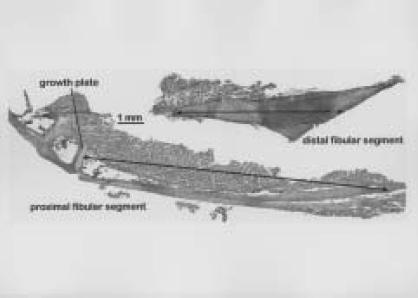
Independent validation of these micro-CT measurements was sought using conventional histological methods.Figure 6 shows decalcified tissue sections of both the proximal and distal fibular segments from animal number one. The nominal lengths of this animal's proximal and distal fibular segments were measured as 12.1 mm and 6.9 mm, respectively. These morphometric values are only ~2% different from the measurements of these same fibular segments made from the micro-CT images (Table 1). These histological images also revealed relatively normal-appearing cortical bone tissue in these fibular segments.
Figure 6.
Digital images of hematoxylin- and eosin-stained tissue sections of proximal and distal segments of fibula from animal number one. These sections were cut longitudinally along the mid-diathesis of the fibula. The nominal lengths of these bone segments are shown as black lines with double arrows.
DISCUSSION
We present in this study an animal model for evaluatingin vivo bone resorption longitudinally. Two aspects of this model illustrate its potential importance: first, as a means to study the process of bone loss under a situation of disrupted mechanical loading and second, to provide a potential in vivo model for evaluating the effectiveness of pharmacologic treatments to prevent or reverse bone loss. This bilateral osteotomy model is designed so each animal can serve as its own internal control for local treatment protocols (that is, left versus right side). Such a within-animal control yields a greater statistical power to observe changes due to treatment in experiments with a reduced number of animals, translating into a reduction in the expense and time for completion of an experiment, and an enhanced ability to identify small structural changes in an individual bone. Additionally, the results of this analysis appeared to correlate well with measurements made from two-dimensional histological sections.
In general, we observed that the proximal and distal bone segments decreased in cross-sectional area along the nominal length of the bone, while maintaining their overall length. This was true to the extent that the initial segments were longer than six millimeters in nominal length. The greatest amount of bone resorption was observed in the small distal segments of the fibula. This could be due to a decrease in mechanical stimulation at that site due to the disruption of normal weight-bearing load transmission over the length of the fibula caused by the osteotomy. Alternatively, this resorption of fibular bone mass may be affected by its connection to the tibia, as the distal part of the fibula fuses into the tibia. This connection of the two bones allows the sharing of common marrow tissue through the continuity of their medullary cavities, thereby permitting access of osteoclastic precursor cells from the tibia into the fibula.
Some of the problems we encountered during the in vivo imaging sessions included misalignment of the rotational stage, movement of the animal during an imaging session, and the beam-hardening artifacts observed in the region of the proximal fibula. The problem of a misalignment of the stage was addressed by using a method described by No et al.8 for automatically identifying the center-axis of rotation and reorienting this axis relative to the x-ray source and detector prior to data collection. More secure methods of fixing an animal's hind limbs to a rigid object such as the rotating stage platform are being investigated to limit the effects of even small motion artifacts. Finally, techniques for correcting the beam-hardening artifacts are currently being evaluated and will be implemented in the future.9,10
As previously reported by our group,5 each imaging session generated only a low dose of X-ray radiation to the lower hind limbs (0.64 Gy). Besides a low cumulative X-ray dosage, we observed that only some of the bone segments in some of the animals showed changes in bone length and volume. We believe that these findings are better explained by a disrupted mechanical loading pattern after a large osteotomy, rather than a cumulative X-ray irradiation effect.
ACKNOWLEDGMENTS
This study was supported by a grant from the Orthopaedic Research and Education Foundation (OREF) with funding provided by Orthofix Inc., and a grant from the Department of Defense.
References
- 1.Lane NE, Thompson JM, Haupt D, Kimmel DB, Modin G, Kinney JH. Acute changes in trabecular bone connectivity and osteoclast activity in ovariectomized rat in vivo . J Bone Miner Res. 1998;13:229–236. doi: 10.1359/jbmr.1998.13.2.229. [DOI] [PubMed] [Google Scholar]
- 2.Lane NE, Haupt D, Kimmel DB, Modin G, Kinney JH. Early estrogen replacement therapy reverses the rapid loss of trabecular bone volume and prevents further deterioration of connectivity in the rat. J Bone Miner Res. 1999;14:206–214. doi: 10.1359/jbmr.1999.14.2.206. [DOI] [PubMed] [Google Scholar]
- 3.Waarsing JH, Day JS, van der Linden JC, Ederveen AG, Spanjers C, De Clerk N, Sasov A, Verhaar JAN, Weinans H. Detecting and tracking local changes in the tibia of individual rats: a novel method to analyze longitudinal in vivo micro-CT data. Bone. 2004;34:163–169. doi: 10.1016/j.bone.2003.08.012. [DOI] [PubMed] [Google Scholar]
- 4.Petersson J, Johnell O. Electrical stimulation of osteogenesis in delayed union of the rabbit fibula. Arch Orthop Trauma Surg. 1983;101:247–250. doi: 10.1007/BF00379938. [DOI] [PubMed] [Google Scholar]
- 5.Latson L, Kuban B, Bryan J, Stredney D, Davros W, Midura RJ, Apte S, Powell KA. X-ray microcomputed tomography system: Novel application in bone imaging. Engineering, Medicine and Biology Society International Meeting.2003. Oct, [Google Scholar]
- 6.Grass M, Kohler TH, Proksa R. 3D cone-beam CT reconstruction for circular trajectories. Phys Med Biol. 2000;45:329–347. doi: 10.1088/0031-9155/45/2/306. [DOI] [PubMed] [Google Scholar]
- 7.Besl PJ, McKay ND. A method for registration of 3-D shapes. IEEE Trans Pattern Analysis and Machine Intelligence. 1992;14:239–256. [Google Scholar]
- 8.Noo F, Clackdoyle R, Mennessier C, White TA, Roney TJ. Analytical method based on identification of ellipse parameters for scanner calibration in conebeam tomography. Phys Med Biol. 2000;45:3489–3508. doi: 10.1088/0031-9155/45/11/327. [DOI] [PubMed] [Google Scholar]
- 9.Yan CH, Whalen RT, Beaupré GS, Yen SY, Napel S. Reconstruction algorithm for polychromatic CT imaging: Application to beam hardening correction. IEEE Trans on Medical Imaging. 2000;19:1–11. doi: 10.1109/42.832955. [DOI] [PubMed] [Google Scholar]
- 10.De Man B, Nuyts J, Dupont P, Marchal G, Suetens P. An iterative maximum-likelihood polychromatic algorithm for CT. IEEE Trans on Medical Imaging. 2001;20:999–1008. doi: 10.1109/42.959297. [DOI] [PubMed] [Google Scholar]


