


Abstract
Microarray experiments typically involve washing steps that remove hybridized nonspecific targets with the purpose of improving the signal-to-noise ratio. The quality of washing ultimately affects downstream analysis of the microarray and interpretation. The paucity of fundamental studies directed towards understanding the dissociation of mixed targets from microarrays makes the development of meaningful washing/dissociation protocols difficult. To fill the void, we examined activation energies and preexponential coefficients of 47 perfect match (PM) and double-mismatch (MM) duplex pairs to discover that there was no statistical difference between the kinetics of the PM and MM duplexes. Based on these findings, we evaluated the nonequilibrium thermal dissociation (NTD) approach, which has been used to identify specific microbial targets in mixed target samples. We found that the major premises for various washing protocols and the NTD approach might be seriously compromised because: (i) nonspecific duplexes do not always dissociate before specific ones, and (ii) the relationship between dissociation rates of the PM and MM duplexes depends on temperature and duplex sequence. Specifically for the NTD, we show that previously suggested use of reference curves, indices of curves and temperature ramps lead to erroneous conclusions.
INTRODUCTION
High-throughput technologies, such as DNA arrays, have significant potential for identifying organisms in many areas of biomedical science, including health care, biological defense and environmental monitoring. Several array platforms are currently used: synthetic membranes (1–3), glass planar (4–8), microfluidic station (9) and gel-pads on glass slides (10–12). All platforms share the common attribute that a sensor detects a signal from target sequences hybridized to immobilized oligonucleotide probes. The intensity of this signal provides a measure of the amount of bound nucleic acids in a sample, which depends on probe–target-binding affinities and the concentration of nucleic acid in solution. Hybridization occurs not only between specific [perfect match (PM)] probe–target pairs but also between nonspecific pairs containing mismatches. Therefore, the observed signal intensity from a single array spot might represent a combination of PM and nonspecific targets hybridized to the same probe (13). This situation seriously compromises the quality of data generated from array experiments, affecting microbial identification in complex mixtures.
The most commonly used method to eliminate or minimize nonspecific hybridization is to perform a stringent wash, i.e. rinse the array with low-salt buffer at constant temperature (isothermal wash). It is widely believed that once the isothermal wash has been performed, nonspecific duplexes are washed away and the observed signal is the ‘true’ signal of the specific (PM) duplexes.
An alternative method is to perform nonequilibrium thermal dissociation (NTD) directly on an array by increasing the temperature of a buffer solution at constant ionic strength (10,11,14). The foundation of this method lies on two assumptions. First, it is believed that nonspecific duplexes dissociate faster than specific duplexes and therefore, dissociation performed at increasing temperature facilitates the removal of nonspecific duplexes. Second, it has been suggested that a thermal nonequilibrium dissociation curve is unique to a given probe–target duplex and that one can identify the target in a mixture of targets by simple curve matching.
Although several studies have investigated the case when a single target dissociates from probes (15–18), neither method has been theoretically or empirically evaluated for the case when multiple targets dissociate from probes under nonequilibrium conditions.
This study focuses on the physicochemical evaluation of NTD of mixed targets hybridized to oligonucleotide DNA arrays. Our specific objectives were: (i) to determine the activation energies and preexponential coefficients of PM and mismatch (MM) duplexes, (ii) based on the existing kinetic measurements, to numerically simulate thermal dissociation methods for the case where specific and nonspecific targets bind to the same oligonucleotide probe on the same array spot, (iii) to provide experimental evidence supporting the physicochemical simulations and (iv) to consider potential practical solutions.
We show that, on average, there was no difference in the activation energies and preexponential coefficients of PM and the corresponding MM duplexes. Both simulation and experimental results showed that the application of NTD approach, without knowing the kinetic behavior of the duplexes, may lead to the erroneous interpretation of the signal intensity as related to the specificity of the probe–target binding. Moreover, we found that in terms of improving probe specificity, the NTD approach yielded similar results to those obtained by conventional isothermal wash, with the latter being easier to perform and less likely to be affected by temperature-dependent factors (e.g. dye temperature sensitivity, formation of gas bubbles). Lastly, in contrast to the NTD approach, isothermal wash can be analytically modeled, which is needed for the development of an analytical method.
MATERIALS AND METHODS
Oligonucleotide arrays
The 16S ribosomal RNA gene from Burkholderia xenovorans strain LB400 (Accession number U86373) was used to design 220 PM probes and 220 probes with double-base mismatches. The probes were synthesized in situ on microfluidic chips by Xeotron (Invitrogen, Carlsbad, CA). Briefly, the glass-silicon chip surface was first derivatized with an N-(3-triethoxysilylpropyl)-4-hydroxybutyramide linker (Gelest, Morrisville, PA) and then a spacer consisting of Ts and C18 spacers for an effective length of 12 bp was directly synthesized on the linker's hydroxyl group using the phosphoramidite chemistry. The oligonucleotides were synthesized on top of this spacer with an estimated density of 1 molecule per 200 Å2. Each oligonucleotide was replicated four times.
DNA and target preparation
A fragment of the 16S rRNA gene (1466 bp) was amplified from a pure culture of the B. xenovorans strain LB400. A mixture of unknown microbial targets (that did not contain B. xenovorans strain LB400) was obtained by amplifying rRNA genes from an anaerobic bioreactor. The purified PCR products were labeled using a BioPrime kit (Invitrogen, Carlsbad, CA) as previously described (9), and Cy3 or Cy5 dye was used as the fluorescent label, depending upon the experiment. Hybridization protocols and solutions used have been previously described (9).
Dissociation profiles, data acquisition and storage
To record a dissociation profile, a microarray was first hybridized with the labeled target at 20°C for 18 h. Then the microarray was washed and scanned. The PMT of the Cy3 channel was set to 400 for all experiments. The PMT of the Cy5 channel was set to 460 for the pure target and to 700 for all experiments involving bioreactor targets.
After scanning, the microarray was washed for 2.2 min (132 s) at 22°C and scanned again. Washing and scanning cycles were repeated up to 70°C. The following buffer was used to perform washing: 10 mM Na2HPO4, 5 mM EDTA and pH 6.6.
Hybridization signal intensities were extracted with GenePix 5.0 software (Axon Instruments, Union City, CA), yielding values between 0 and 65 535 arbitrary units (a.u.).
Microarray data generated by our experiments can be downloaded at http://staff.washington.edu/pozhit/default.htm.
Determination of activation energy and preexponential coefficient from experimental data
When a hybridized array is subjected to a wash, dissociation of the probe–target duplex can be expressed as:
| (1) |
where PT is the duplex, P is the probe and T is the target. This reaction follows first-order kinetics (exponential law) (19).
Hybridization signal intensity (I) with time (dt) at a given temperature can be described by the following first-order equation:
| (2) |
In the integrated form, Equation (2) can be written as:
| (3) |
where It is the intensity after the wash, Io is the intensity before the wash, k is the temperature-dependent dissociation rate constant and (t–to) the washing time. Hence, the dissociation rate constant for each probe–target duplex at each temperature can be obtained by calculating k at the corresponding temperature using the following equation:
| (4) |
The temperature dependence of k is expected to follow the Arrhenius equation:
| (5) |
where A is a preexponential coefficient, R is the universal gas constant (8.31 J · mol−1 · K−1), Ea, is the activation energy and T is the absolute temperature (K).
The preexponential coefficient of dissociation was determined by rewriting Equation (5) to:
| (6) |
and plotting the natural log of the dissociation constant Equation (4) versus reciprocal temperature (Figure S1). Fitting the best line (highest regression coefficient and most data points) was accomplished by manually adjusting the regression line through ln(k) values. The slope of the regression line approximates −Ea/R. The slope can be converted to Ea in kcal · mol−1 by multiplying the slope by R and dividing by 4184 J. The intercept of the line approximates natural logarithm of the preexponential coefficient.
Kinetic analysis and simulations
The concentration C, of any type of duplexes at time t, can be expressed as:
| (7) |
where Co is the initial concentration and k is the kinetic constant. The error E, at time t, is a function of the initial concentrations of MM and PM duplexes (i.e. Mo and Po) and their respective kinetic constants, kM and kP, and can be expressed as:
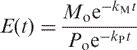 |
(8) |
The observed signal S, at time t, is a function of the concentrations of MM and PM duplexes [i.e. M(t) and P(t)] and can be expressed as:
| (9) |
Isothermal wash simulations
Substituting M(t) and P(t) with actual exponential functions Equation (7) and solving Equation (8) for exp(−t) results in the following dependency of signal upon the error rate:
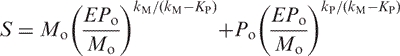 |
(10) |
The dissociation rate constant k can be substituted by Arrhenius equation [Equation (5)]. Due to the fact, that activation energy for the PM and MM duplexes are equal to one another (see ref. 19), the dependency of signal upon the error rate becomes:
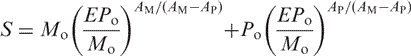 |
(11) |
where AM and AP are the preexponential coefficients of MM and PM duplexes, respectively.
Dissociation at continuously increasing temperatures
Gel-pad microarray protocol (20) involves recording of signal intensities at continuously increasing temperatures. A simplified kinetic simulation that ignores effects of the dye and diffusion is presented in this section. Because of the temperature dependency of the kinetic constant k, the NTD of the duplexes cannot be described according to Equation (7). To determine the time/temperature course of concentration, we needed to solve the following differential equation [Equation (12)]:
| (12) |
where A is a preexponential coefficient, C is the concentration of the duplex, R is the universal gas constant (8.31 J · mol−1 · K−1), Ea is the activation energy and T is the absolute temperature (K).
During a thermal dissociation experiment, temperature T is changed with time. We can relate temperature changes with time according to the function, T = f(t), or time in terms of temperature by a reciprocal function, t = f −1(T). For example, previously published works used linear increase of the temperature from 293 K (20°C) with 1°/min rate, therefore, T = 293 + t or t = T − 293.
Integrating Equation (12) and substituting time with f1(T) yields the following solution:
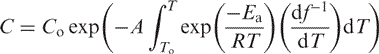 |
(13) |
with Co being the initial concentration of the duplex.
To simplify the mathematical expressions, let us introduce a proxy for the integral in Equation (13):
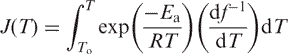 |
(14) |
Substituting M(t) and P(t) with actual exponential functions Equation (13) and solving Equation (8) for the exp[−J(t)] yields Equation (11). Hence, the equations describing the dependence of signal upon the error rate are identical for isothermal wash and dissociation performed at continuously increasing temperatures (NTD, 20).
All calculations were performed in Mathcad (Mathsoft Engineering & Education, Inc., USA) environment (21). Input values for the simulations were obtained from Ikuta et al. (19).
Comparison of measured dissociation rates for PM and MM duplexes
Dissociation rates for PM and MM duplexes were compared by determining the temperature at which the rates of dissociation for PM and MM duplexes are equal and determining the relative slope of the hyperbolic function. This was accomplished by using Equation (6) and examining the ratio of the natural logarithm of kPM and kMM, i.e. ln(kPM/kMM). When the ratio is less than zero, then the PM duplex is dissociating slower than the MM duplex, whereas when the ratio is greater than zero, the opposite occurs. The natural logarithm of the ratio ln(kPM/kMM) can be rewritten as:
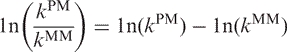 |
(15) |
Substituting ln(k) from Equation (6) to Equation (15) yields the following function:
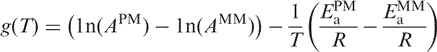 |
(16) |
The function g(T) is a hyperbola intersecting the T axis at the following temperature:
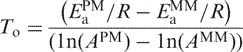 |
(17) |
At temperature To, the rates of dissociation for PM and MM duplexes are equal. The value of the hyperbolic function provides information on whether the PM duplex is dissociating faster or slower than the MM duplex. If the function has a positive value then the PM is dissociating faster than the MM duplex, whereas a negative value indicates that the MM is dissociating faster than the PM duplex.
Calculation of Td
The background signal was subtracted from all signal intensity (SI) values on an array. Thermal dissociations that had initial SI values of 200 a.u. (at 20°C) were not evaluated because they approached the detection limits of the system. The slope (m), intercept (b) and Pearson product-moment correlation of the dissociation were calculated between 28 and 56°C, and the 50% dissociation temperature was determined using the equation: x = (y − b)/m, where x is the desired temperature and y is the corresponding normalized signal intensity of 0.50.
Statistical analysis
Pearson product-moment correlation was used to determine the degree of association between variables. Linear regressions were used to estimate the relationship of one variable to another (22). Principal-component analysis was employed to examine the distribution of duplex characteristics relative to derived kinetic variables and to construct ordination plots. An artificial neural network (ANN) package (Neuroet, 23) was used to investigate the nonlinear relationships among input variables (i.e. duplex characteristics) and outputs (i.e. derived kinetic variables). Student t-tests and histograms were tabulated in MS Excel 2004 (Microsoft, Inc., Redmond, WA) using Macintosh OS X.
RESULTS
Simulation of specific and nonspecific duplex kinetics
This section considers the case when two targets (specific and nonspecific) dissociate from the same probe. For clarity, our simulations assumed that, before dissociation, equal amounts of specific and nonspecific duplexes are formed on the same array spot (i.e. the same probe). As we shall see in the experimental results (below), this assumption was supported since the amount of the nonspecific duplex can be actually higher than the specific duplex, especially when the specific target is at a low concentration. Furthermore, any other amounts of PM and MM duplexes can be put into the equations of this study. The reason we chose very simplified simulations of the dissociation of two targets was because simulations involving multiple targets would be very difficult to interpret. We emphasize that in a sample containing a mixture of targets at different concentrations, such as the bioreactor sample used in this study, it was difficult to determine the contribution of PM duplexes to the observed signal because: (i) their concentration and binding affinities relative to those of nonspecific duplexes are not known, and (ii) nonspecific duplexes greatly outnumber the specific ones in mixed target samples.
Table 1 shows the relationship between two different types of mismatches. PM and MM targets are assumed to hybridize to the same oligonucleotide probe within the same array spot. Note that the activation energies are identical but the preexponential coefficients are different.
Table 1.
Activation energy and preexponential coefficient for two sets of perfect match–mismatch duplexes
| Case | Duplexes | Activation energy (kcal/mol)a | Preexponential coefficient (A × 10−33 min−1)a |
|---|---|---|---|
| Perfect match and mismatch #1 | CTCCTGAGGAGAAGTCTGC | 52 | 9.0 |
| GAGGACTCCTCTTCAGACG | |||
| CTCCTGaGGAGAAGTCTGC | 52 | 18.1 | |
| GAGGACACCTCTTCAGACG | |||
| Perfect match and mismatch #2 | CTCCTGTGGAGAAGTCTGC | 52 | 9.0 |
| GAGGACACCTCTTCAGACG | |||
| CTCCTGgGGAGAAGTCTGC | 52 | 12.6 | |
| GAGGACTCCTCTTCAGACG |
aTaken from Ikuta et al. (19).
We used the kinetic data from Table 1, which was originally generated by Ikuta et al. (19), to produce dissociation curves that change with temperature and time. Figure 1A and B shows the additive contribution of PM and MM duplexes to the observed signal intensity as they change with temperature, and Figure 1E shows the performance plots corresponding to the relationship between the observed signal intensity and percent error in that signal. At high signal intensity (i.e. high sensitivity), specificity was poor because of the significant contribution of the MM duplex to the observed signal. At low signal intensity (i.e. low sensitivity), the probe was highly specific to the target because most of the nonspecific duplex was washed away. In general, error in the observed signal was highest at the beginning of the dissociation and lowest at the end (Figure 1E). Note that the PM duplex never attains error-free signal intensities but the duplex approaches a ‘clean’ signal (∼20%) when most of the duplex has been washed away.
Figure 1.

Dissociation kinetics of perfect match (green) and mismatch (red) duplexes within the same array spot with temperature (A and B) and time (C and D). The black curves represent total concentration (approximates the observed signal intensity), which is a sum of the concentrations of PM and MM duplexes. (A and C) correspond to PM duplex (5′-GAGGACTCCTCTTCA-3′) and the MM (A:A) duplex, whereas (B and D) correspond to PM duplex (5′-GAGGACACCTCTTCAGACG-3′) and the MM (G:T) duplex. (E and F) are the performance curves (blue) representing the total concentration of the spot (approximates the observed signal intensity) as a function of error for (A and C), and (B and D), respectively.
Similar findings were obtained for dissociation curves generated when the time course, rather than the temperature course, was considered (Figure 1C). Like Figure 1A and B, dissociation rates varied depending on the duplex, with some MM duplexes having higher dissociation rates (Figure 1C) than others (Figure 1D). The performance plots for Figure 1A and C of the same duplexes are identical (i.e. only one set is shown, in Figure 1E), which was not surprising since both depend on Equation (11). Identical performance plots (e.g. Figure 1F) were also obtained for Figure 1B and D. According to Equation (11), the initial concentrations and preexponential coefficients of the PM and MM duplexes are the only factors affecting the observed signal intensity.
These simulations suggest that as time increases, trade-offs occur between sensitivity (i.e. observed signal intensity) and specificity (i.e. the portion of false signal in the observed intensity value). As the observed signal intensity decreases, it becomes decreasingly deviant from the actual signal intensity of the PM duplex. These findings clearly demonstrate that (i) it is the difference in dissociation kinetics of the duplexes that determines the error associated with the observed signal intensity, and (ii) time, not temperature, determines the error in the observed signal.
Measured activation energies and preexponential coefficients
Given our new understanding of isothermal and thermal nonequilibrium dissociations, we needed to determine if our simulation results are consistent with results obtained from a larger set of experimental data. To this end, we collected 440 thermal dissociation profiles; half of them (n = 220) were PM duplexes, and the remainder, duplexes with double-base-pair MMs. The MM duplexes tended to have lower initial signal intensities (20°C) than PM duplexes because they have lower binding affinities (Figure 2). Those MM duplexes that yielded inconsistent (noisy) kinetic data, because their intensity values approached the detection limits of the system, were excluded from dissociation calculations in order to provide confident estimation of the kinetic data (see Materials and methods section). The final data set consisted of 47 duplex pairs.
Figure 2.

Frequency distribution of initial signal intensity values (20°C) for PM (white boxes) and MM (black boxes) duplexes (n = 220 duplex pairs). MM duplexes disproportionably have lower intensity values than PM duplexes.
The difference in the activation energies of PM and the corresponding MM duplexes followed a normal Gaussian distribution (Figure 3) and paired Student t-tests (a = 0.05) revealed no significant difference in activation energies of PM duplexes and their corresponding MM duplexes. These findings suggest that the differences in activation energies are dependent on the duplex pair. For example, the activation energies of some duplex pairs, such as PM duplex LB62 and its corresponding MM duplex, differed by only 0.4 kcal · mol−1 whereas other duplex pairs, such as PM duplex LB58 and its corresponding MM duplex, differed by 14.1 kcal · mol−1. Further examination of the activation energies of PM and MM duplexes revealed that some PM duplexes had lower activation energies than their corresponding MM duplexes (i.e. 21 out of 47 pairs), while the opposite was true for the remaining duplexes (i.e. PM duplexes had higher activation energies than their corresponding MM duplexes).
Figure 3.

Frequency distribution of the difference in activation energy values for PM and MM duplexes (n = 47 duplex pairs). Two-tailed Student t-test showed no significant differences in activation energy values of PM and the corresponding MM duplexes (a = 0.05).
Comparison of preexponential coefficients (A) of PM and MM duplex pairs yielded similar findings to those obtained with activation energies. That is, paired Student t-tests (a = 0.05) revealed no significant difference in ln(A) values for PM duplexes and their corresponding MM duplexes. The differences were found for different duplex pairs, with LB31 PM and its MM having the lowest difference (0.8 a.u. s−1), and LB58 PM and its MM having the biggest difference (23.3 a.u. s−1). Similar to activation energy results, the preexponential coefficient of PM duplexes was higher than that of their corresponding MM duplexes for 21 (out of the 47) pairs, while the opposite was true for the remaining 26 pairs.
We compared the frequency distribution of the Ea and ln(A) for the PM and MM duplexes (Figure S2) and the characteristics of the duplex pairs (e.g. GC content, number of consecutive G or C nucleotides or purine/pyrimidine mismatches) of PM and MM duplexes to examine any potential patterns in the data. Histograms and unpaired Student t-tests of activation energies and preexponential coefficients by duplex-type revealed no obvious patterns or statistically significant differences. Principal component and neural network analyses also did not reveal any obvious set of factors accounting for subtle differences in activation energies and preexponential coefficients (data not shown).
One can conclude from the results of the simulations and those from the experimental data that the premise that nonspecific duplexes dissociate faster than specific duplexes was not supported. Moreover, unless one knows the kinetic properties of a specific probe, one cannot assume that the dissociation curves provide any indication that a target was specific to a probe—its signal could be just as likely due to nonspecific targets.
Given that the activation energies and preexponential coefficients are similar between PM and the corresponding MM duplexes, what makes dissociation curves different among probe pairs? To address this question, we examined the relationship between activation energy and preexponential coefficients as it changed with temperature for different probe pairs to determine when PM duplex dissociates faster than the MM duplex and vice versa. The ratio of the kinetic constants for the PM and MM duplexes follows a hyperbolic function.
Within the range of temperatures of our experiments, the hyperbolic function occurred in five forms (see examples in Figure 4). For 9 of 47 probe pairs (Figure 4A), the rate of dissociation of the PM duplex was always slower than the MM duplex, with the difference in dissociation rates decreasing with temperature. For 20 probe pairs (Figure 4B), the PM duplex dissociated slower than the MM duplex, and the difference between the rates increased with increasing temperature. For 10 probe pairs (Figure 4C), the PM duplex initially dissociated slower than that of the MM duplex (see Figure 5A, C and E), then its rate approached that of the MM duplex. For six probe pairs (Figure 4D), the PM duplex initially dissociated with almost the same rate as that of the MM duplex, and then the MM duplex dissociated faster than the PM duplex (see Figure 5B, D and F). For only one probe pair out of the 47 pairs examined (Figure 4E), the PM duplex was always faster than the MM duplex and the difference between rates of dissociation increased with temperature.
Figure 4.

Ratio of dissociation rates for PM and MM duplex pairs by hyperbolic intercept. Five forms occurring in our data set (n = 42 duplex pairs) are shown. The hyperbolic intercept on the x-axis represents the temperature at which PM and MM duplex are dissociating at the same rate. The dashed portion of the hyperbolic function indicates data that might be affected by noise. Note that in (A) (LB85 duplex pair; PM, 5′-CCAGCTTCACGCACCCGAGT-3′; MM, 5′-CCAGCTGCACGCAACCGAGT-3′), (B) (LB195 duplex pair; PM, 5′-ATCTGCCATCGGCCGCCCCT-3′; MM, 5′-ATCTGCAATCGGCAGCCCCT-3′) and (E) (LB106 duplex pair; PM, 5′-TCATCCCCACCTTCCTCCGG-3′; MM, 5′-TCATCCACACCTTACTCCGG-3′), the hyperbolic function never crosses the x-axis, whereas the x-axis crosses at 43°C in (C) (LB173 duplex pair; PM, 5′-GCCTTTACCCCACCAACCAG-3′; MM, 5′-GCCTTTCCCCCACAAACCAG-3′) and ∼20°C in (D) (LB138 duplex pair; PM, 5′-CGGTACCGTCATCCCCCCAC-3′; MM, 5′-CGGTACAGTCATCACCCCAC-3′) (see text for discussion).
Figure 5.

Determination of the temperature where the ratio of Ln (K) and Ea for PM (open circles) and MM (closed circles) duplexes are equal. Panels A, C and E, LB173 (5′-GCCTTTACCCCACCAACCAG-3′) and LB173-MM (5′-GCCTTTCCCCCACAAACCAG-3′), panels B, D and F, LB138 (5′-CGGTACCGTCATCCCCCCAC-3′) and LB138-MM (5′-CGGTACAGTCATCACCCCAC-3′) duplexes. Panels A and B, raw intensity values; Panels C and D, normalized intensity values; and Panels E and F, dissociation of PM and MM duplexes. PM and MM duplexes have the same ratio at 43°C for LB173 duplexes and 21°C for LB138 duplexes. Shaded areas indicate intensity values that might be affected by noise at the beginning of the dissociation process or at the limits of the detection system.
From these results, one can conclude that the dissociation kinetics of various PM and MM duplex pairs depend upon the interplay of activation energies and preexponential coefficients as it changes with temperature. These findings further support the notion that one has to know the exact kinetic parameters of specific duplexes before deciding on the ‘optimal’ temperature for isothermal dissociation in order to minimize the effects of nonspecific signal contributing to the observed signal.
Analysis of mixed targets
While the previous section dealt with dissociations of PM–MM duplex pairs, this section deals with the dissociations of specific and nonspecific duplexes within a mixture of targets having unknown diversity and abundance. This was accomplished by first simulating the effects of different compositions of specific and nonspecific targets attached to the same probe, and then determining if the results obtained from the simulation are consistent with those obtained by experimentation.
Nonspecific target dissociation
Our simulation on the effects of different compositions of specific and nonspecific targets attached to the same probe (Figure 6) revealed that decreasing proportions of a specific target and increasing proportions of nonspecific targets in a sample should shift the observed thermal dissociation curves to the left. Observation of the signal from the bioreactor targets (Figure 7) revealed that the dissociation curves are different from the curves obtained from the pure labeled B. xenovorans target (Figure 8). Based on signal intensity measurements of pure Cy3-labeled B. xenovorans strain LB400 (200 pmol) hybridized to the microarray, the value of the signal intensities (Figure 7A) was much higher than expected for 1% of the specific target (B. xenovorans target). We calculated the intensity of the specific signal present in the mixtures at 2, 0.2 and 0.02 pmol. These findings indicate that if the B. xenovorans target was present at 1% or less concentration together with the bioreactor targets, the dissociation curves would more resemble those obtained from targets in the bioreactor than the ‘reference’ B. xenovorans curve, which agrees with simulations.
Figure 6.

Simulated thermal dissociation curves composed of different proportions of specific (perfect match) and nonspecific (mismatch) duplexes hybridized to the same probe. Percent composition of specific to nonspecific duplexes (left to right): 0:100, 20:80, 50:50, 80:20, 100:0.
Figure 7.

Nonequilibrium thermal dissociations of duplexes associated with probe LB100 that was mixed with targets extracted from an anaerobic bioreactor sample. Top panel, raw signal intensity (SI) values; lower panel, normalized signal intensity values, SI norm = (SIraw − SImin)/(SImax − SImin); Dashed black line, 1% specific target (not labeled with Cy3) plus 99% bioreactor target (Cy3-labeled); gray line, 0.1% specific target (not labeled with Cy3) plus 99.9% bioreactor target (Cy3-labeled); gray dashed line, 0.01% specific target (not labeled with Cy3) plus 99.99% bioreactor target (Cy3-labeled).
Figure 8.

Normalized distributions of the difference in dissociation temperatures (Td 50) for mixtures containing varying proportions of labeled unknown targets. For each probe, the difference in Td was calculated by subtracting the Td of a mixture of targets from the Td of Cy3-labeled reference target B. xenovorans. The proportion of labeled mixed unknown targets was 99% (black bar) 99.9% (white bar), 99.99% (gray bar) and 99.999% (hatched bar), the remainder was made up by unlabeled target B. xenovorans. Each distribution was normalized to the total number of samples yielding dissociation curves (i.e. those having initial SIs of >200 a.u.). The Tds were calculated from the nonequilibrium dissociation curve of the Cy3-labeled reference target and the curves of Cy3-labeled unknown mixed targets. One-tailed Student t-test revealed that the mean shift in difference was significant for the 99% mixed target and the 99.9% and 99.99% targets (both P < 0.0001) but there was no difference between the 99% mixed targets and the 99.999% target.
To determine if these results were consistent for multiple probes, we determined the amount of shift of the dissociation curve for the same bioreactor targets by comparing the difference in Td of different probes to that of the reference target. On average, a 99, 99.9, 99.99 and 99.999% difference in abundance of the bioreactor targets resulted in a shift of the Td by 1.5 ± 1.6°C (n = 207), 2.8 ± 1.9°C (n = 130), 3.8 ± 2.9°C (n = 26) and 1.7 ± 2.5°C (n = 73), respectively (Figure 8). This figure shows that, with the exception of 99.999% difference in abundance of the bioreactor targets, the distributions of the histogram shift to the right (which means a shift to the left of the dissociation curves) with increasing proportions of nonspecific target, which implies that bioreactor targets are cross-hybridizing to the probes on the array. Also note that the variability (i.e. standard deviation) about the mean Td increased with abundance of the bioreactor targets.
Specific target dissociation
The previous section dealt with dissociations of nonspecific targets attached to oligonucleotide probes. This section examines the dissociation of Cy5-labeled specific targets occurring in different abundances, which was not covered in our simulation studies.
Decreasing proportion of specific target in a mixture of unknown targets shifted the dissociation curves to the left of the reference curve (Figure 9). We investigated this phenomenon for multiple dissociations of specific targets. Figure 10 shows a consistent shift in the distribution of Td to the right of the histogram with decreasing concentrations of specific target, which was consistent with the results shown in Figure 9. A 1.0, 0.1 and 0.01% abundance of specific target in a mixture of targets shifted the mean Td by 1.6 ± 1.3°C (n = 267), 1.8 ± 1.3°C (n = 206) and 2.4 ± 1.4°C (n = 177), respectively. One could speculate that the reason for the shift in the Td was because nonspecific duplexes are interacting with probes on the same spot. Alternatively, bleed-over from the Cy3 signal affected the Cy5 signal or vice versa, although simple bleed-over would indicate identical shapes of the curves in Cy3 and Cy5 channels, which we did not observe.
Figure 9.

Nonequilibrium thermal dissociations of duplexes associated with probe LB100, which was hybridized to mixed targets extracted from an anaerobic bioreactor sample. Top panel, raw signal intensity (SI) values; lower panel, normalized intensity values, SInorm = (SIraw − SImin)/(SImax − SImin); Black line, 100% specific target B. xenovorans (Cy5-labeled reference); dashed black line, 1% specific target (Cy5-labeled) mixed with 99% bioreactor target (not labeled with Cy5); gray dashed line, 0.1% specific target (Cy5-labeled) mixed with 99.9% bioreactor target (not labeled with Cy5); gray line, 0.01% specific target (Cy5 labeled) mixed with 99.99% bioreactor target (not labeled with Cy5). For this probe, decreasing abundance of labeled target in the mixtures reduced initial SIs and shifted dissociation curves to the left.
Figure 10.

Normalized distributions of the difference in dissociation temperatures (Td 50) of Cy5-labeled specific target in mixtures of unlabeled and unknown targets. For each probe, the difference in Td was calculated by subtracting the Td of the specific Cy5-labeled target in a mixture of targets from the Td of Cy5-labeled specific reference target B. xenovorans. Three proportions of mixtures were used: 1% (black bars), 0.1% (white bars) and 0.01% (gray bars) of Cy5-labeled specific target B. xenovorans, with the remainder of the sample composed of unknown and unlabeled targets from an anaerobic bioreactor. On average, decreasing the proportion of Cy5-labeled target in the mixture significantly shifted nonequilibrium curves to the left of the reference curve as shown in Figure 9. One-tailed Student t-test revealed that the mean shift in difference was not significant for the 1% mixed target and the 0.1% target, although it was significant for the 1% mixed target and the 0.01% mixed target (P < 0.0001).
DISCUSSION
An understanding of the fundamentals of nucleic acid dissociation is necessary to provide a framework for improving discrimination of specific and nonspecific targets. One of the main premises of existing wash procedures is that nonspecific targets will be washed away before specific targets, and many studies have tried to improve the specificity by using various buffers (24), salt concentrations (24–26), wash temperatures (14), wash times (27) and chemicals (e.g. formamide, 20). Our goal was to conduct a kinetic analysis that provides a foundation for future studies.
Concurrently, the NTD has been suggested to provide an additional benefit for determining the specificity of targets (discussed below). For this reason, we wanted to determine what happens when specific and nonspecific targets dissociate with increasing temperature.
Standard washing protocols
One of the first studies to investigate the kinetic properties of oligonucleotide probes was Ikuta et al. (19), who found that nonspecific targets (i.e. duplexes with single internal mismatches) dissociate faster than specific targets (i.e. PM duplexes). For our experiments, double-base-pair internal MM probes were used rather than single-base-pair internal MM probes because discriminating a single internal MM can be challenging (12), and a double-base-pair MM would provide better resolution than a single-base-pair MM.
Our results were consistent with Ikuta et al. (19) in that we found, on average, activation energies of PM and MM duplex pairs are about the same. Ikuta also found (as we did) that preexponential coefficients differed between duplex pairs (Table 1); however, our study showed that, on average, the preexponential coefficients of duplex pairs are almost the same. Before conducting our laboratory experiments, we hypothesized that preexponential coefficients were responsible for differences in dissociation curves based on Ikuta et al. (19) findings. But, this was not the case. Rather, it is the interplay among activation energies, preexponential coefficients and temperature that is responsible for the observed differences in the dissociations of duplex pairs. This finding has important ramifications for existing microarray washing protocols because: (i) one can no longer believe that the nonspecific duplexes will always dissociate faster than specific duplexes (i.e. one cannot simply wash the nonspecific duplexes away in all cases), and (ii) increasing the temperature of dissociation does not always mean that the nonspecific duplexes will be better removed (i.e. quite the opposite is true since increased temperature might preferentially remove specific duplexes).
Nonequilibrium thermal dissociation
Confusion in the literature
There is much confusion in the microbiology literature with respect to the idea that increasing (i.e. ramping) the temperature during dissociation improves specificity (e.g. 14,20,24,25,28,29). Specifically, nonequilibrium dissociation curves are sometimes referred to as ‘melting curves’, while in reality the ‘melting curves’ only refer to the equilibrium dissociation of nucleic acid duplexes in solution. Although improved specificity might be true for the dissociation of single targets (particularly under equilibrium conditions), this was not the case for mixtures of targets under nonequilibrium conditions, as shown by our study. One source of confusion might be the visible similarity of equilibrium dissociation curves in solution (30,31) to nonequilibrium dissociation curves, since both are sigmoid-shaped, but follow fundamentally different physical laws. Another source might be due to image acquisition software and processing errors, which have been shown to grossly distort signal intensity values, leading to misinterpretation of array data (10,32,33). Previously published literature does not provide any physicochemical proof that the NTD approach can be effectively used to distinguish between specific and nonspecific hybridizations for mixtures of targets. Yet, the approach has been widely used. Below, we briefly summarize the historical record of the studies that brought about the nonequilibrium dissociation approach into being.
The historical record
The Khrapko et al. (34) study was one of the first to use the NTD approach to monitor the duplex stability of PM duplexes and duplexes containing an internal MM for a single target. These dissociations were classified as ‘nonequilibrium’ because the dissociated strand does not reach equilibrium with the immobilized strand; it was washed away. Khrapko et al. (34) reasoned that if an unknown target had a thermal dissociation curve that was more similar to that of a PM duplex than a MM duplex, one could conclude that the unknown target was specific to the PM probe. Hence, the dissociation curve of the MM duplex serves as a control for nonspecific hybridization of a single target—but not for mixtures of targets as we showed in this study.
Raskin et al. (2) were the first to use NTD as a way to quantify individual rRNA gene targets immobilized on synthetic membrane arrays. Thermal dissociation curves were generated by measuring the amount of labeled probe retained on a membrane or by the amount of labeled probe washed off. The nonequilibrium dissociation curves were then used to determine the optimal washing temperature for DNA arrays. Their study was based on the premise that probes hybridized to nonspecific (i.e. MM) targets should have much lower duplex stabilities than those hybridized to specific (i.e. PM) targets. Therefore, according to Raskin et al. (2), increased stringency, in terms of temperature and/or time, washes off probes hybridized to MM targets well before those hybridized to PM targets.
Since then, NTD has been implemented by several independent research groups on four different array platforms (i.e. gel-pad, glass planar, microfluidic and synthetic membrane) (1,9–12,14,20,24,25,28,29,35–40). In some of these studies (12,28,35,36), dissociation curves of samples containing unknown targets were compared to those of reference targets, which is similar to the idea first proposed by Khrapko et al. (34). Several indices have been developed to characterize NTDs. Four indices have been used for discriminating specific from nonspecific hybridization of duplexes on an array, and/or for determining the optimal wash temperature. For example, the difference in dissociation temperatures (Tds) between a PM duplex and a similar duplex containing an internal MM was measured in several studies (3,14,20,24,38). The Td is defined, in these studies, as the temperature at which a portion (e.g. 50%) of the starting duplex remained intact as inferred by signal intensity or radioactivity. Another measured index is the discriminating index (DImax), which is defined as the temperature at which the signal intensity ratio between a PM and a MM duplex is maximized (14). The DImax is considered to be the optimal temperature for discriminating specific from nonspecific targets (24). A third index considers the temperature at the maximum dissociation rate constant (Td-w), and is defined as the temperature when the Arrhenius equation no longer holds (i.e. due to signal loss) (9). A fourth index is called the maximum difference when the 95% confidence bands of two average normalized curves do not overlap (MAXDCSD, 36).
New perspective
Given the extensive amount of previous work (cited above) and our newfound knowledge, we asked ourselves the following question: Should reference curves and indices be used for classifying unknown targets in mixed samples?
The Khrapko et al. (34) study was based on the thermal dissociation of one target that was hybridized to a set of PM and MM probes. Although they mentioned that reference dissociation curves of PM duplexes could be used to define the occurrence of a hybridization event, they never considered the case of multiple unknown targets hybridized to one probe. Yet, the nonequilibrium dissociation approach, inspired by the above-mentioned study (34), has been used to evaluate mixed samples where multiple targets were hybridized to an array (e.g. 1,3,11,12,28,35–37,39,40). Currently, there is no evidence supporting the extrapolation of Khrapko et al. (34) findings to the situation involving multiple targets hybridized to the same probe, which would normally occur for environmental samples, as shown in Figures 7 and 8).
Apparently, the observed dissociation curve is a superposition of dissociation curves produced by all duplexes on the same array spot (see Figure S1 and Figure 7). Depending on the relative abundances of specific and nonspecific duplexes and their physicochemical properties, the observed curve can assume any sigmoid form between specific and nonspecific ones (Figure 6). For example, if half of the duplexes are PM and the remainder is mismatched, the curve would fall between two ‘reference’ curves, that of the PM curve and that of the MM with the lowest binding constant. Therefore, the idea of using indices to characterize curves (e.g. Td, DImax, Td-w, MAXDCSD), or prerecorded dissociation curves as references for specific and nonspecific hybridizations, is not appropriate.
A recent study by Siripong et al. (35) showed that when an environmental sample was analyzed without PCR amplification of targets, the dissociation curve assumed a certain shape, indicating that the target occurred at a low concentration or was not detectable in the sample. However, when the target was PCR amplified (and its concentration increased), the curve assumed a different shape suggesting that the target was present. Clearly these differences are due to the abundances of specific and nonspecific duplexes, which alter the shape of the curve. We did not perform quantitative analysis of the curves published by Siripong et al. (35), since we have previously shown that the image processing algorithm used in their study significantly alters the signal intensities (10,32,33), making it impossible to analyze the chemical kinetics.
Lastly, matching curves (i.e. an unknown and a reference curve), or similar indices, do not indicate that the target is specific (as was done in refs. 12 and 28). Matching curves may result from either a specific duplex or an unknown combination of specific and nonspecific duplexes depending on their concentrations. Hence, in answer to the question posited, reference curves or indices should not be used as standards for classifying dissociations.
Second, within the framework of the new perspective, we wanted to address the following question: Does the temperature ramp improve or worsen the discrimination of specific and nonspecific duplexes?
The Ikuta et al. (19) study lead us to conclude that if the activation energies for PM and MM duplexes are the same, then the temperature (or temperature ramp) should not play any role in improving or impeding the discrimination of specific and nonspecific duplexes. However, the data generated by our study indicated that the relationship between the rates of dissociation for specific and nonspecific duplexes was temperature dependent. Consider, for example, duplex pairs whose relationship between dissociation rates inversed with increasing temperature. Targets hybridized to PM probes initially dissociated slower than those hybridized to MM probes. A subtle increase in temperature resulted in the dissociation rates of targets hybridized to the PM and MM probes to be similar. A further increase in temperature resulted in the reversal of the dissociation rates: PM duplexes dissociated faster than MM duplexes. Since 20% of the probe pairs (10 probe pairs out of 47, Figure 4C) fall into this category, this presents a problem to the NTD approach since increasing the temperature beyond the point where the PM and MM duplexes are dissociating at the same rate actually reduces specificity rather then improving it.
It is important to recognize that increasing the temperature and recording the signal intensity of duplexes on an array have additional problems that do not occur for an isothermal wash. For example, in a very simplified scenario (ignoring technical problems; 10,33), the NTD curves of mixed targets cannot be modeled in terms of an analytical function, which is essential for establishing a method. The technical issues further cloud our ability to interpret array results. For example, increasing the temperature facilitates the formation of gas bubbles in solution and also deforms the observation chamber, distorting the array image (10). Fluorescent dyes can also show thermal sensitivity, skewing the data (41). These overlapping effects seriously compromise the quality of data obtained from DNA arrays and beg the question, why use thermal dissociation when there is no obvious advantage over an isothermal wash? For this reason, we advocate the use of isothermal wash for future array experiments, which can be analytically modeled.
Potential practical solutions
The theoretical and experimental evaluation of the NTD approach recommend against using reference dissociation curves or ‘melting’ temperatures as criteria for identification of targets in mixed samples because, as it was shown above, it will likely lead to false-positive and false-negative calls. Hence, we now consider potential practical solutions.
It is possible that the isothermal wash approach can provide useful information for improving probe specificity. There is a situation familiar to engineering and technology sciences where several exponential processes contribute to the total observed signal (e.g. radioactive decay in a mixture of several radionuclides) can be expressed as:
| (18) |
where Coi are the initial concentrations of the duplexes and ki the dissociation constants. An established approach to solve this problem is to examine the relationship between the natural logarithm of signal intensity, ln S(t), as it changes with increasing time, t. This approach is discussed in detail in Piotrowski et al. (42), and is currently the focus of our ongoing research.
Another new approach that is not sensitive to washing protocols is being developed in our laboratory. The approach involves recording microarray signal intensity fingerprints for each target being identified, while the microarray hybridization pattern of a target mixture is quantitatively interpreted in terms of the individual fingerprints (6).
CONCLUSION
In summary, washing is an essential part of any microarray experiment because the quality of washing determines the signal-to-noise ratio, which ultimately affects downstream analysis and conclusions. The current literature lacks fundamental studies directed at understanding the dissociation of surface-tethered nucleic acids. The paucity of the studies has lead to washing procedures (e.g. NTD) that are not based on a firm understanding of dissociation kinetics. Our study discovered a serious problem with the widely accepted concept that nonspecific targets dissociate before specific targets, which warranted a critical revision of the washing and NTD approaches. The key findings are: (i) nonspecific duplexes do not always dissociate before specific ones, (ii) the relationship between dissociation rates of a PM and MM duplex pair depends upon the particular duplex and temperature and (iii) reference curves, indices of curves and temperature ramps during NTD lead to misidentification of targets.
SUPPLEMENTARY DATA
Supplementary Data are available at NAR Online.
ACKNOWLEDGEMENT
We thank Sergey Stolyar, Suvi Flagan and Kyle D. Bailey for their critical comments on earlier versions of the manuscript. We thank Eugene Pozhitkov for his helpful discussions on physics. This research was supported in part by a grant from the US National Oceanic and Atmospheric Administration (NAO3NOS4260216), National Institutes of Health (Grant R01 RR018625-03), and by grants 1U01DE014955-01 from NIH/NIDCR and R-82945801 from EPA-CEER-GOM to P.A.N. Funding to pay the Open Access publication charge was provided by NIH/NIDCR.
Conflict of interest statement. None declared.
REFERENCES
- 1.McMahon KD, Stahl DA, Raskin L. A comparison of the use of in vitro-transcribed and native rRNA for the quantification of microorganisms in the environment. Microbiol. Ecol. 1998;36:362–371. doi: 10.1007/s002489900122. [DOI] [PubMed] [Google Scholar]
- 2.Raskin L, Stromley JM, Rittman BE, Stahl DA. Group-specific 16S rRNA hybridization probes to describe natural communities of methanogens. Appl. Environ. Microbiol. 1994;60:1232–1240. doi: 10.1128/aem.60.4.1232-1240.1994. [DOI] [PMC free article] [PubMed] [Google Scholar]
- 3.Zheng D, Alm EW, Stahl DA, Raskin L. Characterization of universal small-unit rRNA hybridization probes for quantitative molecular ecology studies. Appl. Environ. Microbiol. 1996;62:4504–4513. doi: 10.1128/aem.62.12.4504-4513.1996. [DOI] [PMC free article] [PubMed] [Google Scholar]
- 4.DeSantis TZ, Stone CE, Murray SR, Moberg JP, Andersen GL. Rapid quantification and taxonomic classification of environmental DNA from both prokaryotic and eukaryotic origins using a microarray. FEMS Microbiol. Lett. 2005;245:271–278. doi: 10.1016/j.femsle.2005.03.016. [DOI] [PubMed] [Google Scholar]
- 5.Wilson WJ, Strout CL, DeSantis TZ, Stilwell JL, Carrano AV, Andersen GL. Sequence-specific identification of 18 pathogenic microorganisms using microarray technology. Mol. Cell. Probes. 2002;16:119–127. doi: 10.1006/mcpr.2001.0397. [DOI] [PubMed] [Google Scholar]
- 6.Pozhitkov A, Bailey KD, Noble PA. 2007. Towards developing a statistically robust quantification method for microorganisms in mixtures using oligonucleotide microarrays (in review) [DOI] [PubMed] [Google Scholar]
- 7.Palmer C, Bik EM, Eisen MB, Eckburg PB, Sana TR, Wolber PK, Relman DA, Brown PO. Rapid quantitative profiling of complex microbial populations. Nucleic Acids Res. 2006;34:e5. doi: 10.1093/nar/gnj007. [DOI] [PMC free article] [PubMed] [Google Scholar]
- 8.Pozhitkov A, Noble PA, Domazet-Loso T, Nolte A, Sonnenberg R, Staehler P, Beier M, Tautz D. Tests of rRNA hybridization to microarrays suggest that hybridization characteristics of oligonucleotide probes for species discrimination cannot be predicted. Nucleic Acids Res. 2006;34:e66. doi: 10.1093/nar/gkl133. [DOI] [PMC free article] [PubMed] [Google Scholar]
- 9.Wick LM, Rouillard JM, Whittam TS, Gulari E, Tiedje JM, Hashsham SA. On-chip nonequilibrium dissociation curves and dissociation rate constants as methods to assess specificity of oligonucleotide probes. Nucleic Acids Res. 2006;34:e26. doi: 10.1093/nar/gnj024. [DOI] [PMC free article] [PubMed] [Google Scholar]
- 10.Pozhitkov A, Chernov B, Yershov G, Noble PA. Evaluation of gel-pad oligonucleotide microarray technology using artificial neural networks. Appl. Environ. Microbiol. 2005;71:8663–8676. doi: 10.1128/AEM.71.12.8663-8676.2005. [DOI] [PMC free article] [PubMed] [Google Scholar]
- 11.Koizumi Y, Kelly JJ, Nakagawa T, Urakawa H, ElFantroussi S, Muzaini A, Fukui M, Urushigawa Y, Stahl DA. Parallel characterization of anaerobic toluene- and ethylbenzene-degrading microbial consortia by PCR-denaturing gradient gel electrophoresis, RNA-DNA membrane hybridization, and DNA microarray technology. Appl. Environ. Microbiol. 2002;68:3215–3225. doi: 10.1128/AEM.68.7.3215-3225.2002. [DOI] [PMC free article] [PubMed] [Google Scholar]
- 12.Kelly JJ, Siripong S, McCormack J, Janus LR, Urakawa H, El Fantroussi S, Noble PA, Sappelsa L, Rittmann BE, et al. DNA microarray detection of nitrifying bacterial 16S rRNA in wastewater treatment plant samples. Water Res. 2005;39:3229–3238. doi: 10.1016/j.watres.2005.05.044. [DOI] [PubMed] [Google Scholar]
- 13.Zhang Y, Hammer DA, Graves DJ. Competitive hybridization kinetics reveals unexpected behavior patterns. Biophys. J. 2005;89:2950–2959. doi: 10.1529/biophysj.104.058552. [DOI] [PMC free article] [PubMed] [Google Scholar]
- 14.Urakawa H, El Fantroussi S, Smidt H, Smoot JC, Tribou EH, Kelly JJ, Noble PA, Stahl DA. Optimization of single-base-pair mismatch discrimination in oligonucleotide microarrays. Appl. Environ. Microbiol. 2003;69:2848–2856. doi: 10.1128/AEM.69.5.2848-2856.2003. [DOI] [PMC free article] [PubMed] [Google Scholar]
- 15.Anshelevich VV, Vologodskii AV, Lukashin AV, Frank-Kamenetskii MD. Slow relaxation processes in the melting of linear biopolymers: a theory and its application to nucleic acids. Biopolymers. 1984;23:39–58. doi: 10.1002/bip.360230105. [DOI] [PubMed] [Google Scholar]
- 16.Kozyavkin SA, Lyubchenko YL. The nonequilibrium character of DNA melting: effects of the heating rate on the fine structure of melting curves. Nucleic Acids Res. 1984;12:4339–4349. doi: 10.1093/nar/12.10.4339. [DOI] [PMC free article] [PubMed] [Google Scholar]
- 17.Mergny J-L, LaCroix L. Analysis of thermal melting curves. Oligonucleotides. 2003;13:515–537. doi: 10.1089/154545703322860825. [DOI] [PubMed] [Google Scholar]
- 18.Yu F, Danfeng Y, Knoll W. Oligonucleotide hybridization studied by a surface plasmon diffraction sensor (SPDS) Nucleic Acids Res. 2004;32:e75. doi: 10.1093/nar/gnh067. [DOI] [PMC free article] [PubMed] [Google Scholar]
- 19.Ikuta S, Takagi K, Wallace RB, Itakura K. Dissociation kinetics of 19 base paired oligonucleotide-DNA duplexes containing different single mismatched base-pairs. Nucleic Acids Res. 1987;15:797–811. doi: 10.1093/nar/15.2.797. [DOI] [PMC free article] [PubMed] [Google Scholar]
- 20.Urakawa H, Noble PA, El Fantroussi S, Kelly JJ, Stahl DA. Single-base-pair discrimination of terminal mismatches by using oligonucleotide microarrays and neural network analyses. Appl. Environ. Microbiol. 2002;68:235–244. doi: 10.1128/AEM.68.1.235-244.2002. [DOI] [PMC free article] [PubMed] [Google Scholar]
- 21.Laidler KJ. Chemical Kinetics. 1997. , 3rd edn. Prentice Hall, NY. [Google Scholar]
- 22.Sokal RR, Rohlf FJ. Biometry. 2nd edn. New York, NY: W.H. Freeman and Co; 1981. [Google Scholar]
- 23.Noble PA, Tribou E. Neuroet: an easy-to-use artificial neural network for ecological and biological modeling. Ecol. Model. 2006 (in press) doi:10.1016/j.ecolmodel.2005.06.013. [Google Scholar]
- 24.Li ESY, Ng JKK, Wu J-H, Liu WT. Evaluating single-base-pair discriminating capability of planar oligonucleotide microchips using a nonequilibrium dissociation approach. Environ. Microbiol. 2004;6:1197–1202. doi: 10.1111/j.1462-2920.2004.00648.x. [DOI] [PubMed] [Google Scholar]
- 25.Liu WT, Mirzabekov AD, Stahl DA. Optimization of an oligonucleotide microchip for microbial identification studies: a non-equilibrium dissociation approach. Environ. Microbiol. 2001;3:619–629. doi: 10.1046/j.1462-2920.2001.00233.x. [DOI] [PubMed] [Google Scholar]
- 26.Han T, Melvin CD, Shi L, Branham WS, Moland CL, Pine S, Thompson KL, Fuscoe JC. Improvement in the reproducibility and accuracy of DNA microarray quantification by optimizing hybridization conditions. BMC Bioinform. 2006;7:S17. doi: 10.1186/1471-2105-7-S2-S17. [DOI] [PMC free article] [PubMed] [Google Scholar]
- 27.Hong BJ, Sunkara V, Park JW. DNA microarrays on nanoscale-controlled surface. Nucleic Acids Res. 2005;33:e106. doi: 10.1093/nar/gni109. [DOI] [PMC free article] [PubMed] [Google Scholar]
- 28.ElFantroussi S, Urakawa H, Bernhard AE, Noble PA, Kelly JJ, Stahl DA. Direct profiling of environmental microbial populations by thermal dissociation analysis of native Ribosomal RNAs hybridized to oligonucleotide microarrays. Appl. Environ. Microbiol. 2003;69:2377–2382. doi: 10.1128/AEM.69.4.2377-2382.2003. [DOI] [PMC free article] [PubMed] [Google Scholar]
- 29.Loy A, Lehner A, Lee N, Adamczyk J, Meier H, Ernst J, Schleifer KH, Wagner M. Oligonucleotide microarray for 16S rRNA gene-based detection of all recognized lineages of sulfate-reducing prokaryotes in the environment. Appl. Environ. Microbiol. 2002;68:5064–5081. doi: 10.1128/AEM.68.10.5064-5081.2002. [DOI] [PMC free article] [PubMed] [Google Scholar]
- 30.Doktycz MJ, Morris MD, Dormady SJ, Beattie KL, Jacobson KB. Optical melting of 128 octamer DNA duplexes. J. Biol. Chem. 1995;270:8439–8445. doi: 10.1074/jbc.270.15.8439. [DOI] [PubMed] [Google Scholar]
- 31.Marky LA, Breslauer KJ. Calculating thermodynamic data for transition of any molecularity from equilibrium melting curves. Biopolymers. 1987;2:1601–1620. doi: 10.1002/bip.360260911. [DOI] [PubMed] [Google Scholar]
- 32.Noble PA, Pozhitkov A. High variability in melting profiles from gel pad arrays. Environ. Microbiol. 2007 doi: 10.1111/j.1462-2920.2007.01296.x. (in press) [DOI] [PubMed] [Google Scholar]
- 33.Pozhitkov A, Noble PA. Comment on discrimination of shifts in soil microbial communities using nonequilibrium thermal dissociation and gel pad array technology. Environ. Sci. Technol. 2007;41:1797–1798. doi: 10.1021/es062479m. , doi:10.1021/es062479m. [DOI] [PubMed] [Google Scholar]
- 34.Khrapko KR, Lysov YP, Khorlyn AA, Shick VV, Florentiev VL, Mirzabekov AD. An oligonucleotide hybridization approach to DNA sequencing. FEBS. 1989;256:188–122. doi: 10.1016/0014-5793(89)81730-2. [DOI] [PubMed] [Google Scholar]
- 35.Siripong S, Kelly JJ, Stahl DA, Rittmann BE. Impact of prehybridization PCR amplification on microarray detection of nitrifying bacteria in wastewater treatment plant samples. Environ. Microbiol. 2006;8:1564–1574. doi: 10.1111/j.1462-2920.2006.01047.x. [DOI] [PubMed] [Google Scholar]
- 36.Eyers L, Smoot JC, Smoot LM, Bugli C, Urakawa H, McMurry Z, Siripong S, El Fantrousii S, Lambert P, et al. Discrimination of shifts in a soil microbial community associated with TNT-contamination using a functional ANOVA of 16S rRNA hybridized to oligonucleotide microarrays. Environ. Sci. Technol. 2006;40:5867–5873. doi: 10.1021/es0609093. [DOI] [PubMed] [Google Scholar]
- 37.DeLosReyes MF, DeLosReyes FL, Hernandez M, Raskin L. Quantification of Gordona amarae strains in foaming activated sludge and anaerobic digester systems with oligonucleotide hybridization probes. Appl. Environ. Microbiol. 1998;64:2503–2512. doi: 10.1128/aem.64.7.2503-2512.1998. [DOI] [PMC free article] [PubMed] [Google Scholar]
- 38.Drobyshev A, Mologina N, Shik V, Pobedimskaya D, Yershov G, Mirzabekov A. Sequence analysis by hybridization with oligonucleotide microchip: identification of B-thalassemia mutations. Gene. 1997;188:45–52. doi: 10.1016/s0378-1119(96)00775-5. [DOI] [PubMed] [Google Scholar]
- 39.Hansen KH, Ahring BK, Raskin L. Quantification of syntrophic fatty acid-B-oxidizing bacteria in a mesophilic biogas reactor by oligonucleotide probe hybridization. Appl. Environ. Microbiol. 1999;65:4767–4774. doi: 10.1128/aem.65.11.4767-4774.1999. [DOI] [PMC free article] [PubMed] [Google Scholar]
- 40.Mobarry BK, Wagner M, Urbain V, Rittmann BE, Stahl DA. Phylogenetic probes for analyzing abundance and spatial organization of nitrifying bacteria. Appl. Environ. Microbiol. 1996;62:2156–2162. doi: 10.1128/aem.62.6.2156-2162.1996. [DOI] [PMC free article] [PubMed] [Google Scholar]
- 41.Liu WT, Wu JH, Li ESY, Selamat ES. Emission characteristics of fluorescent labels with respect to temperature changes and subsequent effects on DNA microchip studies. Appl. Environ. Microbiol. 2005;71:6453–6457. doi: 10.1128/AEM.71.10.6453-6457.2005. [DOI] [PMC free article] [PubMed] [Google Scholar]
- 42.Piotrowski J. Theory of Physical and Technical Measurement. NY: Elsevier; 1992. [Google Scholar]
Associated Data
This section collects any data citations, data availability statements, or supplementary materials included in this article.