


Abstract
Many methods for the detection of genomic DNA methylation states have appeared. Currently, nearly all such methods employ bisulfite-mediated deamination of denatured DNA. While this treatment effectively deaminates cytosines to uracils, leaving most 5-methylcytosines intact, it also introduces abasic sites that generate a significant number of single-strand breaks in DNA. We have investigated the interplay of these two processes in order to determine their relative effects on the methylation-sensitive QPCR method. The extent of cleavage of the input DNA is significant and appears to be an increasing function of DNA concentration. Even so, the results suggest that only ∼10% of a 62-nt target will be lost due to degradation and targets up to 131 nt will suffer only a 20% loss. More significant losses were found to occur during the subsequent removal of bisulfite and desulfonation steps that appear to be the result of size selectivity associated with matrix binding and elution required prior to QPCR in the most commonly used protocols. For biospecimens yielding <1 μg of DNA, these findings suggest that bisulfite treatment, in current implementations of MS-QPCR, result in low recoveries that preclude reliable analysis of DNA methylation patterns regardless of target size.
INTRODUCTION
In mammals, DNA methylation patterns are known to be important hallmarks of both cell type and cellular history. Patterns of methylation are maintained in a given cell lineage (1) but alterations in these patterns are associated with changes in gene expression (1), cellular differentiation (2), gene rearrangement, telomere shortening, DNA damage, viral integration (3,4), carcinogenesis (5,6) and aging (7). Given these associations, a good deal of effort has been invested in developing methods that can detect qualitative and quantitative changes in methylation patterns as biomarkers of these processes. The use of methylation-sensitive restriction enzymes was employed early on (8) as a qualitative indicator of methylation status, and methods of this type continue to be developed (9).
Other early techniques employed hydrazine (10–12) or potassium permanganate (13) DNA modification for genomic sequencing. However, since its introduction (14) the use of bisulfite-treated DNA as a means of distinguishing methylated cytosine from unmethylated cytosine in genomic applications has come into general use in the field. Certain artifacts can be avoided with highly purified DNA (15), however, the nature of the bisulfite reaction itself presents additional problems.
Bisulfite-mediated deamination of cytosine in DNA occurs only at low pH, in a solution that is effectively dilute sulfurous acid (16–19). Chemically this is required because of the low pKa of cytosine and the necessity for protonation of the N3 ring nitrogen in order to produce uracil or thymine from cytosine or 5-methylcytosine, respectively. The reaction rate for cytosine to uracil is much faster than the reaction rate for 5-methylcytosine to thymine, making it possible to detect 5-methylcytosines in biological samples as cytosine moieties that survive treatment with mild sulfurous acid. Superimposed on these reactions (Figure 1) is the tendency for the glycosyl bond to undergo hydrolysis at sites of protonated bases in DNA coupled with chain breakage (20). In this case, base loss is rapidly followed by conversion to the aldose and β-elimination resulting in chain breakage (21).
Figure 1.

Sulfurous acid (bisulfite)-mediated deamination and degradation of DNA. (A) Protonation of cytosine followed by nucleophilic attack by bisulfite activates the cytosine ring for hydrolytic deamination and β-elimination to produce uracil. (B) A similar process deaminates 5-methylcytosine at a much slower rate than that of cytosine. (C) Protonated bases created at low pH are removed from the DNA chain by glycosyl bond hydrolysis, leading to chain breaks through aldose conversion and β-elimination.
Many existing approaches to the analysis of methylation patterns now rely on bisulfite-treated DNA followed by PCR amplification. Of necessity, the use of this reagent requires its removal prior to PCR amplification. This desulfonation step is generally accomplished by exposing the DNA product to mild base coupled with binding to and elution from a matrix. Moreover, most work in cancer research has shown that no single gene can suffice for accurate prediction of clinical diagnosis or outcome. Thus, one is faced with the practical limitations associated with testing multiple genes superimposed on the limitations placed on these analyses by specimen size. While this has led to the introduction of multiplex PCR, mass spectroscopic systems and multigene array systems, the fundamental reliance on the bisulfite-mediated deamination of cytosine and subsequent purification of the product remains central to each of these techniques.
Quantitative PCR methods (22,23) have been introduced that require reference sequences for quantification and as measures of the recovery of intact target DNA. A number of different reference standards have been used in this application. However, relatively little information is available on the exact utilization of these references or their general performance. Moreover, there is little information available on the effects of the chemical breakdown of the target DNA necessarily associated with the bisulfite-catalyzed deamination reaction. In this article, we have used cloned target sequences that reproduce the expected bisulfite-converted target sequence to quantify DNA recoveries in the widely employed TaqMan® quantitative PCR reaction. Our results show that significant losses occur during the chemical preparation of the DNA for QPCR and that these losses are dependent on the starting concentration of the input DNA. While significant breakdown of the DNA occurs during the bisulfite-mediated deamination reaction, the losses appear to be dominated by the size-selectivity imposed by the necessity of the matrix-binding and elution step used during bisulfite removal and desulfonation. The implications of these findings are discussed.
MATERIALS AND METHODS
Cell culture
Human kidney 293 cells were grown as previously described (24). PC3 cells were grown under the same conditions except that the cells were grown in Kaighn's Nutrient Medium F12 (Irvine Scientific, Santa Ana, CA) containing 10% Fetal Bovine Serum. PC3 cells were passaged using 1X trypsin-EDTA, at 1:3–1:6.
DNA isolation
Genomic DNA was isolated using Qiagen's QIAamp® DNA Blood Mini-Kit according to the manufacturer's instructions. The kit-recommended RNAse step was included in order to remove contaminating RNA. The final concentration was determined by spectrophotometry. Qiagen's QIAamp® DNA Blood Mini-Kit was used since it is recommended for purification of DNA from a variety of tissues and bodily fluids as well as cultured cells. For the work described here the cultured-cell protocol in the manual was used.
Bisulfite treatment
DNA was bisulfite treated using the EZ DNA Methylation Kit (Zymo Research, Orange, CA) according to the manufacturer's instructions. In general, 200–1600 ng of genomic DNA was treated with bisulfite at final concentrations corresponding to 1.33–10.67 ng/μl of genomic DNA. Assuming 100% recovery from the desulfonation and purification steps, that amount of product containing 200 ng of genomic DNA was used for PCR amplification at a concentration of 8 ng/μl.
Sham-bisulfite treatment
DNA was sham-bisulfite treated by suspending it in the EZ DNA Methylation Kit's bisulfite reagent mixture (Zymo Research, Orange, CA) that had been pre-mixed with M-dilution buffer and the matrix-binding buffer so as to prevent the normal hydroxide ion-induced denaturation of the DNA. After a brief mixing it was bound to the purification matrix and eluted from the matrix as described by the manufacturer.
Gel electrophoretic and microfluidics separation methods
These methods have been described previously (25–27). The DNA 7500 LabChip was found to be most suited to visualization of the molecular length distribution of the bisulfite-treated DNAs. To corroborate estimates of single-strand molecular lengths obtained with non-denaturing microfluidics methodology, separations were also performed on 5% polyacrylamide sequencing gels containing 8 M urea (20). RNA markers were used to calibrate the polyacrylamide system. The number average molecular weights were determined by use of densitometry measurements on a denaturing polyacrylamide gel using the method described in (24). However an improvement was developed by using Scion Image (Scion Corporation, Frederick, Maryland) to calculate the areas under the curve.
Quantitative PCR
Duplex QPCR reactions used the following cycle profile: 1 hold at 95°C for 10 min, followed by 50 cycles of: 95°C for 15 s, 56°C for 30 s, 72°C for 30 s. Duplex PCR reactions contained: 0.25 µl Qiagen Hotstar Taq, 2.5 µl 10 × Qiagen buffer (providing 1.5 mM MgCl2), 320 µM dNTPs, 2.0 mM added MgCl2 (to bring the final MgCl2 concentration to 3.5 mM) 1.0 µl Q-Solution, 250 nM probe DNA, 900 nM each for forward and reverse primers DNA, 9.95 µl H2O, 5.0 µl DNA. Uniplex QPCR reactions were the same with the following exceptions: 2.5 mM final MgCl2, 5 µl Q-solution. The final reaction volume was 25 µl. QPCR conditions for detecting and quantifying the unconverted sequence were identical except that the annealing temperature was 60°C.
Concentrations were determined from a standard curve of the log[input DNA] versus Ct determined at a threshold value providing the best efficiency value and linearity in the semilog plot as determined by the Rotor Gene 3000 QPCR analysis software. Alternative methods of analysis are under development but have not been implemented here, with the following exception. It is important to note that the plasmid standards have two complementary strands while the genomic DNA targets have two non-complementary strands once deamination is complete. This means that only one of the two strands is amplified in the bisulfite-mediated PCR. Because of this, the standard curves run for an additional cycle compared to the unknowns. To correct for this the standard curves must be multiplied by a correction factor equal to (1 + E)−1, where E is the efficiency of the standard curve.
Synthesis of primers and TAQMAN® probes
Primers (Table 1) were purchased from Integrated DNA Technologies (Coralville, IA). All Q-PCR probes (Table 1) were synthesized in-house on an Expedite® solid-phase DNA/RNA synthesizer on a 1.0 µM scale. The modified phosphoramidites (5′-fluorescein, 5′-hexachloro-fluorescein and Cy5), the modified CPG-phosphoramidites (3′-PT-Amino-Modifier C6, 3′-BHQ-1, 3′-BHQ-3) and TAMRA NHS Ester were purchased from Glen Research (Sterling, VA). The unmodified phosphoramidite monomers, with either standard or mild protecting groups, along with DNA solid supports and other reagents were purchased from Sigma-Proligo (St. Louis, MO) and Applied Biosystems (Foster City, CA). The synthesis and deprotection conditions used, were those suggested by Glen Research (Sterling, VA) for the corresponding reagent. HPLC purification was performed using a PRP-1 column in TeBAA buffer (50 mM tetrabutylammonium acetate buffer, adjusted to pH 7.0 with acetic acid, in a gradient of acetonitrile) or TEAA buffer (50 mM triethylammonium acetate buffer, adjusted to pH 7.0 with acetic acid in a gradient of acetonitrile).
Table 1.
Primers and probes for TaqMan® QPCR
| Gene | Name | Sequence |
|---|---|---|
| RassF1aa | Methylated forward | 5′GCGTTGAAGTCGGGGTTC3′ |
| Methylated reverse | 5′CCCGTACTTCGCTAACTTTAAACG3′ | |
| Methylated probe | 6FAM-5′ACAAACGCGAACCGAACGAAACCA3-TAMRA | |
| Unmethylated forward | 5′GTGTTGAAGTTGGGGTTT3′ | |
| Unmethylated reverse | 5′CCCATACTTCACTAACTTTAAACA3′ | |
| Unmethylated probe I | 6FAM-5′-ACAAACACAAACCAAACAAAACCA-3′-TAMRA | |
| Unmethylated probe II | HEX-5′-ACAAACACAAACCAAACAAAACCA-3′-BHQ1 | |
| GstP1b | Methylated forward | 5′TTCGGGGTGTAGCGGTCGTC3′ |
| Methylated reverse | 5′GCCCCAATACTAAATCACGACG3′ | |
| Methylated probe | 6FAM-5′TAAAAAATCCCGCGAACTCCCGC3′-TAMRA | |
| Unmethylated forward | 5′GATGTTTGGGGTGTAGTGGTTGTT3′ | |
| Unmethylated reverse | 5′CCACCCCAATACTAAATCACAACA3′ | |
| Unmethylated probe | 6FAM-5′AAAAATCCCACAAACTCCCACC3′-TAMRA | |
| APCc | Methylated forward | 5′GAACCAAAACGCTCCCCAT3′ |
| Methylated reverse | 5′TTATATGTCGGTTACGTGCGTTTATAT3′ | |
| Methylated probe | 6FAM-5′CCCGTCGAAAACCCGCCGATTA3′-TAMRA | |
| Unmethylated forward | 5′CTAAATACAAACCAAAACACTCCCCAT3′ | |
| Unmethylated reverse | 5′AGTTATATGTTGGTTATGTGTGTTTATAT3′ | |
| Unmethylated probe I | 6FAM-5′CCCATCAAAAACCCACCAATTA3′-TAMRA | |
| Unmethylated probe II | CY5-5′CCCATCAAAAACCCACCAATTA3′-BHQ3 | |
| Unconverted forward | 5′GGACCAGGGCGCTCCCCAT3′ | |
| Unconverted reverse | 5′CCACATGTCGGTCACGTGCGCCCACAC3′ | |
| Unconverted probe | 6FAM-5′CCCGTCGGGAGCCCGCCGATTG3′-TAMRA | |
| Rarβd | Methylated forward | 5′AGAACGCGAGCGATTCGAGTAG3′ |
| Methylated reverse | 5′TACAAAAAACCTTCCGAATACGTT3′ | |
| Methylated probe | 6FAM-5′ATCCTACCCCGACGATACCCAAAC3′-TAMRA | |
| Unmethylated forward | 5′TTGAGAATGTGAGTGATTTGAGTAG3′ | |
| Unmethylated reverse | 5′TTACAAAAAACCTTCCAAATACATTC3′ | |
| Unmethylated probe | 6FAM-5′AAATCCTACCCCAACAATACCCAAAC3′-TAMRA |
aRassF1a: Homo sapiens Ras association (Ra1GDS/AF-6) domain family 1, (RassF1), transcript variant A (34).
cAPC: Human adenomatous polyposis coli (APC) gene (36).
dRarβ: Human retinoic acid receptor beta gene (37); TAMRA: Carboxytetramethylrhodamine; FAM: 6-Carboxyfluorescein; HEX: 6-Carboxy-2′,4,4′,5′,7,7′-hexachlorofluorescein; CY5: Indodicarbocyanine; BHQ1: 4′-(2-Nitro-4-toluyldiazo)-2′-methoxy-5′-methyl-diazobenzene-4′-(N-ethyl)-N-2-O-ethanol; and BHQ3: 3-Diethylamino-5-phenylphenazium-7-diazobenzene-4″-(N-ethyl)-N-2-O-ethanol.
Synthesis and cloning of ideal standards
Synthetic oligodeoxynucleotides (Figure 2, Table 1) were designed so that they corresponded to the deaminated product expected for the CG-methylated or -unmethylated sequence. In the unmethylated sequence, each of the cytosines in the genomic sequence was converted to a T in the synthetic DNA. In the methylated sequence, all cytosines except those in CG dinucleotides were converted to T. Short oligodeoxynucleotides were annealed and converted to duplex DNAs by primer extension. The resulting duplex molecules were treated with T4 Polynucleotide Kinase (NEB, Ipswich, MA) and run on a 2% agarose gel. The duplexes were extracted from the gel using a Qiaquick® Gel Extraction Kit (Qiagen, Valencia, CA). The plasmid vector, pBluescript II (Stratagene, La Jolla, CA), was linearized using R.EcoRV (New England Biolabs, Beverly, MA) followed by treatment with Calf Intestinal Alkaline Phosphatase (New England Biolabs, Beverly, MA). The plasmid DNA was separated on a 1% agarose gel and the band corresponding to the linearized DNA was gel extracted. Ligation of the duplex fragment and the linear plasmid DNA was carried out overnight at 16°C using T4 ligase (New England Biolabs, Beverly, MA). Blunt-end cloning produced a set of plasmids each carrying an ideal target standard. DNA sequencing was performed at the DNA sequencing facility of the City of Hope Cancer Center to confirm each cloned sequence.
Figure 2.

Cloning ideal DNA target standards. Synthetic oligodeoxynucleotides were synthesized so that they corresponded to the deaminated product expected for the methylated or unmethylated sequence. In the unmethylated sequence, each of the cytosines in the genomic sequence was converted to a T in the synthetic DNA. In the methylated sequence, all cytosines except those in CG dinucleotides were converted to T. Short oligodeoxynucleotides were annealed and converted to duplex DNAs by primer extension. Blunt-end cloning produced plasmids that carry the target standards. Direct DNA sequencing was used to confirm each sequence.
It is important to note here that bisulfite-mediated deamination converts the two target strands so that they are no longer complementary. Thus MS-PCR primers are designed to target only one of the two strands of the target duplex. For this reason, the sequences used in this article correspond only to the target strand utilized in the subsequent QPCR reaction.
Cloning of unconverted sequences
Unconverted target standard sequences used in the sham-bisulfite treatment experiments were cloned into pBluescript II as described above. Both sequences were cloned from HK293 genomic DNA. Sequences were confirmed by direct sequencing of the cloned plasmids.
The primer set used to clone the unmodified APC fragment for blunt-end cloning were: Forward 5′ACTGCCATCAACTTCCTTGC3′, Reverse 5′ACCTACCCCATTTCCGAGTC3′. The primers and probe sequences used for QPCR reactions were: Forward 5′GGACCAGGGCGCTCCCCAT-3′, and reverse 5′CCACATGTCGGTCACGTGCGCCCACAC3′, Probe 6FAM5′CCCGTCGGGAGCCCGCCGATTG-3′ TAMRA.
Cross reactivity experiments
For each gene target, primers and probes designed to detect the methylated target were tested in the QPCR reaction to determine whether or not they would amplify the ideal unmethylated standard at a given input copy number and vice versa. QPCR conditions were as given above.
Search path recovery experiments
In order to increase the search path encountered by the Taq polymerase in binding to an appropriate primer initiation site, increasing amounts of genomic DNA lacking the target sequence (e.g. Micrococcus lysodeikticus DNA which does not contain an amplifiable unmethylated target) were added to the plasmid DNA containing the ideal target sequence. Here, 200 fg of plasmid DNA was used with 200 ng of M. lysodeikticus DNA to provide the same amount of single-copy target that would be present in 200 ng of bisulfite-treated human DNA (i.e. 60 838 copies for a diploid gene).
Sham-treated genomic DNA
High molecular weight DNA was subjected to sham-bisulfite treatment for <1 min by adding it to bisulfite reagent pre-mixed with M-dilution buffer and matrix-binding buffer so as to prevent hydroxide-ion-induced denaturation of the DNA. It was then subjected to matrix purification and amplification using the unconverted QPCR primers and probes described above. Since deamination is not expected to occur under these conditions the unmodified plasmid clones described above were diluted appropriately for the construction of the standard curves in these experiments.
RESULTS AND DISCUSSION
In many cases specimen size is not limiting, thus for many purposes bisulfite treatment of 0.25–4 µg of DNA is recommended, (18,28–30) however, serum and other clinical samples rarely contain this much DNA and quite often bisulfite treatment has been carried out on less than 50 ng of DNA (31). Given these constraints, multiplex reactions are generally used to conserve specimen.
Although we obtained similar results throughout this study with uniplex or duplex reactions we report only the results with duplex reactions for simplicity. To study this reaction, we cloned synthetic versions of the desired target sequence (Figure 2) as recovery standards. These cloned targets are useful in assessing the properties of the reaction in a number of ways.
Cross reactivities
In order to investigate the details of this reaction, it is important to establish that the reactions designed to measure only methylated or unmethylated state of a gene do not cross react. The results of experiments designed to investigate this possibility for each of four commonly used biomarker detection systems (Table 2), are depicted in Figure 3. Here, it is seen that the system is highly selective with cross reactivity accounting for a negligible amount of signal.
Table 3.
Extension templates for extension and blunt-end cloning
| Gene | Name | Sequence |
|---|---|---|
| RassF1a | Methylated top | 5′GCGTTGAAGTCGGGGTTCGTTTTGTGGTTTCGTTCGGTTCGCGTTTGT3′ |
| Methylated bottom | 5′CCCGTACTTCGCTAACTTTAAACGCTAACAAACGCGAACCGAACGAAA3′ | |
| Unmethylated top | 5′GTGTTGAAGTTGGGGTTTGTTTTGTGGTTTTGTTTGGTTTGTGTTTGT3′ | |
| Unmethylated bottom | 5′CCCATACTTCACTAACTTTAAACACTAACAAACACAAACCAAACAAAA3′ | |
| GstP1 | Methylated top | 5′TTCGGGGTGTAGCGGTCGTCGGGTTGGGGTCGGCGGGAGTTCGCGGGATTTTTTAGA3′ |
| Methylated bottom | 5′GCCCCAATACTAAATCACGACGCCGACCGCTCTTCTAAAAAATCCCGCGAACTCCC3′ | |
| Unmethylated top | 5′GATGTTTGGGGTGTAGTGGTTGTTGGGTTGGGGTTGGTGGGAGTTTGTGGGATTTTTT3′ | |
| Unmethylated bottom | 5′CCACCCCAATACTAAATCACAACACCAACCACTCTTCTAAAAAATCCCACAAACTCCC3′ | |
| APC | Methylated top | 5′GAACCAAAACGCTCCCCATTCCCGTCGAAAACCCGCCGATTAACTAA3′ |
| Methylated bottom | 5′TTATATGTCGGTTACGTGCGTTTATATTTAGTTAATCGGCGGGTTTT3′ | |
| Unmethylated top | 5′CTAAATACAAACCAAAACACTCCCCATTCCCATCAAAAACCCACCAATTAAC3′ | |
| Unmethylated bottom | 5′AGTTATATGTTGGTTATGTGTGTTTATATTTAGTTAATTGGTGGGTTTTTGA3′ | |
| Rarβ | Methylated top | 5′AGAACGCGAGCGATTCGAGTAGGGTTTGTTTGGGTATCGTCGGGGTAGGA3′ |
| Methylated bottom | 5′TACAAAAAACCTTCCGAATACGTTCCGAATCCTACCCCGACGATACCCAA3′ | |
| Unmethylated top | 5′TTGAGAATGTGAGTGATTTGAGTAGGGTTTGTTTGGGTATTGTTGGGGTAGG3′ | |
| Unmethylated bottom | 5′TTACAAAAAACCTTCCAAATACATTCCAAATCCTACCCCAACAATACCCAAA3′ |
Table 2.
Overall duplex recoveries APC and GstP1 (60 838 input copies)
| Cell line | Gene | Methylation state | Observed copies | M/U + M | U + M | Total recovery |
|---|---|---|---|---|---|---|
| PC3 | APC | Methylated | 3175 ± 1905* | 0.984 | 3225 | 0.053 |
| Unmethylated | <50 | |||||
| GstP1 | Methylated | 837 ± 567 | 0.208 | 4017 | 0.066 | |
| Unmethylated | 3180 ± 1700 | |||||
| HK293 | APC | Methylated | <50 | <0.0159 | 3153 | 0.051 |
| Unmethylated | 3103 ± 1805 | |||||
| GstP1 | Methylated | <50 | <0.0294 | 1703 | 0.028 | |
| Unmethylated | 1653 ± 1003 |
*Recoveries at 200 ng input DNA (predicted to contain 60 838 copies) ±S.D. based on five independent measurements.
Figure 3.

Cross reactivity testing. Using the cloned target sequences primer/probe sets were tested for cross reactivity with each target. True target recoveries for cloned standards matched the 100% recoveries expected from the standard curve, while cross target recoveries were negligible.
Overall recoveries
The existence of the competing reactions depicted in Figure 1 suggests that significant losses of the desired product can occur, and a priori one might suspect that losses would be a function of input concentration. Thus, we began our experiments by treating 200 ng of DNA with bisulfite. When plasmids containing the desired target sequence (i.e. the sequence expected at the targeted region once complete deamination of the cytosine residues is achieved) were used as copy number standards, we found that recovery was very low and gene-target specific (Table 2). That is to say, once the primer sequences were chosen, and primer concentrations and cycle times were optimized for the PCR portion of the reaction, the amount of recoverable input deaminated target sequence was dependent on the cell line used and the gene target. Total recovery for a given gene (i.e. the sum of the copies observed from the methylated (M) and the unmethylated (U) targets) was ∼5% of the input and varied slightly with the gene target used (Table 2). Moreover, considerable scatter in the data was observed with input levels at or below 200 ng of genomic DNA. Standard deviations in the observed recovery were on the order of the measurement itself. Recovery in this initial set of experiments was scaled to the expected number of copies present in 200 ng of genomic DNA (60 838 copies for a given single-copy target taken as 100%). This method is open to errors due to inaccuracies in DNA concentration measurement, and subsequent recovery experiments were scaled to the number of copies of the unconverted sequence measured by QPCR (see below).
Search path recovery experiments
One possible explanation for the low overall recovery of target in these experiments is the relative amount of non-target DNA in the plasmid-borne standards compared to the genomic DNA. In effect, the primers and Taq polymerase can be viewed as being forced to search through considerably more non-target genomic DNA to initiate copying, than they are forced to search through in the standard reactions containing the shorter plasmid target DNA population. Since human DNA contains the target sequence, we used M. lysodeikticus DNA as competitor in experiments designed to detect a decrease of signal associated with DNA seeded with single-copy levels of plasmid DNA target. A 10–12% decrease in signal was detected (data not shown). This finding is not completely unexpected since in most QPCR work this effect is generally offset by the high input concentrations of both Taq polymerase and primers. Clearly this cannot account for the considerable losses we observe.
Sham-treated DNA
In initial attempts at developing a baseline for recovery estimates we attempted to sham treat the DNA with the bisulfite reagents. Here, DNA was exposed to the bisulfite reagent for as brief a period as possible (generally a maximum of 30 s) before beginning the desulfonation and matrix purification step. As noted by others (18,21) the conversion can be very rapid. We detected significant amounts of both the converted (i.e. deaminated) and unconverted DNA using the converted and unconverted primer-probe PCR systems for the APC promoter even at short times of exposure, and high input DNA levels (1600 ng). Thus we were unable to use the sham-treated DNA as a baseline for unconverted input levels. Nevertheless, we were able to determine the extent of the reaction at 16 h of exposure to the bisulfite reagent using the unconverted primer probe system for the APC reaction. With the full 16 h of incubation, very little signal could be recovered with this PCR system suggesting that the DNA has been completely converted to the deaminated form by the treatment, whereas the signal from the converted primer probe system was significant. For example, with 1600 ng of genomic DNA (the highest amount used in these experiments), after 16 h of exposure to the bisulfite reagent ∼30% of the input copies were recovered with the converted primer probe system while only ∼2% copies could be detected with the unconverted primer probe system.
Measured recoveries of bisulfite-treated DNA
The two competing reactions described above operate to deaminate all cytosine residues while minimizing the breakdown of the DNA. Both reactions are very rapid with complete conversion of all cytosines to uracils in as little as 20 min (18,19) and extensive degradation of the DNA occurring over the same time period. Both deamination and DNA degradation appear to be fast (18,19). To assess the degree of degradation, we determined the size of the bisulfite-treated DNA. Untreated DNA ranged in molecular length from ∼42 000–25 000 bp with a weak smear of smaller DNA fragments that had been sheared during DNA isolation extending to lower molecular lengths, however, bisulfite-treated DNA was extensively degraded. Figure 4A depicts the observed molecular weight range for the bisulfite-treated DNA as determined by microfluidics-based capillary electrophoresis.
Figure 4.

Microfluidics separations of the bisulfite-treated DNA. (A) Bisulfite-treated DNA was separated by capillary electrophoresis on microfluidics chips as previously described (26). Representative results depicted in virtual scan format were replotted to display the profile on a linear molecular length scale. (B) Bisulfite-treated DNA was separated by PAGE using 8 M urea to prevent secondary structure formation. Both methods give approximately the same value for the number average molecular weight of single-stranded DNA fragments. Note the differences in abscissas on the two graphs result from the differences between the two methods. The microfluidics system yields molecular lengths calculated from retention times for duplex DNA markers in base pairs. The standard denaturing electrophoresis system is measured in distance from the origin calibrated against RNA markers in nucleotides. The direction of electrophoresis is from left to right in both graphs.
This profile allows us to estimate the probability that single strands from the PCR target will be broken by base loss and subsequent strand-scission (Figure 1). The distribution of fragment lengths created by random breaks in denatured DNA is given by Equation (1) for a genome of length Λ (32,33), where f is the frequency of random breaks, and FW(L) is the weight fraction ≤L:
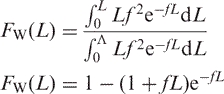 |
1 |
As previously reported (24), the number average molecular length (LN = 1/f) of the distribution of fragments occurs at 26% of the area of the distribution measured from zero molecular weight (24): FW(LN) = 1 − (1 + 1)e−1 = 0.26. For the distribution observed after bisulfite treatment, matrix binding and elution (Figure 4A), LN corresponds to the position of a 900-bp electrophoretic standard. Our experience with the microfluidics separation system is that single-stranded DNA runs ∼25% slower on average than duplex DNA of the same length. Thus the frequency (f) of single-strand breaks is about 1/(LN − 0.25LN) or 675 nt if the DNA is completely denatured prior to bisulfite treatment. To confirm this result, we separated the bisulfite-treated DNA under denaturing conditions using 5% polyacrylamide and 8 M urea (20). As can be seen from Figure 4B, the estimated number average molecular length using this single-stranded separation system yielding an estimate of ∼587 nt for the number average molecular weight of the bisulfite-treated DNA based on four measurements with a range of 403–827 nt. Given these results, the probability (P) that a single-stranded target sequence of length L will not be broken by bisulfite treatment is given by:
| 2 |
For the APC target under study here:
This implies that we should expect only a 13% loss of the APC target simply due to bisulfite-promoted breakdown of the DNA. Clearly, the calculated expectations for loss due to bisulfite-mediated breakdown do not reflect the experimental results (Table 2).
To study this loss in more detail, we used the APC system targeting HK293 genomic DNA. We expect the additional loci studied to behave similarly since recoveries from GstP1 and APC loci were similarly low (Table 2). However, the APC system in HK293 cells was chosen for detailed analysis because it is completely unmethylated in the target region as determined by both the direct sequencing of bisulfite-converted clones (24) and the QPCR method described here (Table 2). This permits the recovery of unmethylated DNA to be scaled against the experimental QPCR value obtained with the unconverted sequence, thus obviating possible errors in determination of the concentration of the genomic DNA associated with spectrophotometry. As can be seen from Figure 5, PCR signal recovered at any concentration of bisulfite-treated DNAs was much less than the 87% expected from bisulfite-mediated breakdown frequency measured at higher concentrations. In fact it was dependent on the concentration of DNA present during bisulfite treatment. One might suspect that bisulfite-mediated single-strand breaks might somehow be involved in the low recoveries observed in Figure 5. This would require that the rate of bisulfite-mediated breakdown be actually more extensive at low concentrations of input DNA. However, this actually runs counter to the known properties of the reaction (18). Taken together, these considerations lead one to suspect that size selectivity at the binding and elution step employed in the removal of the bisulfite from the reaction prior to QPCR are responsible for losses experienced in the process.
Figure 5.

Recovery of target sequence from bisulfite-treated genomic DNA. High molecular weight DNA was subjected to bisulfite treatment, matrix purification and amplification using the duplex QPCR. Serial dilution of the plasmid standards was used to construct a standard curve for recovery of genomic target DNA from a cell line (HK293) in which the target APC gene is completely unmethylated. Target DNA recovery is plotted as a function of initial DNA concentration receiving bisulfite treatment and matrix purification. That portion of the recovered volume that would represent 200 ng of DNA (assuming 100% recovery at these two steps) was subjected to PCR amplification. A separate PCR reaction was performed using the unconverted primer/probe system to obtain an experimental value for full recovery of the target. Each point is the average of 10 determinations of the ratio of the observed unmethylated copy number to the unconverted copy number Error bars indicate ± 1 S.D. (A) Analytical prediction for the recovery based on Equation (4). This graph represents the plot of the equation with the following parameters: θ is a unit-less fraction equal to the ratio of target copies recovered to the total input target copies. Lu = 7500 nt, Ll = 75 nt, kb = 5.2 × 10³ M−1, f = 1/587 nt = 0.0017 nt−1. DNA concentration is expressed as the molar concentration of nucleotides ([nt] M) in input genomic single-strands. The points on the graph correspond to 0, 200, 400, 800 and 1600 ng of treated DNA. (B) Analytical prediction for the recovery based on Equation (5). This graph represents the plot of the equation with the following parameters: θ is a unit-less fraction equal to the ratio of target copies recovered to the total input target copies. Lu = 7500 nt, Ll = 75 nt, k = 0.625 h−1M−1, t = 16 h, kb = 6.00 × 10³ M−1, DNA concentration is expressed as the molar concentration of nucleotides ([nt] M) in input genomic single-strands. The points on the graph correspond to 0, 200, 400, 800 and 1600 ng of treated DNA.
Size selection in binding and elution during desulfonation
Assume that there is a lower limit Ll below which the DNA does not bind to the matrix, and an upper limit Lu above which DNA fragments bind to the matrix but cannot be eluted from it. In this case, the recoverable weight fraction  is given by:
| 3 |
The total concentration of those fragments is:
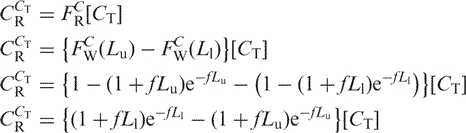 |
Let θN = the fraction of intact target DNA recovered after bisulfite treatment, matrix binding and elution. Then the recoverable weight fraction is described by a Langmuir isotherm with a binding constant kb:
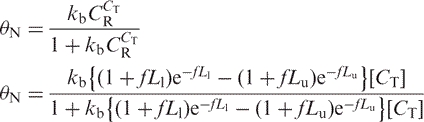 |
4 |
This relationship provides a reasonably good fit of the data (Figure 4A) when Lu = 7500 nt, Ll = 75 nt, and f = 1/587 nt = 0.0017 nt−1, although there is still a significant deviation from the observed data points at low input concentrations.
Apparently the assumption that the cleavage frequency f is independent of DNA concentration over the range tested is not borne out by the data. On the other hand, f can be considered to be a function of input DNA concentration [CT] and time t if all other reaction components are constant (e.g. pH, bisulfite concentration, etc). In this case, df/dt = k[CT] and for any constant time interval t; f = kt[CT]. Substitution in Equation (4) yields:
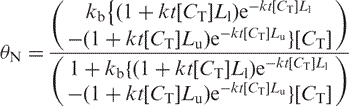 |
5 |
As can be seen from Figure 5B this approach gives a much better fit to the CT data. We interpret this to mean that a smaller fraction of the DNA is broken down to the size selection window of the matrix at lower input DNA concentration, compounding the losses at low DNA concentration, and generating the sigmoid nature of the recovery curve in Figure 5B. To test this possibility, we performed the complete deamination reaction at high DNA concentration (800 ng input DNA) and then put the equivalent of 200 ng through the binding and elution step at the same time that we put the equivalent of 800 ng of the same reaction product through the binding and elution step. In this experiment, the recovery of the target DNA from the 800-ng input specimen was ∼5.8%, or ∼2-fold improvement over the 2.6% recovery observed when 200 ng of DNA is bisulfite treated and subjected to matrix binding and elution. Clearly losses due to the performance of the matrix binding and elution step outweigh those due to single-strand breakdown.
In the final experiment, we investigated the effect of carrier DNA on recoveries. Here, 1200 ng of M. lysodeikticus DNA was added to 800 ng of genomic DNA either before bisulfite treatment or after bisulfite treatment but before matrix purification. Carrier DNA added in either mode actually diminished target recovery (data not shown), suggesting that this approach is not helpful.
CONCLUSION
While at least one report of the extent and rapidity of the degradation of DNA by bisulfite has appeared (21), the extent of this side reaction has not been fully appreciated in the studies of DNA methylation. Moreover, studies on the effect of this side reaction on the MS-QPCR have not been reported. In this article, we have shown that the degradation of bisulfite-treated DNA is extensive, and that additional and even more extensive losses occur at the required purification step prior to QPCR. The use of the cloned standards described here permitted quantification of these losses.
While variations in bisulfite treatment have been employed in the literature the most commonly used methods employing real-time MS-QPCR are similar to the method studied here (34–39). A variety of endpoint analyses have also been employed where a semi-quantitative determination can be made at high cycle number, see for example (22,30,40,41). These methods may avoid the difficulties associated with low target sequence recoveries by nested PCR (41) or high-cycle endpoint analysis. TaqMan® MS-QPCR methods however are likely to be more affected by this problem since quantification generally depends on low-cycle analysis in the log-linear range of the exponential increase in measured reaction product.
Even so, several methods have appeared that avoid the matrix purification step identified as a key difficulty in the recovery of low amounts of DNA. For example, good recovery of low input DNA has been achieved with centrifugal filtration (42) in place of matrix purification. Moreover, performing the bisulfite treatment in agarose has also been reported to avoid matrix purification and give good recoveries with nested PCR (43). These two approaches may well avoid the losses reported here, although they appear not to have been implemented as TaqMan® MS-QPCR analyses. A third approach (44), utilizing nitrocellulose-membrane-bound DNA and hybridization detection of digoxigenin-labeled probes with anti-digoxigenin-AP Fab fragments, obviates not only the matrix purification step but also the PCR. This system is reported to have qualitative sensitivities beyond those observed here.
In general, MS-QPCR reactions are calibrated with in vitro methylated genomic DNA from a cell line or from isolated human lymphocytes (29). In this calibration method, the mycoplasmal methyltransferase M · SssI is used in excess to completely methylate all CG sites in the genomic DNA methylation standard. Completeness of methylation can be checked with bacterial restriction enzymes. Alternatively, DNA from a cell line known to be completely methylated at the locus of interest can be used as a standard (45). As a rule, 1 μg of this standard is treated with bisulfite. The recovered product is then serially diluted and amplified to produce the standard curve. Our data show that this method will not be accurate when the available biological specimen DNA is not equal to the amount used in the bisulfite treatment of the in vitro methylated DNA. Since this number is generally 1 μg, a significant under-estimation of the actual amount of target DNA will occur when the available biological sample is <1 μg. Moreover, these methods only permit the estimation of the level of methylated DNA. Quantification of the amount of unmethylated DNA at the same locus is not often performed in part because a genomic DNA specimen that is completely unmethylated at multiple loci is generally unavailable. Most often, DNA recovery is monitored by amplification of a locus devoid of CG sites. The recovery at this locus (often β-actin or MyoD) is then taken as the denominator in computing a methylation ratio. Here again errors can arise in tumor specimens where clastic changes like DNA amplification or deletion often occur. Moreover, if care is not taken in matching the target lengths of the various genes to that of the recovery locus, different amounts of each target will be degraded during the bisulfite treatment.
Using the cloned standards and the method described here one is able to compute the ratio of methylated DNA to that of total DNA (methylated + unmethylated DNA) at the locus in question. This method avoids potential artifacts that can occur when the M · SssI standard and the specimen DNAs are not treated with bisulfite at the same input concentrations as the specimens (Figure 5), and provides an internal control for possible amplification, loss of heterozygosity, insertion deletion or repeat expansion at a given locus in genetic diseases and cancer. We prefer the use of cloned standards as opposed to synthetic duplexes which might also serve as standards because plasmid stocks are easily stored and can be easily exchanged between laboratories at almost negligible cost. Thus the use of these cloned standards broadens the scope of the MS-QPCR method and permits it to be more accurately applied.
Finally, in designing MS-QPCR experiments we have found the equation P = e−0.0017L can be used to determine the probability P that a target of length L will survive bisulfite treatment, under the conditions described here.
ACKNOWLEDGEMENTS
This work was supported by City of Hope's Cancer Center Support Grant 5P30CA033572-22 and by grant CA102521-01 to S.S.S. from the U.S. National Cancer Institute of the National Institutes of Health. Funding to pay the Open Access publication charges were paid in part by the authors.
Conflict of interest statement. None declared.
REFERENCES
- 1.Razin A., Riggs A.D. DNA methylation and gene function. Science. 1980;210:604–610. doi: 10.1126/science.6254144. [DOI] [PubMed] [Google Scholar]
- 2.Chen Z.X., Riggs A.D. Maintenance and regulation of DNA methylation patterns in mammals. Biochem. Cell Biol. 2005;83:438–448. doi: 10.1139/o05-138. [DOI] [PubMed] [Google Scholar]
- 3.Smith S.S., Crocitto L. DNA methylation in eukaryotic chromosome stability revisited: DNA methyltransferase in the management of DNA conformation space. Mol. Carcinog. 1999;26:1–9. doi: 10.1002/(sici)1098-2744(199909)26:1<1::aid-mc1>3.0.co;2-p. [DOI] [PubMed] [Google Scholar]
- 4.Smith S.S. Gilbert's conjecture: the search for DNA (cytosine-5) demethylases and the emergence of new functions for eukaryotic DNA (cytosine-5) methyltransferases. J. Mol. Biol. 2000;302:1–7. doi: 10.1006/jmbi.2000.4046. [DOI] [PubMed] [Google Scholar]
- 5.Jones P.A. Overview of cancer epigenetics. Semin. Hematol. 2005;42:S3–S8. doi: 10.1053/j.seminhematol.2005.05.001. [DOI] [PubMed] [Google Scholar]
- 6.Baylin S.B., Ohm J.E. Epigenetic gene silencing in cancer – a mechanism for early oncogenic pathway addiction? Nat. Rev. Cancer. 2006;6:107–116. doi: 10.1038/nrc1799. [DOI] [PubMed] [Google Scholar]
- 7.Issa J.P. CpG-island methylation in aging and cancer. Curr. Top. Microbiol. Immunol. 2000;249:101–118. doi: 10.1007/978-3-642-59696-4_7. [DOI] [PubMed] [Google Scholar]
- 8.Waalwijk C., Flavell R.A. DNA methylation at a CCGG sequence in the large intron of the rabbit beta-globin gene: tissue-specific variations. Nucleic Acids Res. 1978;5:4631–4634. doi: 10.1093/nar/5.12.4631. [DOI] [PMC free article] [PubMed] [Google Scholar]
- 9.Xiong Z., Laird P.W. COBRA: a sensitive and quantitative DNA methylation assay. Nucleic Acids Res. 1997;25:2532–2534. doi: 10.1093/nar/25.12.2532. [DOI] [PMC free article] [PubMed] [Google Scholar]
- 10.Church G.M., Gilbert W. Genomic sequencing. Proc. Natl. Acad. Sci. USA. 1984;81:1991–1995. doi: 10.1073/pnas.81.7.1991. [DOI] [PMC free article] [PubMed] [Google Scholar]
- 11.Saluz H., Jost J.P. A simple high-resolution procedure to study DNA methylation and in vivo DNA-protein interactions on a single-copy gene level in higher eukaryotes. Proc. Natl. Acad. Sci. USA. 1989;86:2602–2606. doi: 10.1073/pnas.86.8.2602. [DOI] [PMC free article] [PubMed] [Google Scholar]
- 12.Pfeifer G.P., Steigerwald S.D., Mueller P.R., Wold B., Riggs A.D. Genomic sequencing and methylation analysis by ligation mediated PCR. Science. 1989;246:810–813. doi: 10.1126/science.2814502. [DOI] [PubMed] [Google Scholar]
- 13.Rein T., Natale D.A., Gartner U., Niggemann M., DePamphilis M.L., Zorbas H. Absence of an unusual ‘densely methylated island’ at the hamster dhfr ori-beta. J. Biol. Chem. 1997;272:10021–10029. doi: 10.1074/jbc.272.15.10021. [DOI] [PubMed] [Google Scholar]
- 14.Frommer M., McDonald L.E., Millar D.S., Collis C.M., Watt F., Grigg G.W., Molloy P.L., Paul C.L. A genomic sequencing protocol that yields a positive display of 5-methylcytosine residues in individual DNA strands. Proc. Natl. Acad. Sci. USA. 1992;89:1827–1831. doi: 10.1073/pnas.89.5.1827. [DOI] [PMC free article] [PubMed] [Google Scholar]
- 15.Warnecke P.M., Stirzaker C., Song J., Grunau C., Melki J.R., Clark S.J. Identification and resolution of artifacts in bisulfite sequencing. Methods. 2002;27:101–107. doi: 10.1016/s1046-2023(02)00060-9. [DOI] [PubMed] [Google Scholar]
- 16.Hayatsu H., Wataya Y., Kai K., Iida S. Reaction of sodium bisulfite with uracil, cytosine, and their derivatives. Biochemistry. 1970;9:2858–2865. doi: 10.1021/bi00816a016. [DOI] [PubMed] [Google Scholar]
- 17.Hayatsu H., Wataya Y., Kazushige K. The addition of sodium bisulfite to uracil and to cytosine. J. Am. Chem. Soc. 1970;92:724–726. doi: 10.1021/ja00706a062. [DOI] [PubMed] [Google Scholar]
- 18.Shiraishi M., Hayatsu H. High-speed conversion of cytosine to uracil in bisulfite genomic sequencing analysis of DNA methylation. DNA Res. 2004;11:409–415. doi: 10.1093/dnares/11.6.409. [DOI] [PubMed] [Google Scholar]
- 19.Wang R.Y., Gehrke C.W., Ehrlich M. Comparison of bisulfite modification of 5-methyldeoxycytidine and deoxycytidine residues. Nucleic Acids Res. 1980;8:4777–4790. doi: 10.1093/nar/8.20.4777. [DOI] [PMC free article] [PubMed] [Google Scholar]
- 20.Suzuki T., Ohsumi S., Makino K. Mechanistic studies on depurination and apurinic site chain breakage in oligodeoxyribonucleotides. Nucleic Acids res. 1994;22:4997–5003. doi: 10.1093/nar/22.23.4997. [DOI] [PMC free article] [PubMed] [Google Scholar]
- 21.Grunau C., Clark S.J., Rosenthal A. Bisulfite genomic sequencing: systematic investigation of critical experimental parameters. Nucleic Acids Res. 2001;29:e65. doi: 10.1093/nar/29.13.e65. [DOI] [PMC free article] [PubMed] [Google Scholar]
- 22.Herman J.G., Graff J.R., Myohanen S., Nelkin B.D., Baylin S.B. Methylation-specific PCR: a novel PCR assay for methylation status of CpG islands. Proc. Natl. Acad. Sci. USA. 1996;93:9821–9826. doi: 10.1073/pnas.93.18.9821. [DOI] [PMC free article] [PubMed] [Google Scholar]
- 23.Gonzalgo M.L., Jones P.A. Rapid quantitation of methylation differences at specific sites using methylation-sensitive single nucleotide primer extension (Ms-SNuPE) Nucleic Acids Res. 1997;25:2529–2531. doi: 10.1093/nar/25.12.2529. [DOI] [PMC free article] [PubMed] [Google Scholar]
- 24.Shevchuk T., Kretzner L., Munson K., Axume J., Clark J., Dyachenko O.V., Caudill M., Buryanov Y., Smith S.S. Transgene-induced CCWGG methylation does not alter CG methylation patterning in human kidney cells. Nucleic Acids Res. 2005;33:6124–6136. doi: 10.1093/nar/gki920. [DOI] [PMC free article] [PubMed] [Google Scholar]
- 25.Smith S.S., Gilroy T.E., Ferrari F.A. The influence of agarose—DNA affinity on the electrophoretic separation of DNA fragments in agarose gels. Anal. Biochem. 1983;128:138–151. doi: 10.1016/0003-2697(83)90354-8. [DOI] [PubMed] [Google Scholar]
- 26.Fuller R.A., Clark J., Kretzner L., Korns D., Blair S.L., Crocitto L.E., Smith S.S. Use of microfluidics chips for the detection of human telomerase RNA. Anal. Biochem. 2003;313:331–334. doi: 10.1016/s0003-2697(02)00609-7. [DOI] [PubMed] [Google Scholar]
- 27.Clark J., Shevchuk T., Swiderski P.M., Dabur R., Crocitto L.E., Buryanov Y.I., Smith S.S. Mobility-shift analysis with microfluidics chips. Biotechniques. 2003;35:548–554. doi: 10.2144/03353rr01. [DOI] [PubMed] [Google Scholar]
- 28.Brena R.M., Auer H., Kornacker K., Hackanson B., Raval A., Byrd J.C., Plass C. Accurate quantification of DNA methylation using combined bisulfite restriction analysis coupled with the Agilent 2100 Bioanalyzer platform. Nucleic Acids Res. 2006; 34:e17. doi: 10.1093/nar/gnj017. [DOI] [PMC free article] [PubMed] [Google Scholar]
- 29.Hoque M.O., Rosenbaum E., Westra W.H., Xing M., Ladenson P., Zeiger M.A., Sidransky D., Umbricht C.B. Quantitative assessment of promoter methylation profiles in thyroid neoplasms. J. Clin. Endocrinol. Metab. 2005;90:4011–4018. doi: 10.1210/jc.2005-0313. [DOI] [PubMed] [Google Scholar]
- 30.Dulaimi E., Uzzo R.G., Greenberg R.E., Al-Saleem T., Cairns P. Detection of bladder cancer in urine by a tumor suppressor gene hypermethylation panel. Clin. Cancer. Res. 2004;10:1887–1893. doi: 10.1158/1078-0432.ccr-03-0127. [DOI] [PubMed] [Google Scholar]
- 31.Bastian P.J., Palapattu G.S., Lin X., Yegnasubramanian S., Mangold L.A., Trock B., Eisenberger M.A., Partin A.W., Nelson W.G. Preoperative serum DNA GSTP1 CpG island hypermethylation and the risk of early prostate-specific antigen recurrence following radical prostatectomy. Clin. Cancer. Res. 2005;11:4037–4043. doi: 10.1158/1078-0432.CCR-04-2446. [DOI] [PubMed] [Google Scholar]
- 32.Botchan M., McKenna G., Sharp P.A. Cleavage of mouse DNA by a restriction enzyme as a clue to the arrangement of genes. Cold Spring Harb Symp. Quant. Biol. 1974;38:383–395. doi: 10.1101/sqb.1974.038.01.041. [DOI] [PubMed] [Google Scholar]
- 33.Hamer D.H., Thomas C.A., Jr. The cleavage of Drosophila melanogaster DNA by restriction endonucleases. Chromosoma. 1975;49:243–267. [Google Scholar]
- 34.Lehmann U., Langer F., Feist H., Glockner S., Hasemeier B., Kreipe H. Quantitative assessment of promoter hypermethylation during breast cancer development. Am. J. Pathol. 2002;160:605–612. doi: 10.1016/S0002-9440(10)64880-8. [DOI] [PMC free article] [PubMed] [Google Scholar]
- 35.Maruyama R., Toyooka S., Toyooka K.O., Virmani A.K., Zochbauer-Muller S., Farinas A.J., Minna J.D., McConnell J., Frenkel E.P., et al. Aberrant promoter methylation profile of prostate cancers and its relationship to clinicopathological features. Clin. Cancer Res. 2002;8:514–519. [PubMed] [Google Scholar]
- 36.Usadel H., Brabender J., Danenberg K.D., Jeronimo C., Harden S., Engles J., Danenberg P.V., Yang S., Sidransky D. Quantitative adenomatous polyposis coli promoter methylation analysis in tumor tissue, serum, and plasma DNA of patients with lung cancer. Cancer Res. 2002;62:371–375. [PubMed] [Google Scholar]
- 37.Fackler M.J., McVeigh M., Mehrotra J., Blum M.A., Lange J., Lapides A., Garrett E., Argani P., Sukumar S. Quantitative multiplex methylation-specific PCR assay for the detection of promoter hypermethylation in multiple genes in breast cancer. Cancer Res. 2004;64:4442–4452. doi: 10.1158/0008-5472.CAN-03-3341. [DOI] [PubMed] [Google Scholar]
- 38.Harden S.V., Sanderson H., Goodman S.N., Partin A.A., Walsh P.C., Epstein J.I., Sidransky D. Quantitative GSTP1 methylation and the detection of prostate adenocarcinoma in sextant biopsies. J. Natl. Cancer Inst. 2003;95:1634–1637. doi: 10.1093/jnci/djg082. [DOI] [PubMed] [Google Scholar]
- 39.Rosenbaum E., Hoque M.O., Cohen Y., Zahurak M., Eisenberger M.A., Epstein J.I., Partin A.W., Sidransky D. Promoter hypermethylation as an independent prognostic factor for relapse in patients with prostate cancer following radical prostatectomy. Clin. Cancer Res. 2005;11:8321–8325. doi: 10.1158/1078-0432.CCR-05-1183. [DOI] [PubMed] [Google Scholar]
- 40.Ballestar E., Paz M.F., Valle L., Wei S., Fraga M.F., Espada J., Cigudosa J.C., Huang T.H., Esteller M. Methyl-CpG binding proteins identify novel sites of epigenetic inactivation in human cancer. EMBO J. 2003;22:6335–6345. doi: 10.1093/emboj/cdg604. [DOI] [PMC free article] [PubMed] [Google Scholar]
- 41.Pulling L.C., Vuillemenot B.R., Hutt J.A., Devereux T.R., Belinsky S.A. Aberrant promoter hypermethylation of the death-associated protein kinase gene is early and frequent in murine lung tumors induced by cigarette smoke and tobacco carcinogens. Cancer Res. 2004;64:3844–3848. doi: 10.1158/0008-5472.CAN-03-2119. [DOI] [PubMed] [Google Scholar]
- 42.Boyd V.L., Zon G. Bisulfite conversion of genomic DNA for methylation analysis: protocol simplification with higher recovery applicable to limited samples and increased throughput. Anal. Biochem. 2004;326:278–280. doi: 10.1016/j.ab.2003.11.020. [DOI] [PubMed] [Google Scholar]
- 43.Olek A., Oswald J., Walter J. A modified and improved method for bisulphite based cytosine methylation analysis. Nucleic Acids Res. 1996;24:5064–5066. doi: 10.1093/nar/24.24.5064. [DOI] [PMC free article] [PubMed] [Google Scholar]
- 44.Wang Y., Zheng W., Luo J., Zhang D., Zuhong L. In situ bisulfite modification of membrane-immobilized DNA for multiple methylation analysis. Anal. Biochem. 2006;359:183–188. doi: 10.1016/j.ab.2006.09.001. [DOI] [PubMed] [Google Scholar]
- 45.Toyooka K.O., Toyooka S., Maitra A., Feng Q., Kiviat N.C., Smith A., Minna J.D., Ashfaq R., Gazdar A.F. Establishment and validation of real-time polymerase chain reaction method for CDH1 promoter methylation. Am. J. Pathol. 2002;161:629–634. doi: 10.1016/S0002-9440(10)64218-6. [DOI] [PMC free article] [PubMed] [Google Scholar]
- 46.Crocitto L.E., Korns D., Kretzner L., Shevchuk T., Blair S.L., Wilson T.G., Ramin S.A., Kawachi M.H., Smith S.S. Prostate cancer molecular markers GSTP1 and hTERT in expressed prostatic secretions as predictors of biopsy results. Urology. 2004;64:821–825. doi: 10.1016/j.urology.2004.05.007. [DOI] [PubMed] [Google Scholar]