


Abstract
Ribosomal protein L20 is crucial for the assembly of the large ribosomal subunit and represses the translation of its own mRNA. L20 mRNA carries two L20-binding sites, the first folding into a pseudoknot and the second into an imperfect stem and loop. These two sites and the L20-binding site on 23S ribosomal RNA are recognized similarly using a single RNA-binding site located on one face of L20. In this work, using gel filtration and fluorescence cross-correlation spectroscopy (FCCS) experiments, we first exclude the possibility that L20 forms a dimer, which would allow each monomer to bind one site of the mRNA. Secondly we show, using affinity purification and FCCS experiments, that only one molecule of L20 binds to the L20 mRNA despite the presence of two potential binding sites. Thirdly, using RNA chemical probing, we show that the two L20-binding sites are in interaction. This interaction provides an explanation for the single occupancy of the mRNA. The two interacting sites could form a single hybrid site or the binding of L20 to a first site may inhibit binding to the second. Models of regulation compatible with our data are discussed.
INTRODUCTION
Bacteria and phages have evolved extremely sophisticated mechanisms for adapting the level of gene expression to changes in growth condition or to specific needs at a given stage of their life cycle. Although transcription is the major level of regulation in these organisms, the number of genes shown to be regulated at the translational level has increased recently with the discovery of global translational regulators, small regulatory RNAs (sRNAs) and riboswitches (1). Most of the translational controls in prokaryotes take place at the step of initiation through three widely different mechanisms relying on trans-acting proteins, trans-acting RNAs (sRNAS) or cis-acting mRNA elements acting as direct sensors of the physical or chemical state of the cell (thermosensors or riboswitches).
Protein-mediated translational regulation is mainly negative, although phage studies have provided counterexamples (2,3). In Escherichia coli, the vast majority of the characterised protein-mediated translational controls are feedback regulation loops: the protein binds to its own mRNA, thereby inhibiting its translation. This is the case for most ribosomal proteins (r-proteins) that are often synthesized from long operons (4). In general, one cistron of the operon encodes a primary ribosomal RNA (rRNA)-binding protein that also binds to its own mRNA, thereby inhibiting its translation. The binding of this regulatory r-protein takes place at the translational operator, generally located close to the RBS of the first cistron. The inhibition of translation of the first cistron is transmitted downstream by translational coupling. Nomura and co-workers proposed that r-protein synthesis is coupled to that of rRNA: if rRNA synthesis increases, it titrates all free regulatory r-proteins causing a general derepression of r-protein synthesis (5). These authors also proposed that the regulatory r-proteins might recognize their rRNA- and mRNA-binding sites similarly (6). One such example of mimicry is found in the E. coli spc operon, which is regulated by r-protein S8 (7,8). The 3D structure of the S8 protein within the ribosome and associated with its operator clearly indicate that it recognizes its mRNA- and rRNA-binding sites in a similar manner (9).
A more complicated case of mimicry is illustrated by the rpmI-rplT genes encoding the two r-proteins L35 and L20, respectively. L20 directly represses the translation of the L35 cistron, and indirectly that of its own cistron by translational coupling (10). L20 binds to two distinct sites in its leader mRNA (11,12). The first site is a pseudoknot formed by a long-range base-pairing interaction between two nucleotide sequences, one located far upstream in the leader mRNA and the other immediately adjacent to the L35 cistron (Figure 1) (13). The second L20-binding site is an imperfect double-helical structure formed by base pairing of neighbouring nucleotide sequences (Figure 1). Importantly, both sites are required for control but each site is apparently able to bind to L20 when the other is inactivated by mutation (11). Both L20-binding sites on the mRNA are recognized similarly to the helix 40-41 junction of 23S rRNA (Figure 1). Also, NMR footprinting experiments indicate that the same region of L20 is responsible for the interaction with the two mRNA and the rRNA sites, i.e. L20 has only one RNA-binding site allowing the recognition of the three RNA structures (12,14). The presence of these two binding sites on the mRNA and only one binding site on the protein suggested either that L20 recognizes its mRNA as a dimer or that two monomeric L20 molecules bind independently to each of the mRNA sites. The present work investigates both the quaternary structure of L20 and the mechanism of its interaction with its own mRNA.
Figure 1.

Secondary structure of the mRNA leader region of the rpmI-rplT operon. (A) Model of the secondary structure of the rpmI translational operator (13). infC, iris (an acronym for infC-rpmI intergenic sequence) and rpmI sequences are italicized, uppercased and lowercased, respectively. Residues are numbered according to infC, iris and rpmI numbering. Every 10th residue is marked with a tick mark and every 50th nucleotide is numbered. Some of the relevant features of the operator (stems S1, S2 and t1 containing the t1 transcriptional terminator) are also indicated. The nucleotides forming the rpmI Shine–Dalgarno sequence are indicated by asterisks. (B) Schematic view of the pseudoknotted site 1. infC and iris sequences and the nucleotides forming the rpmI Shine–Dalgarno sequence are indicated as in (A). The long-range base-pairing interaction which holds the pseudoknot is schematized by two converging arrows starting from the separated interacting partners in (A). (C) Schematic view of site 2. infC and iris sequences are indicated as in (A). (D) Schematic view of the H40-H41 junction of E. coli 23S rRNA. The names of the mutations used in the fluorescent measurement experiments are indicated by arrows pointing to the substituting nucleotides in the schematic representations of the three L20–RNA-binding sites.
MATERIALS AND METHODS
Analytic gel filtration
The apparent molecular weight of L20C-ter was analysed using a Superdex 75 HR (10/30 - Amersham Biosciences) on Waters FPLC. The analytic gel filtration column was first standardized with gel filtration standards (Bio-Rad Laboratories) at a flow rate of 0.5 ml/min in 50 mM NaAc (pH 5.2), 500 mM Nacl. One hundred microgram of L20C-ter were loaded, alone or with gel filtration standards, on the Superdex 75 HR column and eluted with the same buffer at a flow rate of 0.5 ml/min. The eluted peaks were monitored at 280 nm. Escherichia coli L20C-ter was prepared and purified essentially as described for the C-terminal domain of Aquifex æolicus L20 (14).
Plasmid construction and preparation of transcripts containing the rpmI translational operator
Titration, pull-down and chemical probing experiments were performed with wild-type and mutant RNA transcripts containing all the sequences of rpmI translational operator. RNA transcripts were synthesized from NcoI-linearized plasmid pOT or mutant derivatives in in vitro transcription reactions using T7 RNA polymerase as described (11). All the mutations used in this study were first introduced in M13mp18MQ21ΔNB DNA (10) which carries all the cis-acting sequences (rpmI translational operator) required for the repression of rpmI by L20. Mutations 335infC and 78SIR were introduced in the operator sequences by site-directed mutagenesis with an oligodeoxynucleotide primer containing a single mutation as previously described (13). This oligodeoxynucleotide was used in prime synthesis of the complementary strand of the uracilated infective form of M13mp18MQ21ΔNB DNA, which was subsequently degraded after transformation of the appropriate E. coli strain by the resulting double-stranded mutated M13mp18MQ21ΔNB DNA (15). Mutations iris1AA, iris8-9UU, iris74-75UU and iris53-55 were introduced in the operator sequences as described (11) with two complementary mutant oligodeoxynucleotide primers, extended by Pfu DNA polymerase using the DpnI-cleavable replicative form of M13mp18MQ21ΔNB DNA as template. Construction of plasmids pOT and pOTiris53-55 by cloning the EcoRI-BamHI fragment of the replicative form of the appropriate M13mp18MQ21ΔNB DNA derivative downstream of a phage T7 promoter in pBlueScript-SK(+) has already been described (11). Plasmids pOT78SIR, pOT335infC, pOTiris1AA, pOTiris8-9UU, pOTiris74-75UU were constructed the same way in the present study. Plasmid pOTiris8-9UU/iris74-75UU was constructed by introducing mutation iris74-75UU in plasmid pOTiris8-9UU using the complementary primers method used above. Plasmid pOTiris53-55/335infC was constructed by cloning the StuI-BamHI fragment containing mutation iris53-55 from plasmid pOTiris53-55 in the same sites of plasmid pOT335infC.
Expression and purification of the tagged proteins
Escherichia coli DNA sequences corresponding to L20C-ter were PCR-amplified from pBL20ecΔN (16) using the following primers: (upstream) 5′-CACTAGTTCTAGAGCGGCCG and (downstream) 5′-CTCCCTCTTTCATGTGGTACCTGCCAGAGCTGCTTTC. The resulting DNA fragment was cloned in frame with the calmodulin-binding-peptide sequences (CBP-Tag) in the pCALc plasmid (Stratagene), between the XbaI and KpnI sites (underlined in the primer sequences) resulting in pCALcL20ecΔN allowing the overproduction of CBP-L20C-ter.
The His-Tag was added to the L20C-ter using the QuickChange site-directed mutagenesis kit (Stratagene) with two complementary primers carrying the His-Tag sequences and pET42aL20ecΔN as template. The pET42aL20ecΔN was constructed by cloning the BsrGI-XbaI carrying L20C-ter sequences from pBL20ecΔN into pET42a (Novagen).
For expression of the two tagged proteins, BL21(DE3) was grown at 37°C in LB medium supplemented with the appropriate antibiotics. When the A600 tubidity reached 0.5, L20ecΔN-Tag expression was induced by addition of 1 mM isopropyl-1-thio-β-d-galactopyranoside (IPTG), and protein production was allowed to proceed for 3 h. Cells were harvested by centrifugation, suspended in 800 mM LiCl, 150 mM MgCl2, 100 mM Tris-HCl, pH 7.5, 1 mM phenylmethanesulphonyl fluoride and disrupted by sonication. Cell debris were spun down and the soluble extract was diluted 3 times with equilibration buffer 250 mM NaCl, 50 mM NaAc, pH 5.2 to lower the ionic strength. The sample was first injected into a SP-Sepharose column (Hiload 26/10, Amersham Biosciences) equilibrated in equilibration buffer at 4°C and CBP-L20C-ter and His-L20C-ter were eluted using a 0.25–1.5 M linear NaCl gradient in the same buffer. The presence of CBP-L20C-ter and His-L20C-ter was monitored by analysing aliquots on SDS-PAGE. The pooled fractions (around 20 ml) were then precipitated by ammonium sulphate precipitation (70% saturated). The precipitates were resuspended in 2–3 ml of gel filtration buffer (500 mM NaCl, 50 mM NaAc, pH 5.2) and loaded on Superdex 75 prep-grade (26/60 Amersham-Biosciences) equilibrated at 4°C in the same buffer. The purified proteins were then dialyzed overnight at 4°C against 250 mM NaCl, 50% glycerol, 50 mM potassium phosphate, pH 7.5.
Affinity separation essays
Affinity separation assays were realized in batches. First, 75 pmol of the appropriate operator RNA (wild type or iris8-9/iris 74-75 mutant) in SBII buffer (120 mM NH4Cl, 20 mM Tris-acetate, pH 7.5) was denatured by heating at 85°C for 2 min followed by immediate cooling in ethanol containing solid CO2. Samples were thawed on ice and an appropriate volume of SBM6 buffer (60 mM NH4Cl, 60 mM Mg-acetate, 36 mM β-mercaptoethanol, 10 mM Tris-acetate, pH 7.5) was added. His-L20C-ter (75 pmol) and CBP-L20C-ter (75 pmol) were added to the RNA and incubated 15 min at 37°C. The L20/operator RNA molecular ratio was 2. The mixture was adsorbed to a TALON metal affinity resin (BD-Biosciences) in a final volume of 100 μl, equilibrated with activation buffer (60 mM NH4Cl, 10 mM Mg-acetate, 6 mM β-mercaptoethanol, 10 mM Tris-acetate, pH 7.5.) and 20 µg of bovine serum albumin (Sigma). Incubation was at room temperature for 30 min under gentle agitation. The beads were spun down by centrifugation (2 min at 1000 r.p.m.), the unbound material was removed and saved for analysis. The beads were washed 2 times with 3 volumes of washing buffer (120 mM NH4Cl, 10 mM Mg-acetate, 6 mM β-mercaptoethanol, 10 mM Tris-acetate, pH 7.5). The tagged-protein were then eluted using 200 µl of elution buffer (120 mM NH4Cl, 10 mM Mg-acetate, 6 mM β-mercaptoethanol, 100 mM imidazole, 10 mM Tris-acetate, pH 7.5). All the fractions were precipitated with TCA 50% for protein analysis on SDS-PAGE or with 300 mM (final concentration) Sodium-acetate and 2.5 volumes of ethanol for RNA gel analysis in 7 M urea. For the affinity separation assays using the Calmodulin Sepharose 4B resin only the CBP-L20C-ter (150 pmol) was incubated with appropriate operator RNA using the same molecular ratio as above. SBM6, activation and washing buffers were supplemented with 1.5 mM CaCl2. The CBP-L20C-ter was eluted using 200 µl of 1 M NaCl, 10 mM EDTA, 10 mM β-mercaptoethanol, 50 mM Tris-HCl, pH 8.0.
Fluorescence anisotropy titrations of L20C-ter by wild-type and mutant forms of the rpmI translational operator
The RNA transcripts used in this study contain either wild-type or mutant operator RNAs containing mutations in either L20-binding site or in both sites 1 and 2. The RNA transcript carrying the wild-type rpmI translational operator is transcribed from plasmid pOT. The RNA transcripts carrying mutant site 1 and site 2 are transcribed from plasmids pOTiris74-75UU containing Airis74 to U and Airis75 to U mutations and pOTiris8-9UU containing Airis8 to U and Airis9 to U mutations, respectively. The RNA transcripts carrying mutations in both sites 1 and 2 are transcribed from plasmids pOTiris8-9UU/iris74-75UU and pOTiris53-55/335infC, respectively. 23S rRNA was phenol-extracted from purified 50S ribosomal particles prepared from wild-type E. coli strain IPBC6801 using a published procedure (17). L20C-ter labelling with the NHS ester of Alexa488 and anisotropy measurements were carried out as already described (12). The concentration of the L20C-ter-Alexa488 was 3.4 nM in all titration experiments. Buffer conditions were 20 mM Tris-HCl, pH 7.5, 50 mM KCl, 2.5 mM MgCl2, 1 mg/ml Bovine serum albumin and anisotropy measurements were carried out at 21°C.
Fluorescence correlation spectroscopy
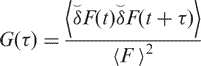
Correlation profiles were calculated from the fluorescence traces, by defining the fluorescence fluctuations as δ F(t) = F(t) – 〈 F 〉, where F(t) is the fluorescence intensity measured at time, t, and 〈 F 〉 denotes the time-averaged fluorescence intensity. These fluctuations are then time correlated to generate an autocorrelation function G(τ), defined as
 |
1 |
with τ, being lag time. The intensity fluctuations are assumed to be directly related to fluctuations in the concentration of the fluorescent molecules in the illuminated volume and can be expressed as:
| 2 |
where  denotes the profile of the excitation volume (usually the laser-beam profile), δc the concentration fluctuation around the average concentration, and A, a constant. The concentration fluctuations are induced by a number of mechanisms, the most studied one being diffusion of fluorescent molecules in and out of the small excitation volume. For an ideal case of monodisperse, uniformly bright, and freely diffusing fluorescent molecules, a closed form expression for Equation (1) was derived
 |
3 |
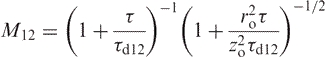
which is commonly used to analyse measured autocorrelation functions, more precisely extract two parameters: the diffusion time, τd, and the average number of molecules, N. Here, it is assumed that the fluorescent molecules are excited by a 3D Gaussian beam,
| 4 |
characterized by ro, and zo, respectively the 1/e2 gaussian intensity beam waists in the radial and axial dimensions as defined by the direction of the laser beam. The extrapolated value of the autocorrelation function in Equation (1) at τ = 0 can be rewritten as:
| 5 |
where Veff is an effective observation volume (18).
In principle, the diffusion time τD can be used to calculate the diffusion coefficient D, given the radius of the Gaussian excitation profile, the factor 8 arising from the two-photon excitation.
| 6 |
The radius of the diffusing particle rh can then be calculated through the Stokes–Einstein relation assuming a sphere,
| 7 |
The radius of spherical molecules is the hydrodynamic radius, rh, which can be related to the molecular weight, M (g/mol), Avogadro's number, N (molecules/mol) and the hydrated volume, Vh, of the protein (∼1.03 cm3/g).
 |
8 |
In Equation (7) kb denotes the Boltzmann constant (1.38 × 10⁻²³ kg·m2· s−2· K−1), T, temperature in Kelvin, and η, the solvent viscosity. The viscosity of water at 20°C is ∼1 cp (10−3 Pa·s or 10−3 kg·m−1s−1). It should be noted, however, that the cube root dependence on the molecular weight renders the diffusion time somewhat insensitive to small changes in molecular weight. For example, an 8-fold difference in molecular weight yields only a 2-fold difference in diffusion time. Thus it is difficult to distinguish monomer–dimer equilibria.
Fluorescence cross-correlation
If one can simultaneously excite particles labelled with fluorophores emitting at two very different wavelengths, then it is possible to determine whether the fluctuations are correlated in time, by cross-correlating the fluorescence fluctuations from two different emission channels, i and j. Such simultaneous excitation of dyes emitting at very different wavelengths is possible using two-photon excitation because the selection rules for two-photon excitation are quite different from those that pertain under normal one-photon excitation. In this case, the cross-correlation function then becomes:
 |
9 |
| 10 |
where C1, C2 and C12 are the concentrations of the free and interacting species, respectively and M12 is the term describing the diffusion of the complex.
 |
11 |
The autocorrelation functions from each of the channels can be expressed as
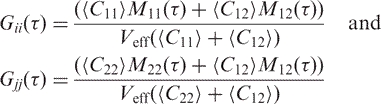 |
12 |
If the two fluorescent species are non-interacting and hence do not diffuse together, then the fluctuations in intensity due to their number fluctuations will be entirely uncorrelated. In this case, the M12 term is null and the cross-correlation function will be zero at all times. If on the other hand, the two fluorescent species are in complex with each other, then their fluctuations will be 100% correlated, and the amplitude of the cross-correlation function will reach that of the lower of the two autocorrelation functions. An explanation of auto and cross-correlation is given in (19).
FCS and FCCS measurements were carried out using a system set-up in house based on excitation with a Mai Tai ifs pulsed titanium sapphire laser set at 780 nm. The excitation power was 10–15 mW at the microscope entrance. The microscope was a Zeiss Axiovert 200 with a 700DCSXR dichroic mirror and an extra E700SP (both from Chroma Corp, Battlesborough NH) to eliminate the exciting infrared light from the scope output. The emission was measured using the 2 channel Alba Fluorescence Correlation Instrument from ISS, Inc (Champaign Il). The red and green emission were separated by a 565LP dichroic mirror and the red channel was outfitted with a 675/50 bandpass filter while the green channel had a 525/50 bandpass filter (Chroma, Corp) to further isolate the appropriate emission. The Alba detectors were low dark noise avalanche photodiodes. The effective excitation volume was assumed to be Gaussian and was calibrated using a solution of fluorescein of known concentration, to exhibit a value of ro of 0.32 μm and of zo of 0.8 μm.
DMS, kethoxal and CMCT chemical probing experiments
DMS, kethoxal and CMCT were used to perform nucleotide modification on RNA transcripts containing the wild-type and mutated (335infC, 78SIR, iris1AA and iris53-55 mutations) forms of rpmI translational operator. First, the operator (500 fmol) was denatured by heating at 80°C for 3 min followed by immediate cooling in ethanol containing solid CO2. Samples were thawed on ice and then brought to a concentration of 55 nM in 9 ml of either DK buffer (50 mM Na-cacodylate pH 7.5) for DMS and kethoxal modification or CMCT (50 mM Na-borate pH 8.0) buffer for CMCT modification. The samples were incubated at 25°C for 10 min and received 1 ml of either DK buffer or CMCT buffer containing 1 mg of Lactococcus lactis 23S rRNA. Nucleotide modifications were carried out at 25°C by addition of 1 μl of either DMS (1/30 dilution in ethanol) or kethoxal (40 mg/ml in ethanol 20%) or CMCT (100 mg/ml in CMCT buffer). Reaction times were 5 min with DMS and kethoxal and 10 min with CMCT. Reactions were stopped by ethanol-precipitation and modified nucleotides were determined by extension of 5′end-labelled rpmI84 or DEL2 oligonucleotide primer and subsequent gel electrophoresis essentially as described (13). The gels were scanned using a PhosphorImager (Molecular Dynamics). Nucleotide modifications were detected by primer extension assays using DEL2 and rpmI84 oligodeoxynucleotide primers which permit to assess the reactivities of residues located in stem S1 and the 5′ strand of stem S2 and in site 2 and the 3′ strand of stem S2, respectively. The sequences and complementarities of the primers are as follows: rpmI84 primer (5′GGTCAGAATGTGACGCAG3') is complementary to positions 102 to 85 in rpmI and DEL2 primer (5′GTCTTTCACGCGCTTAAGCACTTCC3’) is complementary to positions 450 to 426 in infC with a single-nucleotide mismatch at position 438.
RESULTS
The L20C-ter-binding affinities to its operator RNA
Protein L20 is composed of two domains (20–22). The globular C-terminal domain is located at the surface of the large ribosomal subunit and binds to the junction between helices 40 and 41 of domain II of 23S rRNA (numbering of 23S rRNA domains is according to the diagram of the E. coli 23S rRNA secondary structure available at http://www.rna.icmb.utexas.edu). In contrast, the N-terminus of L20 is an extremely long extension that penetrates deeply in the core of the large ribosomal subunit contacting several quite distant sequences in domains I and II of 23S rRNA. In the subunit, the extension is alpha-helical, whereas it is unfolded when L20 is in solution isolated from the subunit (23). Interestingly, the N-terminal extension can also be found, when L20 is isolated, both under a folded and partially unfolded form (24) indicating that the unfolded form is in equilibrium with the folded form that can be stabilized either by contacts with the rRNA or by crystal packing.
Prior work has shown that the isolated C-terminal globular domain is able to control the synthesis of L35 with a level of efficiency similar to that of the whole protein in vivo (16). Moreover, the binding of the C-terminal domain of L20 to both of its mRNA sites is apparently indistinguishable from that of the whole protein as assayed either by L20-induced reverse transcriptase stops or by protection against diverse chemical probes (11). These results indicate that the N-terminal domain is not required for control. Therefore, to avoid the aggregation tendency of the full-length protein, we used exclusively the globular C-terminal domain of L20 (L20C-ter) in the following experiments.
We first measured the affinity with which the L20C-ter domain binds to wild-type or mutant operator RNAs using fluorescence anisotropy based titrations. Fluorescence anisotropy is proportional to the average rotational correlation time, which increases with size. In our experiments, we labelled L20C-ter with the Alexa488 fluorophore at relatively low pH, conditions under which only the N-terminal amine is reactive (see under Materials and Methods section). The different RNAs used (see Figure 1) were synthesised in vitro with T7 polymerase as described earlier (11) and titrated onto the fluorescently labelled L20C-ter. The increase in anisotropy as a function of increasing RNA was measured for the different RNAs tested (Figure 2). The wild-type operator RNA binds to L20C-ter with a Kd of 19 nM (Figure 2). We also measured the binding affinity of L20C-ter to 23S rRNA extracted from the 50S ribosomal subunit and found a Kd of 6 nM, i.e. an affinity about three times higher than for the operator. Titration of L20C-ter with four different mutant operator RNAs bearing the nucleotide changes indicated in Figure 1 yielded intriguing results. While mutations at only one of the two operator sites resulted in a limited effect on binding: no effect for AA to UU change at positions iris 74 and iris 75 in site 1 or a 2-fold increase of the Kd for AA to UU change at positions iris 8 and iris 9 in site 2, simultaneous mutation of both sites resulted in a 10-fold decrease in affinity.
Figure 2.

Determination of the affinity of L20C-ter for its mRNA- and rRNA-binding sites. The fluorescence anisotropy titration curves for wild-type and mutant operator RNAs are shown in (A). The equivalent titration curves for the 23S rRNA are shown in (B) where the left and right ordinates are for anisotropy measurements performed with 23S rRNA and wild-type operator RNA, respectively.
L20C-ter forms a monomer in solution
As mentioned above, regulation might be explained if L20 dimerizes with each monomer binding to one L20-binding site on the mRNA. We thus investigated the association state of L20C-ter in absence of operator RNA with two different sets of experiments.
We first used gel filtration on an analytical Superdex 75 HR column. The elution profile (Figure 3) clearly shows that in the concentration range used, L20C-ter behaves as a 6.5 kDa protein which corresponds well to the predicted molecular weight of the isolated domain, which is of 6.8 kDa (with the N-terminal methionine).
Figure 3.

Oligomerization state of L20C-ter: gel filtration analysis. The elution profile of the Superdex 75 HR column is shown with a continuous line for the exclusion volume (peak 1) and for the 3 standards (peaks 2, 3 and 4 corresponding to 44, 17 and 1.35 kDa, respectively). The elution profile of L20C-ter is shown with a dotted line. The calibration curve is shown in the insert where Log MW is the logarithm of the molecular weight and Kav = (Ve − Vd)/(Vt − Vd) where Ve is the elution volume, Vd the dead volume (8 ml), Vt the total volume (24 ml). The dotted line in the insert shows the Kav of L20C-ter from which its molecular weight was calculated.
We also probed the quaternary structure of L20C-ter with a more reliable method working at equilibrium. We performed Two-Photon Excitation Fluorescence Correlation Spectroscopy (TPE-FCS) and Fluorescence Cross Correlation Spectroscopy (TPE-FCCS) on two fluorescently labelled derivatives of L20C-ter, L20C-ter-Alexa488 (green dye detected in channel 2) and L20C-ter-Atto647 (red dye detected in channel 1). We performed FCS measurements on a solution containing both L20C-ter-Alexa488 and L20C-ter-Atto647, each at a nominal concentration of 150 nM. The FCS methods measure the fluorescence fluctuations due to the diffusion of single fluorescent molecules in a small volume (calibrated to be 0.1 fl) excited by a laser beam. The results are expressed as an autocorrelation function, which is related to the probability of finding a molecule in the excited volume at time τ, given it was there at time τ = 0. Because, the molecule remains in the excited volume a limited time, the autocorrelation function decreases as τ increases. The slower the diffusion, the longer the molecule remains in the excited volume, which shifts the correlation function to longer times. Figure 4 shows the autocorrelation curves of L20C-ter-Alexa488 (CH2, open symbols) and L20C-ter-Atto647 (CH1, dots). Adequate analysis of these profiles required two diffusion times (see under Materials and Methods section). For the L20C-ter labelled with the red dye, we recovered a diffusion coefficient of 164 μm2/s that accounted for the diffusion properties of 83.5% of the molecules, and 16.5% of a slow component, ∼10 μm2/s, that likely corresponds to some aggregated protein (Table 1). For the L20C-ter labelled with the green dye, we recovered a diffusion coefficient of 176 μm2/s that accounted for 93.3% of the molecules, indicating that this protein preparation had a very low degree of aggregation. The expected diffusion coefficient for a spherical protein of 6 kDa, is 167 μm2/s, quite close to the values recovered from the analysis of the data. The concentration of the two proteins in solution can be calculated from the amplitude of the autocorrelation functions at time zero. Since L20C-ter exhibits a tendency to adhere to the microscope slide (even in presence of 1 mg/ml BSA), the actual solution concentrations are lower than the nominal 150 nM. For the L20C-ter-Atto647, the concentration was found to be 115 nM, whereas for the L20C-ter-Alexa488, it was significantly lower, 66 nM (Table 1).
Figure 4.

Oligomerization state of L20C-ter: FCS measurements. L20C-ter-Alexa488 and L20C-ter-Atto647 were at a nominal concentration of 150 nM each. Open circles correspond to the autocorrelation profiles obtained from the data collected on channel 2 (corresponding to L20C-ter-Alexa488 emission) and dots correspond to the autocorrelation profiles calculated from the data collected in channel 1 (corresponding to L20C-ter-Atto647 emission). The crosses correspond to the cross-correlation profile between the fluctuations in channel 1 and channel 2. Buffer conditions are as described in the Materials and Methods section. Lines through the points correspond to the fits of the data as described in the text and for which the results are given in Table 1.
Table 1.
Diffusion parameters and nominal versus calculated L20C-ter concentrations
| L20C-ter- Alexa488 (green, CH2) [Nominal] (nM) | L20C-ter- Atto647 (red, CH1) [Nominal] (nM) | Operator RNA [Nominal] (nM) | D1 (μm2/s) | %D1 | D2 (μm2/s) | 〈 D 〉 *(μm2/s) | Concentration calculated from G(0) (nM) |
|---|---|---|---|---|---|---|---|
| 150 | 150 | 0 | 164 – CH1 | 83.5 | 10.4 | 139 | 115 – CH1 |
| 176 – CH2 | 93.3 | 10.4 | 171 | 66 – CH2 | |||
| 150 | 0 | 0 | 170 – CH2 | 91 | 22 | 157 | 81 – CH2 |
| 150 | 0 | 150 | 170 – CH2 | 58 | 22 | 109 | 78 – CH2 |
| 150 | 150 | 150 | 170 – CH2 | 76 | 22 | 124 | 81 – CH2 |
| 0 | 150 | 0 | 151 – CH1 | 79 | 15 | 122 | 121 – CH1 |
| 0 | 150 | 150 | 151 – CH1 | 48 | 15 | 80 | 107 – CH1 |
| 150 | 150 | 150 | 151 – CH1 | 63 | 15 | 100 | 217 – CH2 |
| 300 | 0 | 0 | 162 | 96 | 16 | 156 | 145 – CH2 |
| 300 | 0 | 300 | 162 | 51 | 16 | 90 | 149 – CH2 |
| 300 | 300 | 300 | 162 | 71 | 16 | 120 | 183 – CH2 |
| 0 | 300 | 0 | 176 | 84 | 17 | 150 | 302 – CH1 |
| 0 | 300 | 300 | 176 | 39 | 17 | 73 | 237 – CH1 |
*The average diffusion coefficient was calculated as the fractionally weighted mean of the two recovered values (e.g. 139 = (164 × 0.835) + (10.4 × 0.165)).
Although the diffusion coefficients obtained from the analysis of the autocorrelation profiles are consistent with monomeric L20C-ter, the relatively low sensitivity of translational diffusion to changes in molecular weight does not allow us to conclude beyond a doubt that L20C-ter does not form dimers. Cross-correlation analysis, on the other hand, is much more sensitive to molecular association, since it is essentially a zero background measurement. Fluorescence cross-correlation spectroscopy measures the coincidence of the signals coming from two differently labelled molecules emitted in the same excitation volume. The amplitude of the cross-correlation signal will be zero at all times in absence of association. Thus, for example, if L20C-ter were a dimer under the conditions of our experiments, then using a mixture of red and green labelled L20C-ter preparations, at least 50% of the particles should present both red and green fluorescence, and hence, a cross-correlation amplitude at time zero equal to half the amplitude of the lowest amplitude autocorrelation function. As can be seen in Figure 4, the amplitude of the cross-correlation function is zero, indicating that there are no interactions between the green and red labelled L20C-ter, definitively ruling out a dimerization of the protein in the 50–150 nM concentration range.
Stoichiometry of L20C-ter binding to its operator RNA studied with affinity separation
The above experiments exclude the possibility that L20C-ter binds to the operator RNA as a preformed dimer but do not exclude that two L20C-ter molecules bind to the same operator. To analyse this possibility, we used an affinity separation method. We first tagged the N-terminal end of L20C-ter either with 6 His (His-L20C-ter) residues or with the calmodulin binding peptide (CBP-L20C-ter). Then, the in vitro synthesized wild-type operator RNA was mixed with stoichiometric amounts of His-L20C-ter and CBP-L20C-ter (all at a concentration of 750 nM, well over the Kd). The RNA–protein mixture was adsorbed onto Co++-sepharose beads (see Materials and Methods section for details), which specifically binds His-L20C-ter. The non-adsorbed, washed and eluted material was then analysed on both RNA and protein gels. The eluted material is expected to contain His-L20C-ter and anything bound to it. If only one molecule of L20C-ter binds to the operator RNA, the only eluted material should be His-L20C-ter and RNA. If the operator RNA binds two L20C-ter molecules, the eluted material should contain RNA and both His-L20C-ter and CBP-L20C-ter. The two differently tagged L20C-ter derivatives should be detected as two bands on an SDS-PAGE because of their difference in molecular weight.
Figure 5A shows that the wild-type operator RNA, if adsorbed alone on the sepharose beads, is mainly found in the flow-through (FT; Figure 5A, lane 4) and only very marginally in the eluate (E; Figure 5A, lane 6), whereas, in the presence of His-L20C-ter, the RNA is found in much larger quantities in the eluate (E; Figure 5A, lane 3). This indicates that the operator RNA is retained on the beads through its interactions with His-L20C-ter. The binding of the operator RNA is specific since, if an operator RNA in which the two L20-binding sites are mutated is used along with the His-L20C-ter instead of a wild-type operator RNA, the RNA is found mainly in the flow-through (FT; Figure 5B, lane 4) and only marginally in the eluate (E; Figure 5B, lane 6). We repeated the experiments of Figure 5B with calmodulin-sepharose using the CBP-L20C-ter protein with wild-type or mutant operator RNA. Again, the binding of the operator RNA to the CBP-L20C-ter is specific since, if an operator RNA bearing the two mutated L20-binding sites is used instead of a wild-type operator, the RNA is found mainly in the flow-through (FT; Figure 5C, lane 4) and only marginally in the eluate (E; Figure 5C, lane 6). The SDS-PAGE analysis of the different fractions shows that if His-L20C-ter and CBP-L20C-ter are adsorbed to the Co++-sepharose beads in the absence of operator RNA, the only eluted material is His-L20C-ter (E; Figure 5D, lane 3) as expected if L20C-ter is monomeric. In the presence of operator RNA, the eluted material (E; Figure 5D, lane 6) contains only His-L20C-ter and no CBP-L20C-ter, indicating that His-L20C-ter and CBP-L20C-ter do not bind together to the operator RNA. This in turn indicates that the stoichiometry of binding is one L20C-ter per operator RNA.
Figure 5.

Affinity separation experiment. (A), (B), and (C) show RNA gels. In (A), wild-type operator RNA was adsorbed to the Co++-sepharose beads in the presence of His-L20C-ter (lanes1, 2, 3) or in its absence (lanes 4, 5, 6). FT, W, E stand for flow-through, wash and elution, respectively. In (B), His-L20C-ter was adsorbed to the Co++-sepharose beads in the presence of either wild-type (lanes 1, 2, 3) or mutant operator RNA (lanes 4, 5, 6). In (C), CBP-L20C-ter was adsorbed to the calmodulin-sepharose beads in the presence of either wild-type (lanes 1, 2, 3) or mutant operator RNA (lanes 4, 5, 6). (D) shows a protein gel where His-L20C-ter and CBP-L20C-ter were adsorbed to the Co++-sepharose beads in the absence (lanes 1, 2, 3) or presence (lanes 4, 5, 6) of wild-type operator RNA.
Stoichiometry of L20C-ter binding to its operator RNA studied with fluorescence correlation
In order to prove that only one L20 molecule binds to its operator RNA at equilibrium, we probed the interaction of the labelled L20C-ter-Alexa488 and L20C-ter-Atto647 with the operator RNA using fluorescence cross-correlation. In Figure 6A and B are shown the autocorrelation profiles for these two labelled proteins at a nominal concentration of 150 nM in absence and in presence of 150 nM operator RNA. Profiles in Figure 6A derived from channel 2 (L20C-ter-Alexa488, green dye) while those for Figure 6B were calculated from the data obtained on channel 1 (L20C-ter-Atto647, red dye). The profiles have been normalized for direct comparison of the diffusion timescales. The large shift to longer times of the autocorrelation curve in presence of operator RNA indicates that both of the labelled proteins bind to the operator. Increasing RNA concentration did not result in any further shifts indicating that the protein was saturated with RNA under these conditions.
Figure 6.

FCS measurements. Combinations of L20C-ter-Alexa488, L20-ter-Atto647 and operator RNA at a nominal concentration of 150 nM each were used. (A) and (B) Normalized autocorrelation profiles for channel 2 (L20C-ter-Alexa488) and channel 1 (L20C-ter-Atto647). Dots correspond to the protein alone in (A) L20C-ter-Alexa488 and (B) L20C-ter-Atto647. Triangles correspond to data obtained after the addition of the RNA. Crosses correspond to the autocorrelation profile obtained after addition of 150 nM of (A) L20C-ter-Atto647 to the L20C-ter-Alexa488/RNA complex and (B) L20C-ter-Alexa488 to the L20C-ter-Atto647/RNA complex. (C) and (D) auto correlation profiles from channel 1 (dots), channel 2 (open circles) and cross correlation profiles (crosses) obtained for the solutions in which (C) 150 nM of L20C-ter-Atto647 was added to the L20C-ter-Alexa488/RNA complex at a concentration of 150 nM and (D) 300 nM of L20C-ter-Atto647 was added to the L20C-ter-Alexa488/RNA complex at a concentration of 300 nM. Buffer conditions are as described in the Materials and Methods section. Lines through the points correspond to the fits of the data as described in the text and for which the results are given in Table 1.
The autocorrelation profiles, both in absence and in presence of operator RNA, were best fit with a model including two diffusion coefficients. We must caution that there is a great deal of uncertainty associated with the parameter values recovered from fits of autocorrelation profiles to a model including two diffusing species. This uncertainty arises due to the correlations between the fractional contributions and the diffusion times in the fit. In order to compare results under various conditions, we have linked the values of the diffusion coefficients in a global analysis of the data (Table 1). We have also calculated the average diffusion coefficient as the weighted average of the two recovered diffusion coefficients. Addition of operator RNA to either of the labelled proteins results in a significant decrease in the fractional contribution of the fast diffusing species, from 91 to 58% and from 79 to 48%, respectively for the L20C-ter-Alexa488 and the L20C-ter-Atto647 samples. This corresponds to a decrease of 31 and 34% respectively of the average diffusion coefficient. The value of the larger diffusion coefficient, as noted for the free proteins, is consistent with what would be expected for a protein the size of the L20C-ter. It is unclear why in presence of saturating operator RNA two species are required to fit the curves. One possibility is the shape of the protein/RNA complex, which if not spherical, would present rapid diffusion along particular axes. Alternately, a certain fraction of the protein could be inapt for RNA binding. The average for all samples of the average diffusion coefficient obtained for free protein regardless of concentration or dye was 151 ± 18 μm2/s. The overall average diffusion coefficient for the complex, 88 ± 16 μm2/s (a decrease of 42% compared to the free protein) was calculated from the values obtained from fits of the data from solutions containing L20C-ter labelled with a single dye and equal nominal concentration of operator RNA to ensure saturation.
In any case, upon addition of 150 nM L20C-ter labelled with the other dye, the autocorrelation profiles of the green L20C-ter (in presence of red L20 and operator RNA) or the red L20C-ter (in presence of green L20C-ter and operator RNA) shift back to faster timescales compared to the profiles of a single labelled species in presence of RNA (Figure 6A and B). The global analysis (Table 1) confirms that the fraction of rapidly diffusing species (free protein) increases when the L20C-ter-Atto647 is added to the L20C-ter-A488/RNA complex and vice versa. Hence the red L20C-ter competes against the green L20C-ter and vice versa for binding to the operator RNA. This also means that the RNA is saturated with protein under these conditions, since the added protein would otherwise simply bind to any free RNA present, rather than compete. L20C-ter-Atto647 appears to compete somewhat more efficiently that the L20C-ter-Alexa488, but this is likely due to the difference in real concentration between the two. In addition, titration experiments revealed that the affinity of the two differently labelled proteins for operator RNA is the same (data not shown). For the same nominal protein concentration, L20C-ter-Atto647 always yields a higher measured concentration in solution (last column Table 1) due to differences in the adhesion of the labelled proteins to the slide. We repeated the assay at 300 nM nominal concentration of all the components and observed the same behaviour, that is to say competition between the L20C-ter molecules labelled with different dyes (Table 1). Thus, rather than concomitant binding of both species to the operator RNA, which likely would have yielded little if any change in the apparent diffusion profile, the addition of red labelled L20C-ter to the green L20C-ter/operator RNA complex (and vice versa) led to a replacement of the protein labelled with one colour by the other. Both proteins are present at concentrations well over the Kd [see Table 1, concentrations calculated from G(0)] and the RNA is saturated with protein (since one colour competes the other). Thus, these results are highly indicative that two L20 molecules do not bind to the operator RNA simultaneously.
Definitive support for a 1:1 L20/operator RNA complex stoichiometry comes from examination of the cross-correlation profiles obtained in presence of L20C-ter-Alexa488, L20C-ter-Atto647 and operator RNA. In Figures 6C and D, we show the autocorrelation profiles for channel 2 (L20C-ter-Alexa488) and channel 1 (L20C-ter-Atto647), as well as the cross-correlation profiles between the two channels for solutions containing 150 nM (Figure 6C) or 300 nM (Figure 6D) nominal concentrations of all three components (see Table 1, last column for real concentrations). The amplitude of the cross-correlation functions in both cases is very close to zero at all times, indicating that very few operator RNA molecules are bound by both red and green L20C-ter. If the L20C-ter/operator RNA complex stoichiometry were 2:1, then under our saturating conditions, a significant fraction of the complexes (in principle as much as 50%) should contain both red and green labelled L20 molecules, giving rise to a significant amplitude for the cross-correlation function. This is clearly not the case. We thus conclude that the stoichiometry of the L20C-ter/operator RNA complex is 1:1.
Secondary structure probing of wild-type and mutant L20–mRNA-binding sites 1 and 2 reveals long-range interaction between the two sites
Considering that the operator RNA has two potential L20-binding sites, we found quite puzzling the above results indicating that the stoichiometry of L20/operator RNA complex is 1:1. We thought that a possible explanation was that the two sites are either close together or even interact, therefore not allowing simultaneous binding of L20. We suspected that an interaction between the two L20–mRNA-binding sites might be detected with RNA probing experiments.
The secondary structure of the region located between position 214 of infC and position 10 of rpmI (for each gene, position 1 is the first nucleotide of the initiation codon) was investigated in wild-type operator RNA and in operators containing mutations destabilizing either site 1 or site 2. Structural investigation was carried out using DMS, CMCT and kethoxal as chemical probes for Watson–Crick positions of A and C residues, G residues, and U and G residues, respectively (25–27). Mutations of complementary nucleotides in both sites were used separately in order to ensure that a change in reactivity of a given nucleotide is not the result of the formation of artifactual interaction with mutant(s) nucleotide(s). Mutation of each partner of the GinfC335-Ciris78 base pair in stem S2, the key stem holding the pseudoknotted site 1 (Figure 7B, mutations 1 and 2), was used to examine whether it could affect the reactivity of nucleotides forming site 2. Vice versa, mutations of Giris1 and Giris2 in the 5′ strand of the lower helix of site 2 and mutations of Giris53, Ciris54 and Ciris55 in the 3′ strand (Figure 7C, mutations 3 and 4) were used to evaluate their effect on the reactivities of nucleotides forming site 1. Note that all four mutations result in destabilization of the cognate site and in the consequent loss of repression of rpmI expression by L20 (12,13). As shown in Figure 7, an interesting result is the effect of mutations iris1AA and iris53-55 (mutations 3 and 4) in site 2 which both increase the reactivity of residue UinfC345 (marked with a large star in Figure 7B) located at the connection of the two halves of stem S1 in site 1 (see lanes CMCT3− and CMCT3+ and lanes CMCT4− and CMCT4+ in Figure 7A, which correspond to mutations iris1AA and iris53-55, respectively). All the other detected changes in nucleotide reactivities are due to local destabilization of the sites 1 and 2, i.e. an increase in reactivity of residues located in the same site as the mutated residue. This is clearly the case for residues UinfC332, GinfC335 and UinfC341 in site 1 (Figure 7A). Other residues (data not shown) also display increased reactivities which are due to local destabilization of the sites: Airis72, UinfC76, and Giris82 in site 1 and AinfC542, AinfC543, Giris1, Giris2, Giris53, Uiris56, Uiris57, Uiris58 and Giris59 in site 2 (see Figure 7B for site1 and Figure 7C for site 2).
Figure 7.

Localization of the nucleotide residues displaying increased reactivities towards chemical probes upon mutations in either site 1 or site 2. (A) Gel view showing the result of cDNA extension analysis spanning the infC318-infC354 region of the operator RNA. Extension analysis was performed using DEL2 oligodeoxynucleotide on modified wild-type (WT) or mutant (1: 335infC, 2: 78SIR, 3: iris1AA and 4: iris53-55) operator RNA. The chemicals (DMS, KET and CMCT) used for modification are shown beneath the corresponding lanes. Lane −, unmodified operator; lane +, modified operator. The primary structure of the infC318-infC354 region of the operator is shown on the right of the gel. U, G, C, A are sequencing lanes. Bands corresponding to increased reactivities induced by long-range destabilization and position of the corresponding modified nucleotide in the primary structure shown on the right of the gel view are indicated by filled triangles. (B) Schematic view of the pseudoknotted site 1. infC and iris sequences and the nucleotides forming the rpmI Shine–Dalgarno sequence are indicated as in the legend to Figure 1. The positions and substituting nucleotides of mutations 1 and 2 are indicated by arrows. Residues displaying increased reactivities due to local destabilization are within squares whereas the residue showing increased reactivity due to long-range destabilization is within circle and marked with a large star. The mutations inducing increased reactivities are indicated by their numbers in parenthesis. (C) Schematic view of site 2. infC and iris sequences are indicated as in the legend to Figure 1. The positions and substituting nucleotides of mutations 3 and 4 are indicated by arrows. Residues displaying and mutations inducing increased reactivities are indicated as in B.
A surprising finding is that the mutations in site 1 (involving two nucleotides which base pair in the long-range interaction forming stem S2) have no detectable effect on the structure of site 2, whereas the two mutations of site 2 investigated have a strong and localized effect on site 1. This non-reciprocity could be due to either insufficient distortion of site 1 by the two point mutations used in the present study (both are single mutations whereas site 2 mutations are multiple) or no effect at all of site 1 on site 2 structure. A more appealing explanation would be that the non-reciprocity is explained by the fact that site 1 requires site 2 to be stabilized or to gain the adequate shape allowing regulation, whereas site 2 does not.
In conclusion, the results provided by probing the secondary structure of site 1 and site 2 clearly indicate that destabilization of site 2 by mutation on both strands of the lower helix induces a long-range effect on the stability of stem S1 in site 1.
DISCUSSION
L20-binding affinities and comparison with other systems
As mentioned above, the globular C-terminal domain of L20 is able to repress the translation of the first cistron of the rpmI-rplT operon encoding L35 with about the same efficiency as the full-length protein (16). L20C-ter binds to its wild-type operator RNA with an affinity of 19 nM. Taken together these results indicate that the 19 nM affinity is sufficient to ensure appropriate regulation. The affinities of several control ribosomal proteins for their respective operators have been precisely measured. In the case of S8, the Kd is about 200 nM (28), for S4 and S15, the Kd are close to 50 nM (29,30). Therefore, the affinity of L20 for its operator appears to be in the same range as in the case of S4 and S15. Considering the binding affinity of S4 for its mRNA and its relatively low free concentration (hypothesized to be around 10–20 nM) on one hand and the affinity of 30S ribosomes for mRNA (10–100 nM) and the relatively high concentration of free 30S subunits (1–10 μM) on the other, Draper proposed that a simple competition between S4 and the ribosome for the target mRNA cannot explain regulation. Instead, he proposed that S4 would trap the 30S subunit into an inactive ternary complex (31). Repression by entrapment is more efficient than competition and can work when the repressor affinity or concentration would not suffice for competition because the repressor only needs to increase the stability of an existing non-functional mRNA–ribosomal complex for entrapment, whereas competition requires inhibition of the de novo formation of a functional mRNA–ribosomal complex. This hypothesis turned out to be true since the alpha operon (the target of S4) and the rpsO gene (the target of S15) were later found to be regulated by trapping (32,33). Interestingly, the translation initiation regions of both mRNAs fold into a pseudoknot that is essential for control, suggesting that this type of mechanism requires specific mRNA structures capable of blocking translation. Since the rpmI-rplT operon also carries a pseudoknot and L20 binds with a comparable affinity to its mRNA, it is possible that regulation also functions by trapping in the present case. Further experiments are required to clarify this point.
The interaction between the two L20-binding sites of the operator RNA
Although the L20 operator RNA carries two potential binding sites for its protein, only one is occupied as indicated by both our biochemical and biophysical experiments. This single occupancy could, a priori, be explained by some long-range effect: L20 binding to either site 1 or site 2 would cause a major structural rearrangement of the operator RNA, changing the structure of the unoccupied site in such a way that it could no longer be recognized by L20. We do not believe this explanation is true since chemical footprinting experiments indicate that L20 binding has effects that are strictly localized at the binding sites (11), which is not compatible with major changes in the secondary structure of the whole operator RNA after L20 binding. The propagation of a major structural change consecutive to L20 binding to either site through formation of alternative secondary and/or tertiary interactions is also incompatible with our mutational data, which indicate that sequences outside of the two L20-binding sites can be deleted without major effect on control (11,13). Our results indicating that the two L20-binding sites are in interaction offer an alternative explanation for the single occupancy of the operator RNA: the interaction could abolish the potential of the unbound site to be recognized by L20 when the other is bound. This could happen in either two ways: by a conformational change of the unbound site or by steric hindrance. In the first case, the interaction between the two sites ‘senses’ L20 binding to one site and allows the conformational change to occur at the other site. In the second case, the role of the interaction would just be to bring the two sites close together enough for steric hindrance to occur. Regardless of its precise function, the interaction between the two sites of the operator RNA might also explain that singly mutated operator RNAs (this work) have higher affinities for L20C-ter than isolated fragments carrying only one of the sites (16). Indeed, the effect of a mutation in one of the sites might be partially compensated by an interaction with the other site.
One of the most remarkable observations is that the changes on both strands of the lower helix in site 2 clearly increase the reactivity of only one nucleotide of site 1, UinfC345, which is located close to nucleotide CinfC318, present in the bulge contiguous to the AinfC317-UinfC345 pair (Figure 1). This close proximity is of particular interest because nucleotide CinfC318 displays a strongly decreased reactivity when L20 is bound to the operator RNA even though it is not directly recognized by the protein (11). This strong, but very localized effect indicates that site 1 and site 2 interact by a limited number of nucleotides.
The 1:1 stoichiometry demonstrated here for the L20/operator complex was somewhat surprising in light of our earlier structural studies of the interaction of L20 with RNA (14). In these studies, the complex between the C-terminal fragment of L20 and a 42-nt long oligoribonucleotide derived from the rRNA-binding site for L20 was modelled using a combination of structural data from the ribosome, NMR and SAXS. The results demonstrated the formation of a tetrameric complex made of two RNAs and two L20C molecules. Indeed, we noted at the time that the formation of this complex suggested that translational repression could be performed by a complex of two proteins each interacting with the two distinct L20-binding sites within the operator. Distinct differences in the conditions of this earlier study and the present one can readily explain the different observations. First of all, the NMR and SAXS studies are performed at protein and RNA concentrations in the 100–200 μM range, whereas the present fluorescence studies were carried out using at most, 300 nM L20, disfavoring any low affinity protein–protein interactions. In vivo, the measured pools of r-proteins are between 1–3 μM (34). However, non-specific binding is thought to reduce the r-protein concentration from 1 to 2 orders of magnitude, i.e. to the concentration range studied here. Secondly, the present studies were carried out using the full-length (∼630 nt) operator RNA rather than the much shorter oligoribonucleotides. It is quite possible that the 3D structure of the operator RNA plays a role in regulating the stoichiometry of the complex. However, the published model also predicts that some conserved residues in the C-ter domain might be responsible for bridging the two RNA fragments in the tetrameric complex. As discussed below, this bridging might explain how a single L20C-ter monomer interacts with both mRNA sites.
How does L20 bind to its operator?
L20 translational feedback regulation depends on the capacity of the protein to bind to its operator RNA and to inhibit translation initiation. Our present data demonstrate that L20 behaves as a monomer and binds to its operator RNA with a reasonable affinity compared to other systems (see above). The case of L20 is exceptional in the sense that its operator RNA carries two potential binding sites, which both resemble to its rRNA-binding site (12). The potential of the two sites to bind L20 is indicated by three different sets of experiments. First, anisotropy-based titrations of L20C-ter with short operator RNA fragments carrying only either site 1 or site 2 yielded affinities of 88 nM for the site 1 fragment and 63 nM for the site 2 fragment (12). These values are very close to each other and indicate that both sites have the potential to bind L20C-ter independently from each other and with about the same affinity. Second, if one of the two sites is mutated, the other is still able to bind L20 as detected by former protection and L20-induced primer extension experiments (11). Third, the limited loss of affinity when only one site is mutated as shown here, also indicates that the non-mutated site is still functional independently of the other. Despite the presence of two potential binding sites, our work shows that only one single L20 binds to the operator in vitro. However, in vivo experiments clearly show that both sites are essential for regulation (12).
One model that accounts for our data posits that the operator folds into two different conformations that are in equilibrium with one another: the first conformation is mainly made out of the two sites as shown in Figure 1 and a second where sites 1 and 2 form an hybrid site (Figure 8A). In the presence of L20, the equilibrium is shifted to the hybrid site that allows binding with a higher affinity than the isolated sites (Figure 8A). Since NMR footprinting experiments indicate that the same side of L20C-ter is involved in the recognition of both sites 1 and 2, as expected for two RNA sites resembling each other, one has to postulate that the hybrid site is recognized in a manner similar to that of each isolated site as they are shown in Figure 1. In such a hybrid site, some structural elements of site 1 would be substituted by equivalent elements of site 2. In this case, the C-ter monomer contacts both site 1 and site 2, as previously proposed (see above and (14)).
Figure 8.

Models of L20 binding to its operator. (A) L20 binding to H2/L1 hybrid site produced by interaction between a region of site 2 (H2) and a region of site 1 (L1). In this model, the remaining regions of both sites are unable to form a L20-binding site. (B) L20 binding to one preformed site excludes binding to the second site either by structural change of the latter or by steric hindrance. (C) L20 binding to site 2 induces a structural change of site 1 rendering the latter competent for L20 binding and/or local increase of L20 concentration which increases the L20-binding efficiency of site 1.
A second possibility would be that L20 binds either to site 1 or to site 2 (Figure 8B), but never to the two sites simultaneously because the occupancy of a first site will inhibit binding to the second as explained above. Chemical footprinting experiments indicate that in a population of L20/operator RNA complexes both sites are bound, supporting the notion that the 1:1 L20/operator RNA complex stoichiometry arises from a statistical average of complexes with L20 bound either to site 1 or to site 2 (11).
A third possibility would be that L20 binds preferentially (or first) to one of the two sites (Figure 8C) keeping in mind that the other site is also essential for regulation. Site 2 is the first of the two L20-binding site to be completed by the transcribing RNA polymerase (the 5' part of site 1 is synthesized before but the 3' part after site 2) and has also a slightly higher affinity than site 1 for L20 as seen from affinity studies from RNA fragments carrying site 1 or site 2 independently (12) or from the present experiments showing that the decrease of affinity is higher when site 2 is mutated. It is possible that the role of site 2 is to catch L20 first, causing a structural change of site 1 that increases its affinity for L20 and/or a local increase of L20 concentration that maybe indispensable for site 1 to bind the protein with a reasonable efficiency. This model gives to site 1 the main role of assuming final L20 binding, which fits with the fact that some γ-proteobacteria carry only site 1 (12).
The second step of control, translation initiation inhibition, could result from different events. A first possibility is that L20 stabilizes the long-range interaction in the pseudoknot (site 1). Since this long-range interaction sequesters nucleotides adjacent to the translation initiation site of rpmI, its stabilization could inhibit translation. Alternatively, L20 binding could cause another structural change of the RNA close to the translation initiation site of rpmI inhibiting ribosome binding. The translation inhibition could also be due to L20 itself that either directly inhibits ribosome binding or traps the 30S subunit in a conformation incompatible with translation initiation. Work aimed at testing these possibilities is currently underway.
Although the mechanism of regulation of the rpmI-rplT operon is still largely unknown, the experiments shown in the present work clearly indicate that this mechanism, at least in terms of the protein–RNA interaction, is completely different from what has been previously described for any other gene.
ACKNOWLEDGEMENTS
We thank Eric Westhof for discussion and Marc Dreyfus, Frédéric Dardel, Ciaran Condon, Youri Timsit and Maude Guillier for careful reading of the manuscript and useful suggestions. This work was supported by grants from the CNRS (UPR9073 and UMR5048), INSERM (U554-UM1), DRAB (to C.R. and M.S.) and ANR (to C.R. and M.S.). Funding to pay the Open Access publication charges for this article was provided by CNRS.
Conflict of interest statement. None declared.
REFERENCES
- 1.Romby P., Springer M. Translational control in prokaryotes. In: Matthews M.B., Sonenberg N., Hershey J.W.B., editors. Translational Control of Gene Expression. Cols Spring Harbor, Newyork: Cold Spring Harbor Laboratory Press; 2006. [Google Scholar]
- 2.Hattman S. Unusual transcriptional and translational regulation of the bacteriophage Mu mom operon. Pharmacol. Ther. 1999;84:367–388. doi: 10.1016/s0163-7258(99)00042-x. [DOI] [PubMed] [Google Scholar]
- 3.Oppenheim A.B., Kornitzer D., Altuvia S., Court D.L. Posttranscriptional control of the lysogenic pathway in bacteriophage lambda. Prog. Nucleic Acid Res., Mol. Biol. 1993;46:37–49. doi: 10.1016/s0079-6603(08)61017-x. [DOI] [PubMed] [Google Scholar]
- 4.Zengel J.M., Lindahl L. Diverse mechanisms for regulating ribosomal protein synthesis in Escherichia coli. Prog. Nucleic Acid Res. Mol. Biol. 1994;47:331–370. doi: 10.1016/s0079-6603(08)60256-1. [DOI] [PubMed] [Google Scholar]
- 5.Nomura M., Gourse R., Baughman G. Regulation of the synthesis of ribosomes and ribosomal components. Annu. Rev. Biochem. 1984;53:75–117. doi: 10.1146/annurev.bi.53.070184.000451. [DOI] [PubMed] [Google Scholar]
- 6.Nomura M., Yates J.L., Dean D., Post L.E. Feedback regulation of ribosomal protein gene expression in Escherichia coli: structural homology of ribosomal RNA and ribosomal protein MRNA. Proc. Natl. Acad. Sci. USA. 1980;77:7084–7088. doi: 10.1073/pnas.77.12.7084. [DOI] [PMC free article] [PubMed] [Google Scholar]
- 7.Cerretti D.P., Mattheakis L.C., Kearney K.R., Vu L., Nomura M. Translational regulation of the spc operon in Escherichia coli. Identification and structural analysis of the target site for S8 repressor protein. J. Mol. Biol. 1988;204:309–329. doi: 10.1016/0022-2836(88)90578-5. [DOI] [PubMed] [Google Scholar]
- 8.Wu H., Jiang L., Zimmermann R.A. The binding site for ribosomal protein S8 in 16S rRNA and spc mRNA from Escherichia coli: minimum structural requirements and the effects of single bulged bases on S8-RNA interaction. Nucleic Acids Res. 1994;22:1687–1695. doi: 10.1093/nar/22.9.1687. [DOI] [PMC free article] [PubMed] [Google Scholar]
- 9.Merianos H.J., Wang J., Moore P.B. The structure of a ribosomal protein S8/spc operon mRNA complex. RNA. 2004;10:954–964. doi: 10.1261/rna.7030704. [DOI] [PMC free article] [PubMed] [Google Scholar]
- 10.Lesage P., Chiaruttini C., Graffe M., Dondon J., Milet M., Springer M. Messenger RNA secondary structure and translational coupling in the Escherichia coli operon encoding translation initiation factor IF3 and the ribosomal proteins, L35 and L20. J. Mol. Biol. 1992;228:366–386. doi: 10.1016/0022-2836(92)90827-7. [DOI] [PubMed] [Google Scholar]
- 11.Guillier M., Allemand F., Raibaud S., Dardel F., Springer M., Chiaruttini C. Translational feedback regulation of the gene for L35 in Escherichia coli requires binding of ribosomal protein L20 to two sites in its leader mRNA: a possible case of ribosomal RNA-messenger RNA molecular mimicry. RNA. 2002;8:878–889. doi: 10.1017/s1355838202029084. [DOI] [PMC free article] [PubMed] [Google Scholar]
- 12.Guillier M., Allemand F., Dardel F., Royer C.A., Springer M., Chiaruttini C. Double molecular mimicry in Escherichia coli: binding of ribosomal protein L20 to its two sites in mRNA is similar to its binding to 23S rRNA. Mol. Microbiol. 2005;56:1441–1456. doi: 10.1111/j.1365-2958.2005.04644.x. [DOI] [PubMed] [Google Scholar]
- 13.Chiaruttini C., Milet M., Springer M. A long-range RNA-RNA interaction forms a pseudoknot required for translational control of the IF3-L35-L20 ribosomal protein operon in Escherichia coli. EMBO J. 1996;15:4402–4413. [PMC free article] [PubMed] [Google Scholar]
- 14.Raibaud S., Vachette P., Guillier M., Allemand F., Chiaruttini C., Dardel F. How bacterial ribosomal protein L20 assembles with 23 S ribosomal RNA and its own messenger RNA. J. Biol. Chem. 2003;278:36522–36530. doi: 10.1074/jbc.M304717200. [DOI] [PubMed] [Google Scholar]
- 15.Kunkel T.A., Roberts J.D., Zakour R.A. Rapid and efficient site-specific mutagenesis without phenotypic selection. Methods Enzymol. 1987;154:367–382. doi: 10.1016/0076-6879(87)54085-x. [DOI] [PubMed] [Google Scholar]
- 16.Guillier M., Allemand F., Graffe M., Raibaud S., Dardel F., Springer M., Chiaruttini C. The N-terminal extension of Escherichia coli ribosomal protein L20 is important for ribosome assembly, but dispensable for translational feedback control. RNA. 2005;11:728–738. doi: 10.1261/rna.7134305. [DOI] [PMC free article] [PubMed] [Google Scholar]
- 17.Charollais J., Pflieger D., Vinh J., Dreyfus M., Iost I. The DEAD-box RNA helicase SrmB is involved in the assembly of 50S ribosomal subunits in Escherichia coli. Mol. Microbiol. 2003;48:1253–1265. doi: 10.1046/j.1365-2958.2003.03513.x. [DOI] [PubMed] [Google Scholar]
- 18.Nagy A., Wu J., Berland K.M. Observation volumes and {gamma}-factors in two-photon fluorescence fluctuation spectroscopy. Biophys. J. 2005;89:2077–2090. doi: 10.1529/biophysj.104.052779. [DOI] [PMC free article] [PubMed] [Google Scholar]
- 19.Haustein E., Schwille P. Single-molecule spectroscopic methods. Curr. Opin. Struct. Biol. 2004;14:531–540. doi: 10.1016/j.sbi.2004.09.004. [DOI] [PubMed] [Google Scholar]
- 20.Harms J., Schluenzen F., Zarivach R., Bashan A., Gat S., Agmon I., Bartels H., Franceschi F., Yonath A. High resolution structure of the large ribosomal subunit from a mesophilic eubacterium. Cell. 2001;107:679–688. doi: 10.1016/s0092-8674(01)00546-3. [DOI] [PubMed] [Google Scholar]
- 21.Schuwirth B.S., Borovinskaya M.A., Hau C.W., Zhang W., Vila-Sanjurjo A., Holton J.M., Cate J.H. Structures of the bacterial ribosome at 3.5 A resolution. Science. 2005;310:827–834. doi: 10.1126/science.1117230. [DOI] [PubMed] [Google Scholar]
- 22.Selmer M., Dunham C.M., Murphy F.V.T., Weixlbaumer A., Petry S., Kelley A.C., Weir J.R., Ramakrishnan V. Structure of the 70S ribosome complexed with mRNA and tRNA. Science. 2006;313:1935–1942. doi: 10.1126/science.1131127. [DOI] [PubMed] [Google Scholar]
- 23.Raibaud S., Lebars I., Guillier M., Chiaruttini C., Bontems F., Rak A., Garber M., Allemand F., Springer M., et al. NMR structure of bacterial ribosomal protein l20: implications for ribosome assembly and translational control. J. Mol. Biol. 2002;323:143–151. doi: 10.1016/s0022-2836(02)00921-x. [DOI] [PubMed] [Google Scholar]
- 24.Timsit Y., Allemand F., Chiaruttini C., Springer M. Coexistence of two protein folding states in the crystal structure of ribosomal protein L20. EMBO Rep. 2006;7:1013–1018. doi: 10.1038/sj.embor.7400803. [DOI] [PMC free article] [PubMed] [Google Scholar]
- 25.Peattie D.A. Direct chemical method for sequencing RNA. Proc. Natl. Acad. Sci. USA. 1979;76:1760–1764. doi: 10.1073/pnas.76.4.1760. [DOI] [PMC free article] [PubMed] [Google Scholar]
- 26.Inoue T., Cech T.R. Secondary structure of the circular form of the Tetrahymena rRNA intervening sequence: a technique for RNA structure analysis using chemical probes and reverse transcriptase. Proc. Natl. Acad. Sci. USA. 1985;82:648–652. doi: 10.1073/pnas.82.3.648. [DOI] [PMC free article] [PubMed] [Google Scholar]
- 27.Moazed D., Stern S., Noller H.F. Rapid chemical probing of conformation in 16 S ribosomal RNA and 30 S ribosomal subunits using primer extension. J. Mol. Biol. 1986;187:399–416. doi: 10.1016/0022-2836(86)90441-9. [DOI] [PubMed] [Google Scholar]
- 28.Gregory R.J., Cahill P.B., Thurlow D.L., Zimmermann R.A. Interaction of Escherichia coli ribosomal protein S8 with its binding sites in ribosomal RNA and messenger RNA. J. Mol. Biol. 1988;204:295–307. doi: 10.1016/0022-2836(88)90577-3. [DOI] [PubMed] [Google Scholar]
- 29.Deckman I.C., Draper D.E. Specific interaction between ribosomal protein S4 and the alpha operon messenger RNA. Biochemistry. 1985;24:7860–7865. doi: 10.1021/bi00348a002. [DOI] [PubMed] [Google Scholar]
- 30.Philippe C., Benard L., Eyermann F., Cachia C., Kirillov S.V., Portier C., Ehresmann B., Ehresmann C. Structural elements of rps0 mRNA involved in the modulation of translational initiation and regulation of E. coli ribosomal protein S15. Nucleic Acids Res. 1994;22:2538–2546. doi: 10.1093/nar/22.13.2538. [DOI] [PMC free article] [PubMed] [Google Scholar]
- 31.Draper D.E. Molecular mechanisms. In Ilan,J. (ed), Plenum press, NewYork. New York: Plenum Press; 1987. Translational regulation of ribosomal proteins in Escherichia coli; pp. pp. 1–26. [Google Scholar]
- 32.Philippe C., Eyermann F., Benard L., Portier C., Ehresmann B., Ehresmann C. Ribosomal protein S15 from Escherichia coli modulates its own translation by trapping the ribosome on the mRNA initiation loading site. Proc. Natl. Acad. Sci. USA. 1993;90:4394–4398. doi: 10.1073/pnas.90.10.4394. [DOI] [PMC free article] [PubMed] [Google Scholar]
- 33.Spedding G., Draper D.E. Allosteric mechanism for translational repression in the Escherichia coli alpha operon. Proc. Natl. Acad. Sci. USA. 1993;90:4399–4403. doi: 10.1073/pnas.90.10.4399. [DOI] [PMC free article] [PubMed] [Google Scholar]
- 34.Gausing K. Ribosomal protein in E. coli: rate of synthesis and pool size at different growth rates. Mol. Gen. Genet. 1974;129:61–75. doi: 10.1007/BF00269266. [DOI] [PubMed] [Google Scholar]