

Abstract
Dorsal horn interneurons with input from group II muscle spindle afferents are components of networks involved in motor control. Thirteen dorsal horn interneurons with monosynaptic group II input were characterized electrophysiologically and labeled intracellularly with Neurobiotin. Their axonal projections were traced, and neurotransmitter content was established by using immunocytochemistry. Two subpopulations were identified: five interneurons had axons that contained vesicular glutamate transporter 2 and hence were glutamatergic and excitatory. Terminals of the remaining eight interneurons were immunoreactive for the glycine transporter 2 or were apposed to gephyrin but did not contain the GABA-synthesizing enzyme glutamic acid decarboxylase and were therefore glycinergic and inhibitory. Excitatory cells were located mainly in the central region of lamina IV and had relatively small somata and restricted dendritic trees. In contrast, inhibitory interneurons were located more ventrally, in lamina V and had relatively larger somata and more extensive dendritic trees. Axonal projections of the two subpopulations differed considerably. Excitatory interneurons predominantly projected ipsilaterally, whereas most inhibitory interneurons projected both ipsilaterally and contralaterally. Three inhibitory axons formed contacts with large cholinergic cells in motor nuclei, thus revealing a novel direct coupling between inhibitory dorsal horn interneurons and motoneurons. The organization of the excitatory interneurons is consistent with current knowledge of reflex pathways to motoneurons, but the existence and connections of the inhibitory subpopulation could not be predicted from previous data. Our results indicate that these latter interneurons exercise widespread inhibitory control over a variety of cell types located on both sides of the spinal cord.
Keywords: reflex pathway, spinal interneuronal networks, motor control, electrophysiology, intracellular labeling, immunocytochemistry
Introduction
Our understanding of the sensorimotor integration necessary for control of posture and movement in mammals is rudimentary. One of the best understood mammalian circuits involved in such integration is concerned with reflexes evoked by activation of group II muscle afferents that have powerful and widespread actions on motoneurons (Matthews, 1972; Lundberg et al., 1987b). Recent studies have demonstrated that some group II actions on motoneurons are evoked disynaptically or trisynaptically and hence may be mediated by a pathway including only one or two interneurons (Edgley and Jankowska, 1987a; Lundberg et al., 1987a; Arya et al., 1991; Bajwa et al., 1992). The disynaptic actions of group II afferents have been shown to be evoked via interneurons located ipsilaterally in the intermediate zone and contralaterally in lamina VIII (Cavallari et al., 1987; Jankowska et al., 2005). Dorsal horn interneurons monosynaptically activated by group II afferents (Jankowska et al., 2002; Edgley et al., 2003) were hypothesized to provide input to both groups of cells, producing trisynaptic actions following the disynaptic ones. The proposed relationships between dorsal horn and premotor interneurons with group II input are illustrated in Figure 1. The dorsal horn interneurons were considered to secure activation of premotor interneurons and enable them to operate in a more flexible way by increasing the number of sites at which the network could be independently modulated. However, these proposed relationships were based on indirect electrophysiological evidence (Jankowska et al., 2002; Edgley et al., 2003) and preliminary observations on axonal projections of dorsal horn interneurons (Bras et al., 1989; Maxwell et al., 1997). Furthermore, the proposed circuit was based on excitatory interactions and did not take into account the possibility that some group II activated interneurons may have inhibitory actions. Evidence for the existence of a subpopulation of inhibitory cells is limited but monosynaptic EPSPs of group II origin in dorsal horn interneurons are often followed at short latency by IPSPs (Edgley and Jankowska, 1987a, their Fig. 6; Dougherty et al., 2005, their Fig. 7). However, these IPSPs could be mediated by either dorsal horn or intermediate zone interneurons. If inhibitory dorsal horn interneurons do exist, it is important to understand their role in the network.
Figure 1.

Hypothetical relationships between excitatory dorsal horn interneurons and premotor interneurons with group II input. Connections between dorsal horn interneurons and premotor interneurons in the intermediate zone and lamina VIII, which form synaptic contacts with ipsilateral and contralateral motoneurons, respectively (modified from Edgley et al., 2003, their Fig. 1; based on electrophysiological analysis of PSPs evoked from group II afferents in these interneurons and in motoneurons).
The principal aim of the present study was to test the hypothetical relationships shown in Figure 1 by analyzing the axonal projections of dorsal horn interneurons with group II input. A second aim was to determine whether the population includes inhibitory interneurons and, if so, to determine whether they have similar features and properties to the excitatory interneurons. Until recently, it was difficult to differentiate between these two fundamental types of interneuron in electrophysiological studies. We combined technologies to enable us to identify the transmitter content (and hence postsynaptic action) of electrophysiologically characterized cells (Bannatyne et al., 2003) and have applied this technology in the present study.
Parts of this work have been published previously (Bannatyne et al., 2004).
Materials and Methods
Experiments were performed on eight young adult cats (weighing 2.3–3.5 kg) obtained from an accredited supplier to University of Göteborg. All procedures were approved by the University of Göteborg Medical Ethics Committee and comply with National Institutes of Health and European Union guidelines. Anesthesia was induced with sodium pentobarbital (40 mg/kg, i.p.) and maintained with α-chloralose (∼3 mg · kg−1 · h−1, i.v.; Rhône-Poulenc Santé, Antony, France). The level of anesthesia was monitored by continuous recording of blood pressure and heart rate and by observing pupil dilatation. Blood pressure was monitored via a carotid cannula and maintained at ∼100–130 mmHg. Neuromuscular transmission was blocked with pancuronium bromide (0.2 mg · kg−1 · h−1, i.v., Pavulon; Organon, Västra Frölunda, Sweden), and animals were artificially ventilated. End-tidal CO2 was maintained between 4 and 5%. Core body temperature was maintained at ∼38°C.
Laminectomies were performed at the lumbar (L2–L7) and thoracic (T12–T13) levels, and stimuli (up to 1 mA) were applied at the latter level to identify and exclude antidromically activated ascending tract cells. Peripheral nerves (quadriceps, sartorius, and deep peroneal) were dissected and mounted on stimulating electrodes. A search was made in the L3–L5 segments for group II activated interneurons at depths at which dorsal horn field potentials were evoked (Fig. 1) (Edgley and Jankowska, 1987b). These were identified on the basis of monosynaptic activation after stimulation of muscle nerves at sufficient intensities to recruit group II muscle afferent fibers (five times threshold for recruitment of the most easily activated axons) and lack of antidromic activation by stimulation of the lateral fasciculi rostrally. After identification, cells were intracellularly labeled with a mixture of tetramethylrhodamine dextran (2%) and Neurobiotin (2%; Vector Laboratories, Peterborough, UK) by passing depolarizing current (up to 5 nA for 10 min).
At the conclusion of the experiments, the animals were given an overdose of anesthetic and perfused with either paraformaldehyde (4%) or a combination of paraformaldehyde (4%) and glutaraldehyde (0.2%) in experiments intended to provide material for electron microscopy (EM). The spinal cord was removed, and transverse sections (50 μm thick) were cut with a vibratome and collected in strict serial order. The sections were scanned using epifluorescence, and series of sections containing fluorescent cells were incubated with avidin–rhodamine for 3 h (1:1000; Jackson ImmunoResearch, Luton, UK) to reveal Neurobiotin labeling. Cells were scanned at a low magnification with a confocal microscope (MRC 1024; Bio-Rad, Hemmel Hempstead, UK) to allow preliminary reconstructions to be made.
Selected sections containing terminals from each cell were reacted with one of two combinations of antibodies: guinea pig anti-vesicular glutamate transporter 1 (VGLUT1; 1:5000; Chemicon, Harrow, UK) and sheep anti-glycine transporter 2 (GlyT2; 1:1000; Chemicon); or guinea pig anti-vesicular glutamate transporter 2 (VGLUT2; 1:5000; Chemicon) and rabbit anti-glutamic acid decarboxylase (GAD; recognizes both 65 and 67 isoforms, 1:2000; Sigma, Poole, UK). In experiments intended to provide material for EM analysis, the sections were treated with sodium borohydride before immunoreactions, and mouse anti-gephyrin (1:100; Connex, Martinsried, Germany) was substituted for GlyT2 because the GlyT2 antibody is not compatible with glutaraldehyde fixation. All of the interneurons in the sample were tested for each of the antibodies. The distribution of primary antibodies was revealed by incubation with secondary antibodies raised against the species in which the primary antibodies were generated and coupled to Alexa Fluor 488 (1:500; Invitrogen, Carlsbad, CA) or cyanine-5.18 (1:100; Jackson ImmunoResearch). The specificity of the primary antibodies used in this study has been investigated and discussed previously (Bannatyne et al., 2003; Mackie et al., 2003; Todd et al., 2003). Finally, each series of sections was reacted with ABC reagent (5–20 plus 5–20 μl, Vector Elite; Vector Laboratories) for 3 h in the presence of Triton X-100 and diaminobenzidine (DAB) to provide a permanent record of the cells from which detailed reconstructions were made using a drawing tube. Sections selected at this stage for EM analysis were incubated with ABC reagent for 3 d before reactions were performed using DAB as a chromogen. They were treated with osmium tetroxide, dehydrated, and embedded in resin between acetate foils. Sections were examined with a light microscope, and labeled axons were photographed and drawn. The sections were then attached to resin blocks. Series of ultrathin sections were prepared and viewed with a Phillips CM100 BioTwin electron microscope (FEI, Eindhoven, The Netherlands).
Results
More than 30 dorsal horn interneurons that were monosynaptically excited by group II afferents were intracellularly labeled. However, cells that were weakly labeled or had overlapping axonal arbors were excluded from the sample. Thirteen interneurons were sufficiently well labeled to allow detailed analysis of axonal projections. Their cell bodies were located in the central to lateral parts of the dorsal gray matter in laminas IV–VI.
Transmitter content of terminals, location, and input
Immunocytochemical analysis of selected sections from well labeled neurons permitted identification of the neurotransmitter present in their terminals. The numbers and locations of boutons analyzed are shown in Table 1. Whereas the immunolabeling for gephyrin and GlyT2 was consistent between all boutons, the intensity of immunoreactivity for VGLUT2 was more variable and ranged from weak and patchy to dense filling of the complete profile (Fig. 2B2). Similarly, although there was a range of intensities of immunoreactivity for GAD in regions surrounding labeled interneuronal terminals, there was no evidence of even weak GAD immunoreactivity associated with them.
Table 1.
Numbers and distribution of boutons analysed for neurotransmitter content
| Cell | Number of terminals analysed |
Location | |
|---|---|---|---|
| VGLUT2/GAD | VGLUT1/GlyT2/gephyrin | ||
| 1 | 28 | 18 | IV–V |
| 2 | 13 | 23 | V, VII |
| 3 | 26 | 10 | V |
| 4 | 23 | 22 | V–VII |
| 5 | 28 | 12 | IV–V |
| 6 | 19 | 44 | V–VII |
| 7 | 14 | 16 | VII |
| 8 | 30 | 17 | IV–V |
| 9 | 25 | 45 | V–VII |
| 10 | 31 | 38 | VI–IX |
| 11 | 16 | 25 | VI–VII |
| 12 | 11 | 12 | III–IV, VIII |
| 13 | 11 | 53 | VI–VII |
Figure 2.
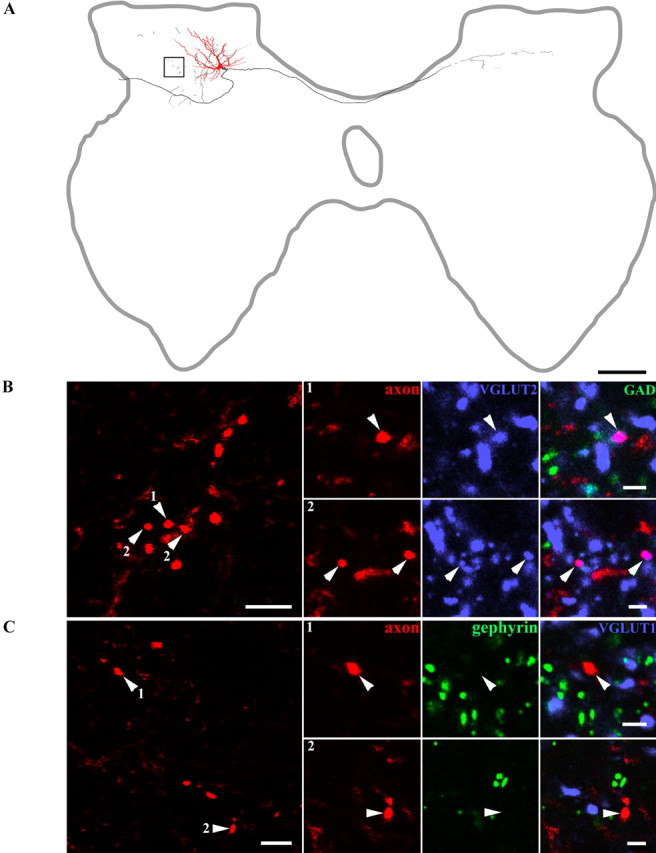
Morphology and immunocytochemical characteristics of a glutamatergic interneuron. A, Reconstruction of an interneuron (Table 2, cell 1), soma, and dendrites are shown in red, and the axonal arborization is shown in black. The box demarcates the area in which terminals shown below were located. B, A series of confocal microscope images illustrating the neurotransmitter content of boutons originating from this interneuron. The panel on the left shows a projected image made from several optical sections. Additional images of boutons (arrowheads) from single optical sections are shown in series of three to the right (1, 2). The axons are shown in red, immunoreactivity for VGLUT2 in blue, and immunoreactivity for GAD in green. The right panel of each series is a merged image confirming that the terminations are immunoreactive for VGLUT2. C, The panel on the left shows a projected image of a series of boutons. The two series of confocal images on the right illustrate single optical sections with the axon shown in red, immunoreactivity for VGLUT1 in blue, and gephyrin in green. There is no obvious relationship between immunolabeling for either antibodies and labeled interneuron terminals (1, 2). Scale bars: A, 400 μm; B, C (left panels), 5 μm; B, C (1, 2), 2 μm
Five cells possessed axon terminals that were VGLUT2 immunoreactive (Table 2, cells 1–5). Figure 2B illustrates a series of Neurobiotin-labeled terminals (Table 2, cell 1) that were immunoreactive for VGLUT2 but had no immunoreactivity for gephyrin, GAD, or VGLUT1 associated with them (Fig. 2B,C). Axon terminals of the other eight cells were immunoreactive for GlyT2 or were apposed to gephyrin and were therefore glycinergic (Table 2, cells 6–13). Figure 3B illustrates axonal swellings from a labeled interneuron (Table 2, cell 7) that displayed the characteristic ring-like immunoreactivity for GlyT2 (Spike et al., 1997), whereas Figure 4B shows gephyrin labeling associated with terminals from another cell (Table 2, cell 9) that was prepared for combined light and electron microscopy. Neither of these cells nor any of the others identified as glycinergic had axons that were immunoreactive for VGLUT1, VGLUT2, or GAD (Figs. 3B,C, 4B,C).
Table 2.
Summary of morphological data
| Cell | Segment | Soma position | Soma diameter (μm) | Shape of dendritic tree | Extent of dendritic tree (μm) |
Axonal projection |
Locations of terminals |
Contacts with ChAT-labeled profiles | ||||
|---|---|---|---|---|---|---|---|---|---|---|---|---|
| M-L/D-V | R-C | IL | XL | IL | XL | R-C extent | ||||||
| Glutamatergic | ||||||||||||
| 1 | L4 | Mid IV | 25 | Laterally and dorsally directed | ½ to ⅓ extent; III–IV | 480 | dLF r + c | IV–V | IV–V | 1020 | ||
| 2 | L4 | Mid IV | 20 × 30 | Dorsoventrally directed | ⅓ M-L extent; I–II border–V | 480 | dLF r + c | O | IV–VII | 600 | ||
| 3 | L4 | Mid IV | 20 | Dorsally directed | ⅓ M-L extent; I–II border–IV | 800 | dLF c | O | III–VII | 900 | ||
| 4 | L4 | Lat IV | 20 | Dorsolaterally directed, M-L restricted | Narrow cone of Lat gm; II–IV | 600 | dLF r + c | O | III–VII | 780 | ||
| 5 | L5 | Mid IV–V border | 20 × 25 | Mainly dorsally directed | Medial ½; III–dorsal IV | 480 | DC c | IV–VI | 900 | |||
| Glycinergic | ||||||||||||
| 6 | L3 | Lat IV–V border | 35 | Restricted dorsally | Entire M-L extent, into dLF; III–IV | 840 | LF r + c | VF r + c | IV–IX | VII–VIII | 1200 | Yes |
| 7 | L4 | Lat IV–V border | 20 × 10 | Mainly dorsally directed | Over ⅔ M-L extent, into dLF; IV–Lat VII | * | LF r | VF c | IV–IX | VII–IX | 480 | Not tested |
| 8 | L5 | Lat IV | 20 × 10 | Mainly dorsally directed | Restricted M-L to narrow band; I–II border–IV | 900 | dLF r | O | IV–VII | 1200 | Not tested | |
| 9 | L5 | Lat IV–V border | 20 × 30 | Restricted dorsally | Lateral ½ M-L, into dLF; IV–VI | 540 | LF r + c | VF r + c | IV–IX | IV–VIII | 2100 | Not tested |
| 10 | L5 | Lat IV–V border | 40 | Radial | Lateral ½, into dLF; II–III border–V | 600 | LF r + c | VF c | IV–IX | VII–IX | 1020 | Yes |
| 11 | L5 | Mid V | 40 | Restricted dorsally | Entire M-L extent, into LF; IV–VI | 780 | LF c | VF r + c | IV–IX | VII–IX | 1080 | Yes |
| 12 | L5 | Lat V | 25 | Restricted dorsoventrally | Entire M-L extent, into dLF; IV–VI | 650 | O | VF r + c | II–VIII | VII | 720 | Not tested |
| 13 | L5 | Lat V | 25 × 40 | Restricted dorsoventrally | Lateral ¾), into dLF; IV–VI | 540 | LF r + c | VF c | V–VII | VIII | 600 | Not found |
M-L, Mediolateral; D-V, dorsoventral; R-C, rostrocaudal; IL and XL, ipsilateral and contralateral; Mid, central; Lat, lateral; DC, dorsal columns; 0, no projection; LF, lateral fasciculus; VF, lateral fasciculus; dLF, dorsal part of lateral fasciculus; r, rostral; c, caudal;*, rostrocaudal extent not determined
Figure 3.
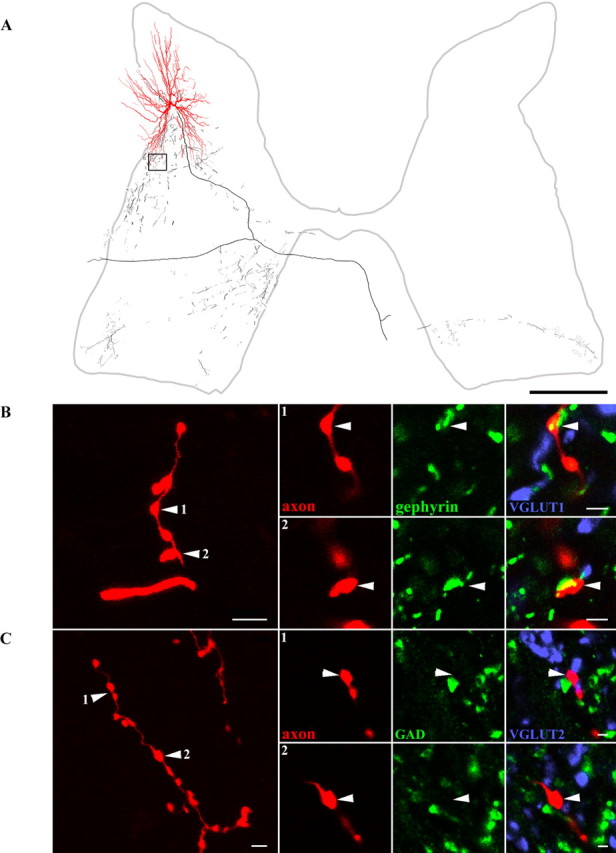
Morphology and immunocytochemical characteristics of a glycinergic interneuron. A, Reconstruction of an interneuron (Table 2, cell 9), soma, and dendrites shown in red and axonal arborization in black. The axon terminals illustrated in B are taken from the area outlined by the box. B, A series of confocal microscope images illustrating neurotransmitter content of boutons originating from this interneuron: the left panel illustrates a projected image of a series of boutons. Additional images of boutons (arrowheads) from single optical sections are shown in panels 1 and 2 to the right. The axon is shown in red, immunoreactivity for GlyT2 in green, and VGLUT1 in blue. The right panel of each series is a merged image confirming that the ring-like immunoreactivity characteristic of GlyT2 staining is associated with labeled interneuronal terminals. C, Projected image of groups of terminals in the large panel on the left, with single optical sections through individual boutons in panels 1 and 2. Axon terminals are shown in red (arrowheads), immunoreactivity for GAD in green, and VGLUT2 in blue. There is no obvious relationship between interneuronal terminals and immunoreactivity for either of the other antibodies. Scale bars: A, 500 μm; B, C (left panels), 5 μm; B, C (1, 2), 2 μm
Figure 4.
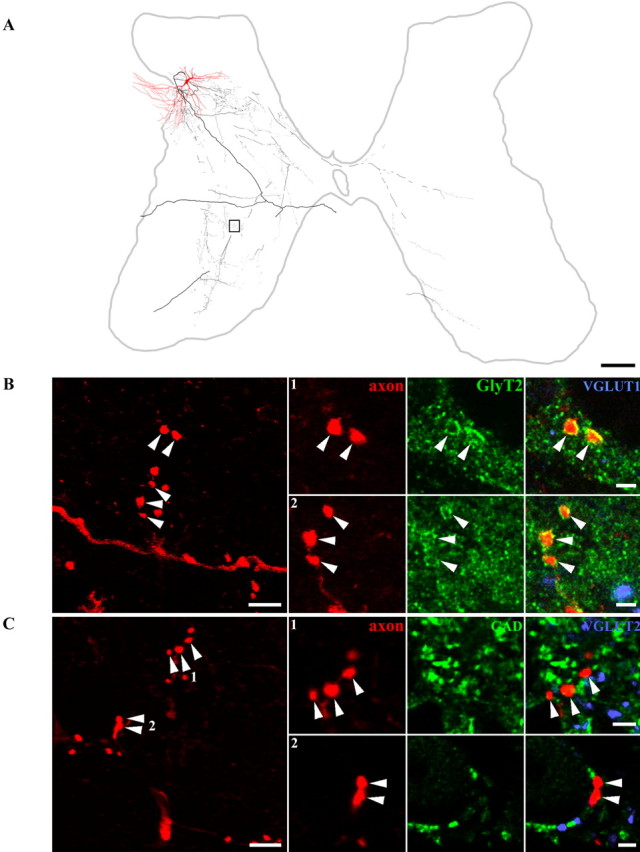
Morphology and immunocytochemical characteristics of a glycinergic interneuron. A, Reconstruction of an interneuron (Table 2, cell 10), soma, and dendrites shown in red and axonal arborization in black. The axon terminals illustrated in B are taken from the area outlined by the box. B, A series of images illustrating neurotransmitter content of boutons originating from this interneuron. The left panel illustrates a projected image of a series of boutons. Additional images of boutons (arrowheads) from single optical sections in panels 1 and 2 on the right show the axon in red, immunoreactivity for gephyrin in green, and VGLUT1 in blue. Merged images confirm the association between gephyrin and the interneuronal terminals. C, Projected images of groups of terminals in large panel to left, with single optical sections through individual boutons in panels 1 and 2. Axon terminals are shown in red (arrowheads), immunoreactivity for GAD in green, andVGLUT2 in blue. There is no obvious relationship between interneuronal terminals and immunoreactivity for these antibodies. Scale bars: A, 500 μm; B, C (left panels), 5 μm; B, C (1, 2), 4 μm.
The location of cell bodies of labeled interneurons in the L3–L5 segments of the lumbosacral enlargement is shown in Figure 5. Somata of all of the glutamatergic interneurons were located in lamina IV of Rexed (red symbols), whereas all but one of the glycinergic interneurons (green symbols) were found in lamina V. The atypical glycinergic neuron was located in the most lateral part of lamina IV. Locations of the other interneurons that were labeled but not reconstructed are shown in black.
Figure 5.

Differential location of glutamatergic and glycinergic dorsal horn interneurons with monosynaptic input from group II muscle afferents. A–C, Diagrams showing locations of cell bodies of labeled interneurons in the L3–L5 segments of the lumbosacral enlargement, plotted on standard outlines of the spinal cord as described by Rexed (1954). VGLUT2-immunopositive cells are shown in green, and those immunopositive for GlyT2 or gephyrin are in red. The locations of interneurons that were labeled but not reconstructed are indicated in black.
No differences were found in the input or responses of glutamatergic and glycinergic interneurons to stimulation of group II afferents. This is illustrated for four interneurons from each of these subpopulations in Figure 6. In both subpopulations, monosynaptic EPSPs (third dotted lines in the first and third columns) from group II afferents were evoked at latencies of 1.5–1.8 ms after the arrival of group I afferent volleys (indicated by the first dotted lines) and latencies of 0.7–0.9 ms from the onset of group II volleys (second dotted lines). In some interneurons from both subpopulations, the monosynaptic components (third dotted lines) were followed by later components (fourth dotted lines), giving rise to double or multiple (Fig. 6D,L) rather than single (Fig. 6B,J) spikes in extracellular records. These had latencies that were consistent with disynaptic or trisynaptic EPSPs. In both subpopulations, EPSPs were evoked at a similar threshold, more than two times the threshold for group I afferents (Fig. 6E–H, M–P), and the fast declining phase of the EPSP was sometimes followed by an IPSP (Fig. 6E,I).
Figure 6.

Examples of PSPs evoked in glutamatergic and glycinergic interneurons. The top traces in each record were obtained from four glutamatergic interneurons (A and B, C and D, E and F, G and H; i.e., cells 3, 2, 1, and 4 in Table 2) and four glycinergic interneurons (I and J, K and L, M and N, O and P; i.e., cells 9, 11, 12, and 8 in Table 2), with negativity downward. B, D, J, and L are extracellular records; all other records are intracellular. The bottom traces in each record are from the cord dorsum, with the negativity upward. The stimuli were applied to the quadriceps (Q) and sartorius (Sart) nerves at intensities near maximal for group II afferents (5 times threshold) or maximal for group I afferents (2 or 2.5 times threshold). Dotted lines indicate the following: (1) afferent volleys from group I afferents, (2) estimated onset of group II volleys, (3) onset of monosynaptic EPSPs, and (4) onset of the most likely disynaptic EPSPs. Calibration pulses at the beginning of all microelectrode records are 0.5 mV time calibration 2 ms. For additional explanations, see Results.
Morphology and projections: glutamatergic interneurons
Glutamatergic interneurons had small somata (20–25 μm in diameter) with dorsally directed dendritic trees distributed within laminas III–IV and occasionally extending dorsally to the border between laminas I and II and ventrally as far as lamina VI. The dendritic trees were restricted in the mediolateral plane and occupied no more than half the width of the gray matter. The total rostrocaudal spread ranged from 480 to 800 μm. The most laterally situated cell (cell 4) had a mediolateral spread that was limited to a narrow cone directed dorsolaterally. Morphological data are summarized in Table 2, and a reconstruction of one glutamatergic interneuron (cell 1) is shown in Figure 2A. Projections formed by glutamatergic interneurons are summarized in Figure 7 and Table 2.
Figure 7.

Projections of glutamatergic interneurons. Cell bodies of interneurons are indicated by circles, stem axons are indicated as thick lines, and the areas in which terminals were visualized are shaded in gray. Numbers to the left indicate the number of the neuron in Table 2. Rostral and caudal projections are indicated by upward and downward arrows, respectively. Bottom right, Location of somata of intracellularly labeled intermediate zone interneurons (circles; modified from Bras et al., 1989) and commissural interneurons with monosynaptic input from group II afferents (open triangles; our unpublished data) or from reticulospinal tract neurons (filled triangles; our unpublished data) that are potential target cells of the dorsal horn interneurons. The light gray shading approximates the maximal dendritic spread of intermediate zone interneurons (modified from Bras et al., 1989), and the dark gray shading approximates that of lamina VIII commissural cells (modified from Bannatyne et al., 2003).
Stem axons of four of the glutamatergic interneurons projected via the dorsal part of the lateral funiculus (cells 1–4). Three cells (cells 1, 2, and 4) projected both rostrally and caudally, but cell 3 projected caudally only. The stem axon of the other neuron (cell 5) bifurcated ventrally to its soma and gave rise to an axonal branch that entered the dorsal columns and ran in the direction of the dorsal commissure before fading and becoming untraceable. The other axonal branch and axon collaterals could not be followed beyond lamina VI. Cell 1 (Fig. 2) also sent a fine collateral via the dorsal commissure to ramify contralaterally in laminas IV and V. In all five interneurons, the principal axon gave rise to collaterals that formed groups of terminals in areas surrounding and ventral to the soma as it passed through the gray matter. The target areas included laminas IV–VI and, for two cells (2 and 4), the dorsal part of lamina VII. There was no evidence of projections to any region more ventral than dorsal lamina VII.
Morphology and projections: glycinergic interneurons
Somata of seven of the glycinergic cells in the sample ranged from 20 and 40 μm in diameter and had dendritic trees that extended throughout more than half the mediolateral extent of the gray matter, also encroaching on the adjacent lateral white matter. Examples of two of these cells are shown in Figures 3A and 4A, and morphological data are summarized in Table 2. Cell 8 differed not only in the morphology of its dendritic tree, which was directed dorsally toward the lamina II–III border and restricted mediolaterally, but also in the projection of its axon (described below).
Axonal projections from the glycinergic interneurons are summarized in Figure 8 and Table 2. Five cells (7, 9, 10, 11, and 13) had axons that ran ventromedially from the cell bodies. These bifurcated in medial lamina VII and sent one axon collateral to the ipsilateral lateral funiculus and another to the contralateral ventral funiculus, in which they branched again to send collaterals in both rostral and caudal directions. Cell 12 followed the same pattern, but the ipsilateral axon branch could not be followed farther than medial lamina VII adjacent to the branch point. For some cells (8 and 9), the daughter collaterals were of a similar diameter; for others, the contralateral branch was finer. The axon originating from cell 6 also projected via both the ipsilateral lateral funiculus and the contralateral ventral funiculus, but the branch point giving rise to the two collaterals was located close to the cell body in lamina V rather than in medial lamina VII. Cell 8 showed no evidence of a contralateral projection but sent its main axon into the dorsal part of the ipsilateral lateral funiculus.
Figure 8.
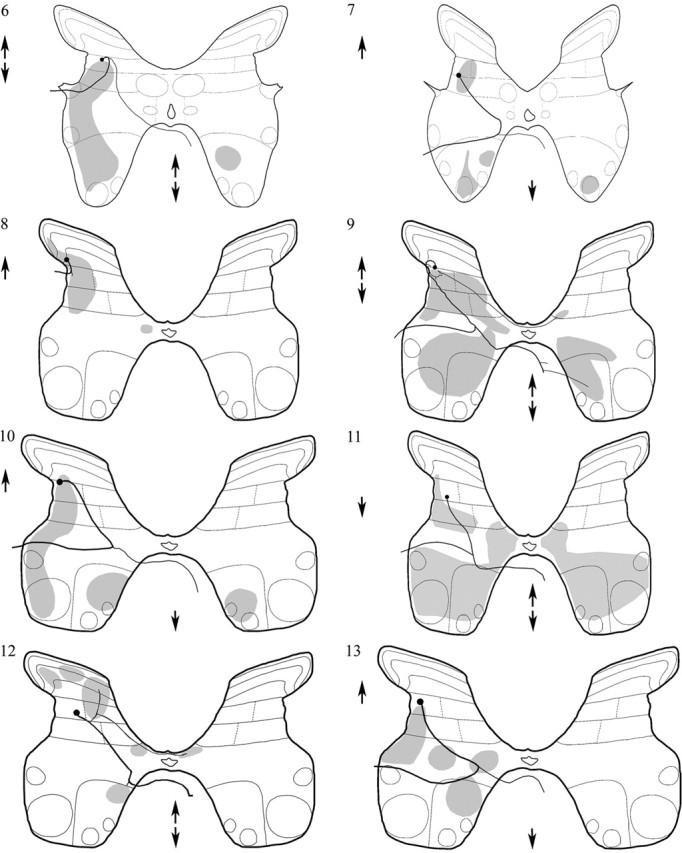
Projections of glycinergic interneurons. Cell bodies of the interneurons are indicated by circles, stem axons are indicated as thick lines, and the areas in which terminals were visualized are shaded in gray. Rostral and caudal projections are indicated by upward and downward arrows, respectively.
In general, collaterals arose from the major branches of axons of the glycinergic neurons during their passage through the gray matter and after they had entered the white matter. Terminal arborizations were observed over a total rostrocaudal extent of 1200–2000 μm and were widely distributed to all areas of the gray matter with the exception of the contralateral dorsal horn, although two cells (9 and 12) had collaterals that decussated via the dorsal commissure to ramify in the medial regions of the contralateral laminas VI or VII. Ipsilateral areas consistently targeted by these cells included the deep dorsal horn (laminas IV, V, and VI), lamina VII, the region around the central canal, and lamina VIII. Contralaterally, terminals were found in laminas VII and VIII.
Terminal projection areas of several cells also included lamina IX, thus indicating that these cells may have direct inhibitory actions on motoneurons. This was an unexpected finding because there has been no previous evidence for premotor interneurons in the dorsal horn (see Discussion). Particular attention was therefore paid to terminals of glycinergic interneurons in or adjacent to motor nuclei. Six glycinergic interneurons (6, 7, 9, 10, 11, and 13) had terminal arborizations in parts of ipsilateral lamina IX and/or in adjacent areas of laminas VII and VIII in which overlap with motoneuronal dendrites might be expected. Three cells (7, 10, and 11) also terminated in the contralateral motor nuclei. In the case of the best labeled interneuron (cell 11), terminal arborizations were found in the medial and lateral motoneuron groups bilaterally, indicating that the projections were not focally directed. ChAT immunocytochemistry was used to identify motoneurons, and terminals from three interneurons (cells 6, 9, and 10) were found to form close appositions with motoneuron cell bodies or dendrites. Examples of these appositions are shown in Figure 9, in which axon terminals are closely apposed to ChAT-immunoreactive motoneuron somata and also show gephyrin immunoreactivity oriented in a manner consistent with the presence of synaptic contacts. For one of these neurons (cell 9), synapse-like specializations (Fig. 10) with no pronounced postsynaptic density were observed in 19 terminals followed through serial sections with the electron microscope.
Figure 9.
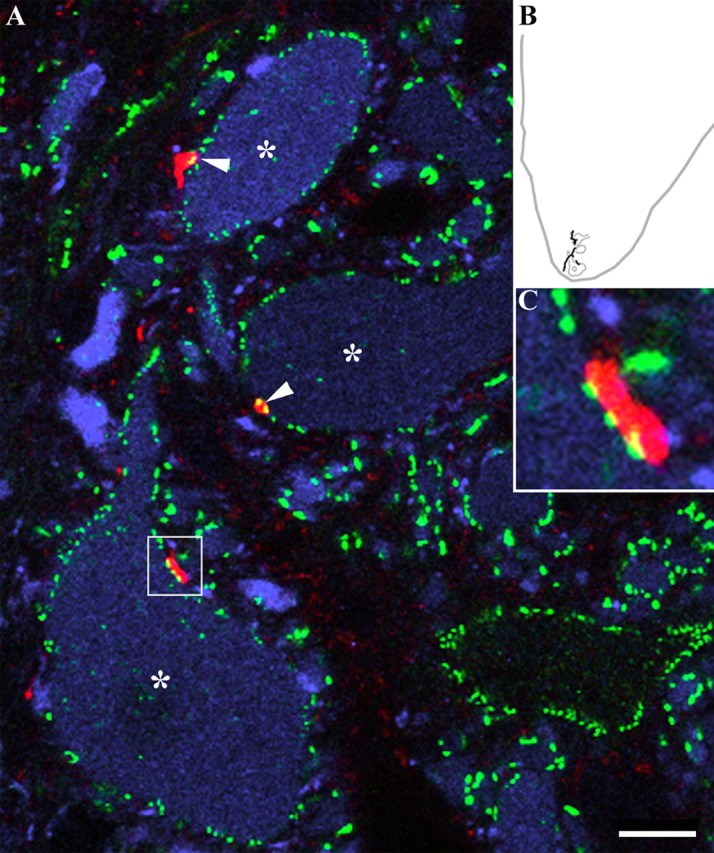
Evidence for contacts from a glycinergic interneuron onto motoneurons. A, An image composed of merged single optical sections illustrating appositions (arrowheads) formed by an interneuron axon (red) with three large cell bodies (*) in lamina IX (B) that were immunopositive for ChAT (blue). Immunoreactivity for gephyrin is shown in green. The terminal in the area enclosed by the box in A is shown at higher magnification in C. Gephyrin immunoreactivity was aligned at the junction between the axonal swelling and the motoneuron. Scale bar, 10 μm.
Figure 10.

Electron microscopy of a glycinergic terminal. A, Drawing of part of an axon collateral (of cell 10 in Table 2) from ipsilateral lamina IX made from a light microscope section prepared for combined light and electron microscopy. Boutons were clustered around a large motoneuron (Mn) in the contralateral ventral horn. The bouton indicated by the arrowhead is shown in the electron micrograph in B. B, Electron microscopic examination confirmed that this bouton (arrow) made a synapse-like contact with the motoneuron (Mn). The inset shows the presence of symmetrical synaptic specializations (between arrows) that became apparent on following the bouton through serial sections. Scale bars: A, 10 μm; B, 1 μm.
Discussion
The results show that dorsal horn interneurons with monosynaptic input from group II muscle spindle afferents fall into two functional subpopulations with different somatic locations, projection patterns, and neurochemical phenotypes. One group consists of excitatory glutamatergic interneurons that are located primarily in lamina IV and have small somata, relatively restricted dendritic trees, and terminal projection areas distributed mainly ipsilaterally and principally within laminas IV–VI. The other subpopulation comprises inhibitory glycinergic interneurons that are located primarily in lamina V, have larger somata and relatively extensive dendritic trees, project bilaterally, and have terminal projection areas within laminas IV–IX. No evidence for a third, GABAergic subpopulation was found. The results also show that, within the general features of each subpopulation, there is some degree of individual variability, e.g., in the more dorsal or ventral location of individual neurons or in the trajectory of the stem axons. The most marked individual differences were the sparse contralateral projections of one of the five excitatory interneurons and the apparent lack of contralateral projections of one of the eight inhibitory interneurons. Nevertheless, the common general features were remarkably consistent despite the relatively small sample, and the most striking difference in morphology between the excitatory and inhibitory subpopulations was the projection of inhibitory interneurons to the ventral horn. Because the locations of the cells in this study are similar to those reported previously for group II interneurons (Edgley and Jankowska, 1987a; Bras et al., 1989) and all cells responded in a similar way to peripheral input, it is probable that the current sample is representative of the entire population of midlumbar interneurons with group II input.
The use of gephyrin to identify interneurons as glycinergic might be questioned, because it has also been located at GABAergic synapses (for review, see Sassoe-Pognetto and Fritschy, 2000). However, Alvarez et al. (1997) demonstrated that, in the ventral spinal gray matter, gephyrin immunofluorescence accurately paralleled the active zones of glycinergic synapses. Furthermore, because there was no evidence for the presence of GAD in labeled interneuronal terminals, it can be concluded that the presence of gephyrin immunoreactivity is indicative of glycinergic phenotype.
Comparison with other neuronal populations
Only one previous study has been published in which dorsal horn interneurons with group II input were characterized electrophysiologically and labeled intracellularly (Bras et al., 1989). Morphological features of this sample of interneurons are comparable with ours with respect to location, sizes of somata, extent of dendritic trees, and trajectories of stem axons. However, in the previous study, the marker used was horseradish peroxidase, which provides relatively limited information about axonal arbors. We used Neurobiotin, and this has enabled us to greatly extend knowledge of the axonal projections and terminations of group II activated dorsal horn interneurons.
Other studies designed to investigate the locations and projections of dorsal horn interneurons have used tract-tracing techniques (Petko and Antal, 2000; Petko et al., 2004). In the first of these studies, tracer injections were directed primarily to laminas I–III, but some of them encroached on lamina IV. Injections in the middle and medial parts of the dorsal horn revealed predominantly ipsilateral projections that were mainly restricted to the dorsal horn and therefore had similar locations and projection patterns to our sample of excitatory interneurons. Bilateral projections, and projections to more ventral parts of the gray matter, were found principally after injections to the lateral parts of the dorsal horn. The majority of crossed terminals were immunoreactive for both GAD 65/67 and GlyT2 and were present in the contralateral dorsal horn rather than in intermediate or ventral locations. Although these bilaterally projecting cells have some similarities to the inhibitory population labeled in this study, it is likely that they belong to a separate population that originates principally from laminas III–IV. It is more difficult to make satisfactory comparisons between our sample of interneurons and projections of spinal neurons with crossed axonal projections that were labeled by less localized application of tracer substances [e.g., to the whole transverse face of one side of the neonatal spinal cord in vitro (Eide et al., 1999; Stokke et al., 2002) or to the ventral and lateral part of the ventral horn (Birinyi et al., 2003)]. Nevertheless, these studies also revealed the presence of retrogradely labeled commissural neurons in the dorsal horn, which might include the inhibitory dorsal horn interneurons analyzed in this study. In keeping with the results of Petko and Antal (2000) and Petko et al. (2004), these were found predominantly in the lateral or middle regions of the dorsal horn (Eide et al., 1999; Stokke et al., 2002; Birinyi et al., 2003).
Functional considerations
Projections of excitatory dorsal horn interneurons to laminas V–VI and to the dorsal part of lamina VII were anticipated because they would be required for mediation of disynaptic excitatory input from group II afferents to intermediate zone premotor interneurons acting on ipsilateral motoneurons (Jankowska et al., 2002). The location of the latter interneurons is indicated with circles in the bottom right panel of Figure 7; intracellular labeling has shown they have significant dendritic arborization in the regions of termination of the glutamatergic dorsal horn neurons (Bras et al., 1989) (Fig. 7). These projections thus support the hypothetical neuronal network outlined in Figure 1. The probability of contacts between excitatory dorsal horn interneurons and commissural interneurons mediating crossed actions of group II afferents might be lower because these interneurons are located more ventrally. However, if contacts are made primarily on the most dorsally located fraction of commissural interneurons and/or on distal rather than proximal parts of their dendrites, the results also support the possibility of such an arrangement.
Although projections of excitatory group II dorsal horn interneurons were predicted on the basis of connections established in electrophysiological experiments, the existence and extent of projections of the inhibitory subpopulation could not have been predicted from previous data. Most inhibitory interneurons (six of eight cells) had similar projection patterns, in which the main axon projected to the ipsilateral lateral funiculus and a large axon collateral also projected to the contralateral ventral funiculus. In contrast to the unilateral projections of excitatory interneurons found in this study and the commissural interneurons we investigated (Bannatyne et al., 2003), these axons formed widespread bilateral arborizations in the dorsal horn and throughout the ventral horn. Such projections are well suited for the coordination of neuronal activity by inhibitory control of both sides of the spinal cord. It was not possible to determine the total rostrocaudal extent of projections, because the longest distance over which axonal processes could be traced was 2100 μm. However, it is likely that they projected much farther both rostrally and caudally and hence may coordinate neuronal activity in more than one segment.
Of particular interest is the observation of bilateral projections of inhibitory interneurons to motor nuclei, in which they form direct contacts with motoneurons. This arrangement indicates that disynaptic inhibition of motoneurons from group II afferents may be evoked not only via intermediate zone interneurons (Cavallari et al., 1987) but also by dorsal horn interneurons. The bilateral connections made by these interneurons might underlie the crossed inhibitory reflexes evoked by group II afferents (Aggelopoulos et al., 1996). Because the majority of dorsal horn interneurons with group II input are coexcited by cutaneous afferents (Edgley and Jankowska, 1987a), they may also contribute to the disynaptic inhibition of motoneurons evoked from cutaneous afferents (Degtyarenko et al., 1998; Edgley and Aggelopoulos, 2006; Quevedo et al., 2005) in addition to the inhibition evoked from group II afferents. Inhibitory dorsal horn interneurons with group II input that project to lamina VIII might also fulfill another important function: to control activity of commissural interneurons that mediate centrally initiated movements. Our recent study revealed that group II afferents frequently evoke inhibition of a population of commissural interneurons that are excited by reticulospinal neurons (Jankowska et al., 2005). The inhibitory dorsal horn interneurons with group II input thus could ensure an adequate level of activation of motoneurons in a variety of centrally initiated movements that are mediated by reticulospinal neurons and commissural interneurons, including movements initiated by the ipsilateral pyramidal tract (Edgley et al., 2004). The large terminal projection areas of inhibitory interneurons indicate that target cells of these interneurons may include a great variety of other interneurons and ascending tract cells. They may thus make an important contribution to the integrative functions of both group II and other flexor reflex afferents (Eccles and Lundberg, 1959; Lundberg et al., 1987b). However, the question of whether inhibitory dorsal horn interneurons or inhibitory intermediate zone interneurons with group II input (Cavallari et al., 1987), or both types of cell, are responsible for the widespread inhibitory actions of group II afferents on motoneurons, ascending tract neurons, and other interneurons remains to be resolved.
In conclusion, in this study, we provided evidence that group II activated interneurons in the dorsal horn belong to two distinct subpopulations: one excitatory and the other inhibitory. Most cells within these two populations form characteristic axonal projections and form two distinct components of group II reflex pathways.
Footnotes
This work was supported by National Institutes of Health Grant NS 40 863. We thank Margaret McGill and Rauni Larsson for invaluable assistance.
References
- Aggelopoulos NC, Burton MJ, Clarke RW, Edgley SA (1996). Characterization of a descending system that enables crossed group II inhibitory reflex pathways in the cat spinal cord. J Neurosci 16:723–729. [DOI] [PMC free article] [PubMed] [Google Scholar]
- Alvarez FJ, Dewey DE, Harrington DA, Fyffe RE (1997). Cell-type specific receptor organisation of glycine receptor clusters in the mammalian spinal cord. J Comp Neurol 397:150–170. [PubMed] [Google Scholar]
- Arya T, Bajwa S, Edgley SA (1991). Crossed reflex actions from group II muscle afferents in the lumbar spinal cord of the anaesthetised cat. J Physiol (Lond) 444:117–131. [DOI] [PMC free article] [PubMed] [Google Scholar]
- Bajwa S, Edgley SA, Harrison PJ (1992). Crossed actions on group II-activated interneurons in the midlumbar segments of the cat spinal cord. J Physiol (Lond) 455:205–217. [DOI] [PMC free article] [PubMed] [Google Scholar]
- Bannatyne BA, Edgley SA, Hammar I, Jankowska E, Maxwell DJ (2003). Networks of inhibitory and excitatory commissural interneurons mediating crossed reticulospinal actions. Eur J Neurosci 18:2273–2284. [DOI] [PMC free article] [PubMed] [Google Scholar]
- Bannatyne BA, Maxwell DJ, Edgley SA, Hammar I, Jankowska E (2004). Transmitter content and connections of dorsal horn interneurons interposed in feline group II muscle afferents pathways. J Physiol (Lond) 557P:C95. [Google Scholar]
- Birinyi A, Viszokay K, Weber I, Kiehn O, Antal M (2003). Synaptic targets of commissural interneurons in the lumbar spinal cord of neonatal rats. J Comp Neurol 461:429–440. [DOI] [PubMed] [Google Scholar]
- Bras H, Cavallari P, Jankowska E, Kubin L (1989). Morphology of midlumbar interneurons relaying information from group II muscle afferents in the cat. J Comp Neurol 290:1–15. [DOI] [PubMed] [Google Scholar]
- Cavallari P, Edgley SA, Jankowska E (1987). Post-synaptic actions of midlumbar interneurons on motoneurons of hind-limb muscles in the cat. J Physiol (Lond) 389:675–689. [DOI] [PMC free article] [PubMed] [Google Scholar]
- Degtyarenko AM, Simon ES, Norden-Krichmar T, Burke RE (1998). Modulation of oligosynaptic cutaneous and muscle afferent reflex pathways during fictive locomotion and scratching in the cat. J Neurophysiol 79:447–463. [DOI] [PubMed] [Google Scholar]
- Dougherty KJ, Bannatyne BA, Jankowska E, Krutki P, Maxwell DJ (2005). Membrane receptors involved in modulation of responses of spinal dorsal horn interneurons evoked by feline group II muscle afferents. J Neurosci 25:584–593. [DOI] [PMC free article] [PubMed] [Google Scholar]
- Eccles RM, Lundberg A (1959). Synaptic actions in motoneurons by afferents which may evoke the flexion reflex. Arch Ital Biol 97:199–221. [Google Scholar]
- Edgley SA, Aggelopoulos N (2006). Short latency crossed inhibitory reflex actions evoked from cutaneous afferents. Exp Brain Res in press. [DOI] [PubMed]
- Edgley SA, Jankowska E (1987a). An interneuronal relay for group I and II muscle afferents in the midlumbar segments of the cat spinal cord. J Physiol (Lond) 389:647–674. [DOI] [PMC free article] [PubMed] [Google Scholar]
- Edgley SA, Jankowska E (1987b). Field potentials generated by group I and II muscle afferents in the middle lumbar segments of the cat spinal cord. J Physiol (Lond) 397:99–111. [DOI] [PMC free article] [PubMed] [Google Scholar]
- Edgley SA, Jankowska E, Krutki P, Hammar I (2003). Both dorsal horn and lamina VIII interneurons contribute to crossed reflexes from group II muscle afferents. J Physiol (Lond) 552:961–974. [DOI] [PMC free article] [PubMed] [Google Scholar]
- Edgley SA, Jankowska E, Hammar I (2004). Ipsilateral actions of feline corticospinal tract neurons on limb motoneurons. J Neurosci 24:7804–7813. [DOI] [PMC free article] [PubMed] [Google Scholar]
- Eide AL, Glover J, Kjaerulff O, Kiehn O (1999). Characterization of commissural interneurons in the lumbar region of the neonatal rat spinal cord. J Comp Neurol 403:332–345. [PubMed] [Google Scholar]
- Jankowska E, Slawinska U, Hammar I (2002). On organization of a neuronal network in pathways from group II muscle afferents in feline lumbar spinal segments. J Physiol (Lond) 542:301–314. [DOI] [PMC free article] [PubMed] [Google Scholar]
- Jankowska E, Edgley SA, Krutki P, Hammar I (2005). Functional differentiation and organization of feline midlumbar commissural interneurons. J Physiol (Lond) 565:645–658. [DOI] [PMC free article] [PubMed] [Google Scholar]
- Lundberg A, Malmgren K, Schomburg ED (1987a). Reflex pathways from group II muscle afferents. 1. Distribution and linkage of reflex actions to alpha motoneurons. Exp Brain Res 65:271–281. [DOI] [PubMed] [Google Scholar]
- Lundberg A, Malmgren K, Schomburg ED (1987b). Reflex pathways from group II muscle afferents. 3. Secondary spindle afferents and the FRA: a new hypothesis. Exp Brain Res 65:294–306. [DOI] [PubMed] [Google Scholar]
- Mackie M, Hughes DI, Maxwell DJ, Tillakaratine NJK, Todd AJ (2003). Distribution and colocalisation of glutamate decarboxylase isoforms in the rat spinal cord. Neuroscience 119:461–472. [DOI] [PubMed] [Google Scholar]
- Matthews PBC (1972). In: Mammalian muscle spindles and their central action London: Arnold.
- Maxwell DJ, Kerr R, Jankowska E, Riddell JS (1997). Synaptic connections of dorsal horn group II spinal interneurons: synapses formed with the interneurons and by their axon collaterals. J Comp Neurol 380:51–69. [PubMed] [Google Scholar]
- Petko M, Antal M (2000). Propriospinal afferent and efferent connections of the lateral and medial areas of the dorsal horn (laminae I–IV) in the rat lumbar spinal cord. J Comp Neurol 422:312–325. [DOI] [PubMed] [Google Scholar]
- Petko M, Veress G, Vereb G, Storm-Mathisen J, Antal M (2004). Commissural propriospinal connections between the lateral aspects of laminae III–IV in the lumbar spinal cord of rats. J Comp Neurol 480:364–377. [DOI] [PubMed] [Google Scholar]
- Quevedo J, Stecina K, McCrea DA (2005). Intracellular analysis of reflex pathways underlying the stumbling corrective reaction during fictive locomotion in the cat. J Neurophysiol 94:2053–2062. [DOI] [PubMed] [Google Scholar]
- Rexed B (1954). A cytoarchitectonic atlas of the spinal cord in the cat. J Comp Neurol 100:297–379. [DOI] [PubMed] [Google Scholar]
- Sassoe-Pognetto M, Fritschy J (2000). Gephyrin, a major postsynaptic protein of GABAergic synapses. Eu J Neurosci 12:2205–2210. [DOI] [PubMed] [Google Scholar]
- Spike RC, Watt C, Zafra F, Todd AJ (1997). An ultrastructural study of the glycine transporter GlyT2 and its association with glycine in the superficial laminae of the rat spinal dorsal horn. Neuroscience 77:543–551. [DOI] [PubMed] [Google Scholar]
- Stokke MF, Nissen UV, Glover JC, Kiehn O (2002). Projection patterns of commissural interneurons in the lumbar spinal cord of the neonatal rat. J Comp Neurol 446:349–359. [DOI] [PubMed] [Google Scholar]
- Todd AJ, Hughes DI, Polgar E, Nagy GG, Mackie M, Otterson OP, Maxwell DJ (2003). The expression of vesicular glutamate transporters VGLUT1 and VGLUT2 in neurochemically-defined axonal populations in the rat spinal cord. Eur J Neurosci 17:13–27. [DOI] [PubMed] [Google Scholar]