

Abstract
Modulatory actions of a metabotropic 5-HT1A&7 membrane receptor agonist and antagonist [(+/-)-8-hydroxy-2-(di-n-propylamino)-tetralin; N-[2-[4-(2-methoxyphenyl)-1-piperazinyl]ethyl]-N-(2-pyridinyl) cyclohexane-carboxamide] and an ionotropic 5-HT3 membrane receptor agonist and antagonist [2-methyl-serotonin (2-Me 5-HT); N-(1-azabicyclo[2.2.2]oct-3-yl)-6-chloro-4-methyl-3-oxo-3,4-dihydro-2H-1,4-benzoxazine-8-carboxamide hydrochloride] were investigated on dorsal horn interneurons mediating reflex actions of group II muscle afferents. All drugs were applied ionophoretically in deeply anesthetized cats. Effects of agonists were tested on extracellularly recorded responses of individual interneurons evoked by electrical stimulation of group II afferents in a muscle nerve. Effects of antagonists were tested against the depression of these responses after stimulation of raphe nuclei. The results show that both 5-HT1A&7 and 5-HT3 membrane receptors are involved in counteracting the activation of dorsal horn interneurons by group II afferents. Because only quantitative differences were found within the sample of the tested neurons, these results suggest that modulatory actions of 5-HT on excitatory and inhibitory interneurons might be similar. The relationship between 5-HT axons and axons immunoreactive for the 5-HT3A receptor subunit, which contact dorsal horn interneurons, was analyzed using immunofluorescence and confocal microscopy. Contacts from both types of axons were found on all interneurons, but their distribution and density varied, and there was no obvious relationship between them. In two of six interneurons, 5-HT3A-immunoreactive axons formed ring-like arrangements around the cell bodies. In previous studies, axons possessing 5-HT3 receptors were found to be excitatory, and as 2-Me 5-HT depressed transmission to dorsal horn interneurons, the results indicate that 5-HT operates at 5-HT3 receptors presynaptic to these neurons to depress excitatory transmission.
Keywords: spinal cord, dorsal horn interneurons, membrane receptors, serotonin, group II afferents, confocal microscopy
Introduction
Serotonin (5-HT) modifies the activity of both motoneurons and premotor spinal neurons (for review, see Barnes and Sharp, 1999; Hochman et al., 2001). The present study was undertaken to analyze its effects at the level of one particular population of spinal interneurons involved in coordinating motor responses: dorsal horn interneurons in pathways between group II muscle afferents and either ipsilateral or contralateral α motoneurons.
Previous studies have demonstrated that 5-HT is of critical importance for selecting one of two opposite patterns of responses evoked by group II muscle afferents, which involve either excitation or inhibition of contralateral extensor motoneurons (Aggelopoulos et al., 1996) rather than the stereotypical crossed extension characteristic of spinalized vertebrates (Sherrington, 1906). Dorsal horn interneurons do not contact contralateral motoneurons but may affect them via lamina VIII commissural interneurons, which directly excite or inhibit them (Edgley et al., 2003). The pathway from group II afferents via dorsal horn and commissural interneurons is thus trisynaptic and supplements the disynaptic pathway via commissural interneurons, as schematically indicated in Figure 1A. 5-HT could modulate crossed actions of group II afferents at the level of both of these interneurons. However, if modulatory actions of 5-HT on dorsal horn interneurons (at the level of the top arrow in Fig. 1A) contribute to the selection of either excitatory or inhibitory subpopulations of commissural interneurons, they should involve the same membrane receptors (5-HT1A and/or 5-HT7) that are implicated in the switching between the excitation and inhibition of contralateral motoneurons by the 5-HT1A,7 receptor agonist (+/-)-8-hydroxy-2-(di-n-propylamino)-tetralin (8-OH-DPAT) and the 5-HT1A receptor antagonist N-[2-[4-(2-methoxyphenyl)-1-piperazinyl]ethyl]-N-(2-pyridinyl) cyclohexane-carboxamide (WAY 100635) (Aggelopoulos et al., 1996).
Figure 1.

Diagram of disynaptic and trisynaptic pathways between group II muscle afferents and contralateral motoneurons and the medullary stimulation sites. A, Diagram of connections between dorsal horn interneurons (DH), lamina VIII commissural interneurons (VIII), and contralateral motoneurons (co MN), modified from the study by Edgley et al. (2003; their Fig.1). For the sake of simplicity, both the excitatory and inhibitory interneurons (Maxwell et al., 1997) are represented by the two interneurons in the diagram. The arrows indicate sites of modulatory serotonergic actions investigated in a previous study (Hammar et al., 2004), which were further analyzed in the present series of experiments. B, Stimulation sites in five experiments; these are superimposed on a scanned image of a transverse section of the medulla at a level corresponding to the caudal border of the superior olive (SO) in the plane of the insertion of the electrodes. agon., Agonist; antagon., antagonist; MLF, medial longitudinal fascicle; Pyr, pyramid; TB, trapezoid body.
Therefore, the first aim of the study was to determine whether the effects of 5-HT on dorsal horn interneurons are evoked via 5-HT1A membrane receptors. This was investigated by analyzing effects of 8-OH-DPAT and WAY 100635 on responses of individual dorsal horn interneurons evoked by group II afferents. The second aim was to investigate whether the depression of activation of dorsal horn interneurons by 5-HT may only be mediated by G-protein-coupled receptors, represented by 5-HT1A membrane receptors, or also by ligand-gated ion channels (i.e., the 5-HT3 receptors). To answer this question, we analyzed effects of 2-methyl-serotonin (2-Me 5-HT), which is a highly selective 5-HT3 receptor agonist. The third aim was to compare the effects of application of 5-HT agonists by ionophoresis with the effects of release of 5-HT from terminals of serotoninergic fibers. To this end, these fibers were stimulated within the raphe nuclei, and a 5-HT1A receptor antagonist (WAY 100635) (Alexander et al., 2004), a 5-HT3 receptor antagonist [N-(1-azabicyclo[2.2.2]oct-3-yl)-6-chloro-4-methyl-3-oxo-3,4-dihydro-2H-1,4-benzoxazine-8-carboxamide hydrochloride (Y-25130)] (Sato et al., 1992), and a GABAA receptor antagonist (bicuculline) (Alexander et al., 2004) were applied locally to differentiate between effects attributable to 5-HT and GABAergic actions. The fourth aim was to examine the relationships between 5-HT and 5-HT3-immunoreactive axon terminals and the dorsal horn interneurons.
Materials and Methods
Preparation. The electrophysiological experiments were performed on seven deeply anesthetized cats, weighing 2.1-2.4 kg. The anesthesia was induced with sodium pentobarbital (40-44 mg/kg, i.p.) and maintained with intermittent doses of α-chloralose (doses of 5 mg/kg administered every 1-2 h, up to 50 mg/kg, i.v.; Rhône-Poulenc Santé, Antony, France). During recording, neuromuscular transmission was blocked by pancuronium bromide (∼0.2 mg/kg/h i.v.; Pavulon, Organon, Askim, Sweden), and the animals were artificially ventilated. An additional dose of α-chloralose was given at the first sign of any increase in the continuously monitored blood pressure or heart rate or if the pupils dilated. The mean blood pressure was kept at 100-130 mmHg and the end-tidal concentration of CO2 at ∼4% by adjusting parameters of artificial ventilation and the rate of a continuous infusion of a bicarbonate buffer solution with 5% glucose (1-2 ml/h/kg). The core body temperature was kept at ∼38° by servo-controlled infrared lamps. The experiments were terminated by a lethal dose of pentobarbital and a formalin perfusion. All experimental procedures were approved by the Göteborg Ethics Committee and followed National Institutes of Health and European Union guidelines for animal care.
A preliminary dissection exposed the third to seventh lumbar (L3-L7) segments of the spinal cord. Two nerves, quadriceps (Q) and sartorius (Sart), were mounted in subcutaneous cuff electrodes and one nerve, deep peroneal (DP), mounted on a pair of electrodes in a paraffin oil pool. For stimulation of raphe nuclei (in four experiments), the caudal part of the cerebellum was exposed by a craniotomy, and two tungsten electrodes 2 mm apart (impedance, 30-150 KΩ) were inserted at an angle of 30° (with the tip directed rostrally). The starting positions were at Horsley-Clarke coordinates posterior (P) 3 and 5 or P 5 and 7, lateral 0.2 (ipsilaterally), and horizontal 8, but the final positions were adjusted on the basis of effects of the stimuli on dorsal horn field potentials evoked by group II afferents taking advantage of the results of a previous study (Noga et al., 1992). The electrodes were left at locations from which the depression evoked by 100 μA stimuli was to at least 50% of the control response, and the depression evoked by 200 μA stimuli was to <30%. At the end of the experiments, these sites were marked by passing 0.4 mA constant current for 10 s. The location of the stimulation sites was subsequently verified on 100-μm-thick frontal sections of the brain stem cut in the plane of the insertion of the electrodes using a freezing microtome and counterstained with cresyl violet. These stimulation sites were at the level of the caudal part of the superior olive (Fig. 1 B), or ∼1 mm caudal to it. They overlapped with the nucleus raphe pallidus or were within the border zone between this nucleus and nuclei raphe obscurus and magnus. They overlapped also with the areas from which strongest depression of synaptic actions of group II afferents was previously evoked (Jankowska et al., 1993, their Fig. 1; Riddell et al., 1993, their Fig. 2), although most were more ventral. The areas contain neurons synapsing with motoneurons, as shown by retrograde transynaptic labeling (Alstermark et al., 1987).
Stimulation and recording. Peripheral nerves were stimulated at intensities submaximal or near-maximal for group II muscle afferents [0.1 ms duration, 2.5-5 times threshold (T) for the most sensitive fibers in the nerve]. For activation of the descending raphespinal tract fibers, trains of six to eight constant current stimuli (0.2 ms, 75-200 μA, 400 Hz, 45-50 ms before nerve stimulation) were applied using a 0.5 mm electrolytically etched tungsten wire, insulated except for its tip as a cathode. Ascending tract neurons were stimulated at a low thoracic level by pairs of silver ball electrodes in contact with left and right lateral funiculi (transdurally) at intensities supramaximal for activation of dorsal spinocerebellar tract fibers (≥0.5 mA; 0.2 ms).
Glass micropipettes (tip diameter, ∼1.5 μm) filled with 2 m NaCl solution were used for extracellular recording of both field potentials and spike potentials of the analyzed interneurons and larger micropipettes (tip diameter, ∼2-2.5 μm) filled with a solution of the investigated agents (see details below) for recording and for application of these agents.
A search was made for interneurons in the L4-L5 segments of the spinal cord, at dorsal horn locations at which the most distinct field potentials were evoked from group II afferents (Edgley and Jankowska, 1987a). They were differentiated from dorsal horn ascending tract neurons with the same input (Edgley and Jankowska, 1987b, 1988) by failure to activate them antidromically by stimuli applied to the left and right lateral funiculi at a low thoracic level. Interneurons responding to stimulation at thresholds of 2.5-5 T and at latencies 1.2-3.0 ms from afferent volleys of group I origin of Q or Sart and 2.0-4.0 ms of DP were classified as interneurons with monosynaptic input from group II afferents (Edgley and Jankowska, 1987a).
Ionophoresis. The compounds used were 5-HT (0.2 m; Sigma, St. Louis, MO), 8-OH-DPAT (0.05 m; Sigma), Y-25130 (0.2 m; Tocris Cookson, Ballwin, MO), 2-Me-5-HT (0.1 m; Sandoz, Basel, Switzerland), WAY-100635 (0.1 m; Wyeth Ayerst International, Cambridge, MA), and bicuculline (0.02 m; Sigma). They were applied in the immediate surrounding of the interneurons (within 10-50 μm of the tip of the recording electrode) by ionophoresis from a water solution at pH 4.5, using a double-headed micromanipulator with two separate microdrives for the recording and the drug-containing micropipettes (Engberg et al., 1972). The details of the procedure and the control experiments have been described previously (Jankowska et al., 2000). A 10 nA retaining current was used when the drug-containing pipette was advanced through the spinal cord to reduce the possibility of leakage though the tip of the drug-containing micropipette. Two series of control records of interneuronal responses were taken before the ionophoresis began: one before the insertion of the drug-containing pipette (control) and the other when the latter had reached its position close to the recording pipette but before ejecting the drug (placement) to make sure that the placement of the micropipette did not exert any mechanical effects on the neuron. Both the agonists and antagonists were ejected using 20 nA negative constant current during 3 min while simultaneously recording from the neuron through the recording micropipette. The shape and the amplitude of a current pulse applied through the drug-containing pipette were monitored during the ionophoresis; if higher impedance electrodes (generally 8-20 MΩ) started to fail to pass currents exceeding 10 nA, the intensity of the current was reduced, and the time of ionophoresis was prolonged to 4 min or until a plateau of the effects had been reached. In contrast, when neuronal responses disappeared after 0.5 or 1 min, the ionophoresis stopped after 1.5 min to increase the probability of recovery within the fast set time limits of 25 min. After the termination of the ionophoresis, the drug-containing pipette was withdrawn from the spinal cord, and responses of the neurons were recorded every 5 min.
Analysis of effects of monoamines. Responses to 20 consecutive stimuli were sampled every 15 or 30 s for as long as the ionophoresis continued and thereafter every 5 min during the recovery period. Evaluation of the effect of the ionophoresed substances was made by comparing the number of responses evoked by nerve stimulation and any changes in the latency before, during, and after ionophoresis. Peristimulus time histograms and cumulative sums were created on-line and stored in parallel with the original data records. To restrict the data to responses evoked by monosynaptic actions, these were sampled within time windows of 0.8-2 ms (from the earliest responses at latencies compatible with a monosynaptic coupling) with the exception of the five weakest excited interneurons in which the time window was increased to 2.5 ms. Data are expressed as means ± SEM. Statistical significance was calculated using Student's t test.
Intracellular labeling and immunocytochemistry. A sample of six intracellularly labeled dorsal horn interneurons was obtained from five deeply anesthetized adult cats to examine the relationship between them and immunoreactivity for 5-HT and 5-HT3A receptor subunits. Once the cells were identified according to electrophysiological criteria (see above), tetramethylrhodamine dextran (Molecular Probes, Eugene, OR) and/or Neurobiotin (Vector Laboratories, Peterborough, UK) were injected by passing a constant positive current of 3-5 nA through the micropipette for 6-10 min (total product, 20-45 nA × min). At the conclusion of experiments, animals were perfused via the descending aorta, initially with 0.9% NaCl in 0.1 m phosphate buffer, pH 7.4, and subsequently with 2 L of fixative containing 4% formaldehyde in 0.1 m phosphate buffer, pH 7.4 (Hammar et al., 2004). Spinal cord segments were dissected out and placed in the same fixative for 8 h. Vibratome sections were cut in the transverse plane, collected in strict serial order, and mounted on glass slides with Vectashield (Vector Laboratories). They were scanned with a fluorescence microscope to identify individual cells labeled with tetramethylrhodamine dextran. Short series of sections containing well-labeled cells were incubated in avidin-rhodamine (1:1000) for 3 h in phosphate buffer supplemented with Triton X-100 to reveal Neurobiotin. Sections containing cells were then incubated for 48 h with rat anti-5-HT antibodies (1:200; Affiniti Research Products, Nottingham, UK) and rabbit anti-5-HT3A subunit antibodies (1:200; Oncogene Research Products, Cambridge, MA). The presence of antibody-antigen complexes was identified by using secondary antibodies, which were raised against immunoglobulins of the species from which the primary antibodies were obtained. Immunoreactivity for 5-HT was visualized using an anti-rat secondary conjugated to cyanine 1.58 and for 5-HT3 with an anti-rabbit secondary conjugated to Alexa488. All secondary antibodies were used at dilutions of 1:100 for 3 h and were obtained from Jackson ImmunoResearch (Luton, UK). The staining properties and specificity of the antibodies used have been described previously (Stewart and Maxwell, 2000; Maxwell et al., 2002). The cells were scanned using a three-color confocal microscope (Bio-Rad, Hemel Hempstead, UK), and the distribution of the immunoreactive terminals was analyzed using Neurolucida for confocal software (Micro-BrightField, Colchester, VT). Putative terminals were only considered to be in contact with labeled cells if they were immediately adjacent with no intervening black pixels (Bannatyne et al., 2003; Hammar et al., 2004).
Two of the neurons (labeled with a 2% rhodamine/2% neurobiotin mixture) were analyzed for the transmitter content of their terminals, as described by Bannatyne et al. (2003). Cell bodies and dendrites were scanned with a confocal microscope using a 20× lens at z intervals of 1 μm, and a preliminary reconstruction was made. Sections containing terminals were then incubated (for 48 h) in combinations of primary antibodies raised against the following molecules: either rabbit anti-glutamic acid decarboxylase (GAD65 and GAD67, 1:1000; to identify GABAergic terminals); and guinea pig antivesicular glutamate transporter 2 (VGLUT2, 1:5000; to identify glutamatergic terminals); or with sheep antiglycine transporter 2 (GlyT2, 1:1000) or mouse anti-gephyrin (1:100; to identify glycinergic terminals) and guinea pig antivesicular glutamate transporter 1 (VGLUT1, 1:5000; to identify glutamatergic terminals). Anti-guinea pig antibodies coupled to cyanine 1.58 (Cy-5) were used to detect VGLUT1 and VGLUT2; an anti-rabbit antibody coupled to Alexa488 to detect GAD, an anti-sheep antibody coupled to Alexa488 to detect GlyT2, or an anti-mouse antibody coupled to Alexa488 to detect gephyrin. All secondary antibodies were used at dilutions of 1:100 in incubations lasting 3 h and were obtained from Jackson ImmunoResearch. After these incubations, the sections were remounted and scanned with the confocal microscope using a Fluor 40× oil immersion lens. Series of images of axonal swellings were gathered at zoom factors of 2-5× and at z intervals of 0.5 μm. Terminals were then examined in both single optical sections and merged images to determine which of the markers were present.
Results
Effects of a 5-HT1A,7 and a 5-HT3 receptor agonist on responses of dorsal horn interneurons
Effects of both 5-HT agonists on individual interneurons were tested using standard parameters of iontophoresis, which resulted in the depression of monosynaptic focal field potentials evoked by group II afferents in the dorsal horn to ∼50% (within a time window of 0.7-1 ms from the onset). These are illustrated in Figure 2, A (for 8-OH DPAT) and B (for 2-Me 5-HT), where they can be compared with the depression evoked by 5-HT (C).
Figure 2.

Depression of field potentials elicited by stimulation of Q or Sart nerves (at the indicated intensities) after ionophoresis or raphe stimulation. In A-D, control field potentials (black) and the depressed field potentials (gray) are superimposed; the lowermost records are from cord dorsum at the L5 level. A, Effects of 8-OH DPAT (1 min). B, Effects of 2-Me 5-HT (1.5 min). C, Effects of 5-HT (2 min). D, Effects of raphe stimulation (100 μA). The depression of the areas of the early components of these field potentials (between the two vertical dotted lines) was to 48, 38, 51, and 23% of the control. In E-G, the pairs of records are of control field potentials (black) and of potentials after stimulation within a raphe nucleus and of the medial longitudinal fascicle 3 mm more dorsal in the same electrode track accompanied by records from the surface of the lateral funiculus at a thoracic (Th) level. MLF, Medial longitudinal fascicle.
The effects of 8-OH DPAT were tested on 10 dorsal horn interneurons and in nine of these, a considerable depression of activation by group II afferents was found. Figure 3, A and B, shows that during 3 min of ionophoresis, the mean number of responses evoked by 20 stimuli decreased from 15.0 ± 1.5 to 3.1 ± 1.0 spikes (26.7 ± 9.4% of control). When calculated, only for the nine cells in which it occurred, the depression was to 14.5 ± 4.9%. The mean recovery was to 8.0 ± 1.8 (47.7 ± 13.6%). The depression started within the first 0.5 min of ionophoresis and often continued to increase during the successive 5 min after the end of ionophoresis, as if the maximal depression required diffusion of 8-OH DPAT along the great part of the dendritic tree. The deepening of the depression after ionophoresis is also illustrated with changes in responses of an individual interneuron in Figure 3C. The recovery was rather slow, but its beginning was seen within 20-25 min after the end of the ionophoresis in all of the interneurons.
Figure 3.

Effects of 8-OH DPAT. A, Time course of the effects of 8-OH DPAT. Ordinate: means and SEM of the numbers of responses evoked by 20 stimuli are shown. Abscissa: periods of measurements, before and after placement of the drug-containing pipette, during 1.5-3 min of ionophoresis and during 5-20 min of recovery. The plots are based on measurements from 17 sequences of stimuli on responses of all 10 dorsal horn interneurons investigated, seven of which were activated by stimulation of two nerves (Q and Sart or Q and DP, alternating every 15 s). In the cases in which all spikes were abolished before 3 min (n = 8), data points were interpolated (left at 0) until electrode withdrawal. The gray area indicates the duration of the ionophoresis. All data from 1 min 8-OH DPAT on (including recovery) were significantly different from placement (p < 0.05 for 1 min 8-OH DPAT and 20 min recovery; p < 0.001 for the rest). B, Means and SEM of the numbers of responses during two preliminary measurements, before (control) and after (placement) placement of the drug-containing pipette, and means of the maximal depression during ionophoresis (max drug) and after 20-25 min of recovery (max recovery) in individual interneurons. C, Examples of responses of a dorsal horn neuron. The records are as follows (from top to bottom): extracellularly recorded spike potentials of the neuron to a single stimulus; peristimulus time histograms of responses evoked by 20 stimuli before, during, and after 8-OH DPAT iontophoresis; and a record of the afferent volley. The horizontal dotted line indicates the discrimination level for construction of peristimulus time histograms. The vertical dotted lines indicate the onset of the afferent volley and the beginning and the end of the 1.3-ms-long time window within which the peristimulus time histograms were compared. D, Time course of changes in responses of the interneuron illustrated in C. Ordinate: number of spikes within the indicated time window. Abscissa: periods of measurements.
Effects of 2-Me 5-HT were tested on 11 dorsal horn interneurons and were shown to be similar to those of 8-OH DPAT. Mean numbers of responses to 20 stimuli went from 14.3 ± 1.6 to 3.2 ± 0.8 during ionophoresis and recovered to 10.7 ± 1.3. This depression was found in 10 of these cells (i.e., in a similar percentage as after 8-OH DPAT ionophoresis and to a similar degree, to 27.2 ± 5.7%, in the whole sample and to 22.6 ± 1.4% in those in which the depression occurred). In view of not quite comparable general conditions of ionophoresis (Krnjevic, 1971), the comparison of the time course of depression in Figures 3A and 4A may not be reliable, but it suggests a faster manifested effect of 2-Me 5-HT (just after placement and before the beginning of iontophoresis, i.e., most likely by diffusion). It also suggests a faster onset of the recovery, immediately after the end of the ionophoresis. The decreases in the number of spikes evoked by nerve stimulations were often associated with an increase in the latency of the earliest spikes, as illustrated in Figures 3C and 4C. At the end of the ionophoresis, the increase was >0.2 ms in 75% of the cells, with a mean increase of 0.75 ± 0.2 and 1.05 ± 0.2 ms by 8-OH DPAT and 2-Me 5-HT, respectively.
Figure 4.

Effects of 2-Me 5-HT. A, B, Time course and mean depression evoked by 2-Me 5-HT as in Figure 3, A and B. The plots are based on measurements from 15 sequences of stimuli on responses of 11 dorsal horn interneurons, four of which were activated by stimulation of both Q and Sart nerves. When spikes were abolished before 3 min (n = 5), data points for the remaining period before the onset of the recovery were interpolated (taken as 0). All data from current on (p < 0.05) and after [p < 0.01 for 30 s (and 15 min recovery), and p < 0.001 for the rest], with the exception of 20 min recovery, were significantly different from placement. C, D, Data for one of the interneurons with the same format as in Figure 3, C and D.
Effects of a 5-HT1A and a 5-HT3 receptor antagonist on responses of dorsal horn interneurons
Effects of 5-HT antagonists were tested against depression of synaptic actions of group II afferents after stimulation in raphe nuclei, using procedures that were used previously for investigating effects of noradrenaline antagonists (Skoog and Noga, 1991). When placing the stimulating electrodes, attempts were made to reach the region just dorsal to the trapezoid body to maximize effects of stimulation of raphespinal neurons and minimize those of the coexcited reticulospinal fibers. Previous studies have demonstrated that stimuli applied within or in the vicinity of raphe nuclei result in an increase in 5-HT concentration in the spinal cord (Abhold and Bowker, 1990; Bowker and Abhold, 1990; Hentall et al., 2003.) and that they depress monosynaptic field potentials from group II afferents (Skoog and Noga, 1991; Noga et al., 1992). However, the depression of the field potentials might be caused not only by presynaptic and postsynaptic actions of 5-HT released from the raphespinal tract fibers but also by presynaptic inhibition mediated by GABAergic interneurons activated by coexcited reticulospinal neurons, as indicated by depolarization of terminals of group II afferents from the region of the raphe nuclei (Riddell et al., 1993). However, any contribution of GABAergic presynaptic inhibition to the depression attributable to presynaptic actions of 5-HT (Proudfit et al., 1980; Khasabov et al., 1998; Khasabov et al., 1999) would likely be greater from locations dorsal and lateral to the raphe nuclei (Noga et al., 1992, their Figs. 9, 10). For this reason, we selected the stimulation sites from which the depression of dorsal horn field potentials was maximal (Figs. 1B, 2F) but after having verified that no comparable depression was evoked from more dorsal sites (Fig. 2G) where reticulospinal rather than raphespinal tract fibers would be preferably stimulated. Intervals between the conditioning and testing stimuli were kept within the range of 45-60 ms at which effects of faster conducting reticulospinal fibers would considerably decline and should be long enough to allow effects of slower conducting raphespinal fibers to manifest themselves (Noga et al., 1992, 1995). As reported by Noga et al. (1995), the depression was to <30% of control at intervals exceeding 45 ms but to only 70-80% at intervals of 20-30 ms.
Figure 5 illustrates the effects of raphe stimulation on the responses of two dorsal horn interneurons evoked by group II afferents. When stimulation of group II afferents was preceded by a train of stimuli applied in the raphe nucleus in the absence of 5-HT antagonists, the interneurons failed to respond (Fig. 5B,D), or the probability of their activation was greatly reduced, as shown by much smaller amplitudes of gray cumulative sums of responses evoked by nerve stimulation (labeled control 2) in Figure 5, C and F. This effect was counteracted by ionophoretic application of the 5-HT1A receptor antagonist WAY 100635 and the 5-HT3 receptor antagonist Y-25130. Cumulative sums in Figure 5, C and F, show that the number of responses evoked by group II afferents after raphe stimulation increased toward the same level as without raphe stimulation (control 1) during 4-11 min of WAY 100635 ionophoresis and 1-5 min of Y-25130 ionophoresis. Similarly, clear-cut effects of WAY 100635 were seen on responses of 9 of 22 interneurons tested. In six interneurons, they were weaker and/or less regular, and in seven interneurons, they were uncertain when analyzed separately. However, Figure 6A shows that changes in the mean number of responses of all these interneurons were in the same direction. When raphe stimuli reduced them, on average, to 10.6 ± 3.2% of control (in all cells tested and 15.1 ± 5.6% in cells where WAY 100635 had a clear effect), the antagonist increased their mean numbers to 47.6 ± 11.0% of control (in all cells and 63.1 ± 15.6% in those with clear effect). The mean time course of the nine responses in which WAY 100635 had a clear effect (Fig. 6A, gray) is plotted in Figure 6B, showing that its onset occurred within the first 2 min of ionophoresis and that it reached maximum after 10 min (in individual interneurons between 3 and 12 min). The maximum recovery was back to 6.0 ± 3.0% (in all cells tested and 9.5 ± 6.2% in those with clear effect).
Figure 5.

Examples of the effects of 5-HT1A and 5-HT3 receptor antagonists on the depression of activity of dorsal horn interneurons from raphe nuclei. Records from two interneurons (A-C and D-F) in two experiments are shown. A, D, Top traces, Extracellular records after stimulation of the Sart nerve. Dotted lines indicate the discrimination level for construction of peristimulus time histograms and cumulative sums. Bottom traces, Parallel records from the cord dorsum at a lumbar level. B, E, As in A and D but when the Sart nerve stimulation was preceded by raphe stimulation leading to the disappearance of responses of the interneurons or to a lower probability of their activation. C, F, Cumulative sums of responses evoked by 20 stimuli, each response lifting the curve by one step in real time (with the calibration at the bottom in C). Black, Responses evoked by group II afferents in the absence of raphe stimuli (test control, corresponding to A and D). Gray, Reduced number of responses evoked when raphe stimuli preceded stimulation of group II afferents (corresponding to B and E) before (conditioned control) and during ionophoresis of the antagonists (after the indicated periods of ionophoresis).
Figure 6.

The degree and time course of disinhibition evoked by 5-HT1A and 5-HT3 receptor antagonists. Mean disinhibition, time course, and test response in the presence of WAY 100635 (A-C), Y-25130 (D-F), and bicuculline (G-I) are shown. A, Mean depression and SEM of the response to nerve stimulation when preceded by raphe stimulation (conditioned response), shown as a percentage of the response to nerve stimulation alone (test) during control, placement of drug containing pipette (placem.), maximal effect during ionophoresis (max drug), and after 20-30 min of recovery (max recovery) for the nine cells in which WAY 100635 consistently reversed the depression (gray) and all 22 cells in which WAY 100635 was tested (white). B, Time course of the effects of WAY 100635. Ordinate: mean-conditioned response to 20 stimuli shown as a percentage of test response. Abscissa: time points of measurements before and after placement of drug-containing pipette during ionophoresis and recovery. The means are based on the nine responses in which the most clear-cut reversal of the raphe depression was seen (A, gray). The shaded area represents the duration of ionophoresis. WAY 100635 significantly (p < 0.05) counteracted the depression from 9 min through withdrawal of the drug-containing pipette. C, Responses evoked by 20 test stimuli were not affected by WAY 100635 application. D-F, Effects of Y-25130 shown in the same format as A-C. Mean depressions (D) are shown for control, placement, maximum drug, and maximum recovery for the six cells in which Y-25130 reversed the depression (gray) and in all 17 cells in which Y-25130 was tested (white). The effects of Y-25130 were significantly different from placement (p < 0.05) from 3 to 4 min and 6 min ionophoresis through 10 min recovery. G-I, Effects of bicuculline are shown in the same format as in A-C. Mean conditioned responses (G) are for four cells in which bicuculline had an effect (gray) and all nine cells tested with bicuculline (white): control, placement, maximum drug, and maximum recovery. Conditioned responses (H) exceeded test responses in the presence of bicuculline, as seen by responses exceeding 100%. The test response (I) decreased during bicuculline application.
The 5-HT3 receptor antagonist Y-25130 has been found to have very clear-cut effects on responses from 6 of 17 interneurons, weaker or less regular effects on six interneurons, and uncertain effects on the five remaining interneurons. However, the pooled data for all of these interneurons (Fig. 6D) revealed a strong effect (control, 17.7 ± 4.3% in all, 11.0 ± 5.9% in those with clear effect; maximum drug, 51.2 ± 6.6% in all, 64.3 ± 2.9% in those with clear effect; recovering to 15.3 ± 4.5% in all, 13.3 ± 4.0% in those with clear effect) as of WAY 100635. The series of cumulative sums in Figure 5F and pooled data from Figure 6E also suggest that its effects might reach maximum somewhat faster, within 4-5 min (in individual interneurons, between 2 and 6 min) and show similar dynamic properties as those of the 5-HT3 agonist.
To test the possibility that the depression after raphe stimuli was not only attributable to the release of 5-HT but also to presynaptic inhibition via GABAergic interneurons, effects of the GABAA receptor antagonist bicuculline were tested on responses of five dorsal horn interneurons (in nine test series in which different peripheral stimuli were used to activate these neurons). As in the case of WAY 100635 and Y-25130, clear-cut (n = 4), weak (n = 4), and uncertain effects (n = 1) were found in the different test series. The overall effects of bicuculline (Fig. 6G,H) were at least as effective as those of 5-HT agonists and, in some cases, not only reduced the depression but caused excitation: from 13.6 ± 6.2% in control (in all cells, 8.1 ± 4.9% in cells with clear effect) to 120.0 ± 42.9% (in all cells, 185.6 ± 90.8% in cells with clear effect). These responses recovered almost completely within 15 min (21.2 ± 5.9% in all, 22.2 ± 7.5% in cells with clear effect). Considering that effects of stimuli applied in raphe nuclei were secondary to the release of both 5-HT and GABA, these observations may explain the lower effectiveness of the serotonergic antagonists than of agonists.
Receptor immunocytochemistry
The sample of labeled interneurons included six interneurons with EPSPs from group II afferents of Q and/or Sart. As shown in Figure 7, the earliest components of EPSPs evoked in these neurons were followed by EPSPs or IPSPs at 1-2 ms longer latencies; this pattern of input corresponds to that found in previously investigated dorsal horn group II interneurons (Edgley et al., 2003). The sample may thus be considered as representative. The latencies of the earliest components of the EPSPs were ∼1.7 ms from the group I afferent volleys (Fig. 7, first dotted lines) but were ∼0.9 ms from the estimated time of arrival of afferent volleys in slower conducting group II afferents (second dotted lines) and therefore compatible with monosynaptic coupling. EPSPs and IPSPs occurring 1 ms later may thus be classified as evoked disynaptically. The interneurons were located in the lateral third of laminas IV-V (Fig. 8C) with dendrites distributed to the gray matter in laminas I-VI, extending on occasions into the lateral funiculus. Axons of two interneurons (Table 1, 2/1, 4/1) projected caudally via the ipsilateral lateral funiculus, another (1/2) sent a collateral to the same tract but the direction of projection could not be determined, and one other (3/1) was followed to the contralateral ventral funiculus where it also projected caudally. Axons of the remaining two interneurons were not labeled.
Figure 7.

Examples of records from the intracellularly labeled dorsal horn interneurons. In all panels, top records are from the interneurons, and bottom records are from the cord dorsum. 1/1-5/1, EPSPs recorded in interneurons listed in Table 1 (in cats 1-5). They were evoked by stimulation of either the quadriceps (Q) or sartorius (Sart) nerves at five times threshold for a given nerve, as indicated at the left. The dotted lines indicate the time of arrival of afferent volleys in group I afferents, the estimated time of arrival of afferent volleys in group II afferents (delayed by 0.7-0.8 ms), and latencies of the earliest EPSPs. It will be noted that both the shortest (monosynaptic) and longer (monosynaptic or disynaptic) latency EPSPs (with their latencies indicated to the left) were followed by some later EPSPs or IPSPs.
Figure 8.
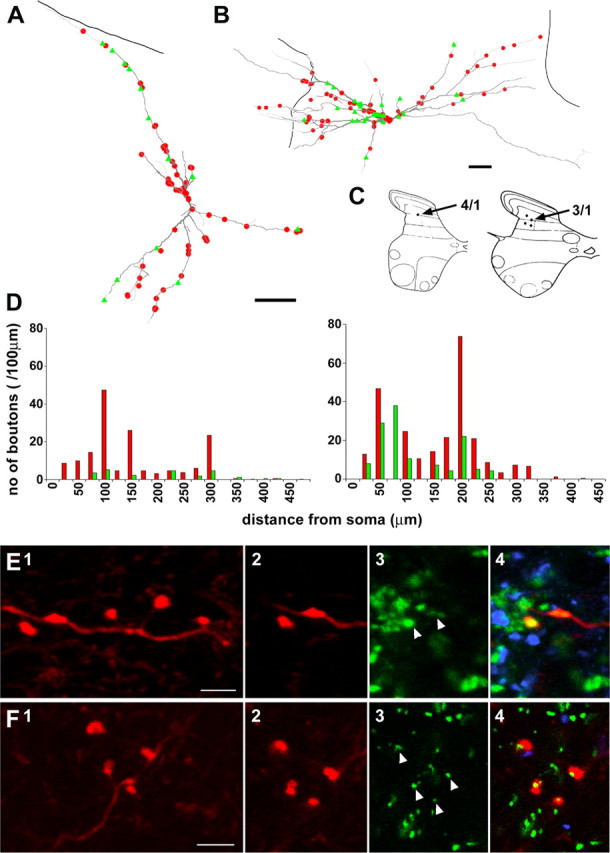
Distribution of 5-HT-immunoreactive axons and terminals immunoreactive for 5-HT3A receptor subunits in close apposition to dorsal horn interneurons. A, B, Reconstructions of cells 4/1 (A) and 3/1 (B); contacts formed by 5-HT axons are indicated in red, and contacts from 5-HT3-immunoreactive axons are indicated in green. The thicker gray lines demarcate the border of the gray matter. Scale bars, 50 μm. C, Positions of labeled cell bodies in the dorsal horn. Cell 5/1 was obtained from an experiment in which the tissue was sectioned in the sagittal plane and is not shown on the diagram but was situated dorsal to the reticulated area of lamina V. D, Sholl plots illustrating the distribution of 5-HT- and 5-HT3-immunoreactive varicosities on the dendritic trees (cell 4/1, left; 3/1, right). E, Series of confocal microscope images demonstrating that terminals from cell 4/1 are immunopositive for VGLUT2. 1, Projected images (red); 2-4, single optical sections of axonal swellings showing VGLUT2 (blue) and GAD (green) immunostaining. F, Series of confocal microscope images showing that terminals from cell 3/1 are closely apposed to labeling for the glycine receptor-associated protein, gephyrin. 1, Projected image showing a cluster of four boutons (red); 2-4, single optical sections showing immunoreactivity for VGLUT1 (blue) and gephyrin (green) and a merged image, respectively. Arrowheads indicate gephyrin-immunoreactive puncta that are associated with axonal swellings. Scale bars, 5 μm.
Table 1.
The numbers and contact densities of 5-HT and 5-HT3 axon terminals in apposition to cell bodies and dendrites of dorsal horn interneurons
|
|
|
|
|
Soma |
Dendrites |
||||||||||||||||||
|---|---|---|---|---|---|---|---|---|---|---|---|---|---|---|---|---|---|---|---|---|---|---|---|
| Cat/Cell ID |
Total number of contacts |
Number of contacts |
Surface area (μm2) |
Contact density (n/100 μm2) |
Total dendritic length (μm) |
Number of contacts |
Surface area (μm2) |
Contact density (n/100) |
|||||||||||||||
| NT |
5-HT |
5-HT3
|
5-HT |
5-HT3
|
5-HT |
5-HT3
|
5-HT |
5-HT3
|
5-HT |
5-HT3
|
|||||||||||||
| 1/1 | nk | 53 | 52 | 9 | 20 | 725.46 | 1.24 | 2.76 | 952.7 | 44 | 32 | 5964.66 | 0.74 | 0.54 | |||||||||
| 1/2 | nk | 229 | 78 | 23 | 32 | 1606.63 | 1.43 | 1.93 | 4081.5 | 206 | 46 | 26835.7 | 0.76 | 0.17 | |||||||||
| 2/1 | nk | 30 | 6 | 3 | 0 | 508.85 | 0.59 | 0 | 1766.7 | 27 | 6 | 10753 | 0.25 | 0.06 | |||||||||
| 3/1 | Gly | 66 | 39 | 0 | 5 | 678.52 | 0 | 0.74 | 5227.4 | 66 | 34 | 20625.4 | 0.32 | 0.16 | |||||||||
| 4/1 | Glut | 71 | 15 | 11 | 2 | 1400.61 | 0.86 | 0.14 | 3539.8 | 60 | 13 | 17173.3 | 0.35 | 0.08 | |||||||||
| 5/1 |
nk |
60 |
19 |
14 |
4 |
3502.86 |
0.4 |
0.11 |
3349.7 |
46 |
15 |
29700.3 |
0.15 |
0.05 |
|||||||||
NT, Nerve transmitter; Gly, terminals immunopositive for gephyrin; Glut, terminals immunopositive for VGLUT2; nk, transmitter unknown.
Axon terminals immunoreactive for 5-HT3A receptor subunits were found in association with all interneurons (Table 1), including both excitatory (Fig. 8A, cell 4/1) and inhibitory (Fig. 8B, cell 3/1) interneurons. These two interneurons were characterized by the presence of vesicular glutamate transporter 2 in terminals of the excitatory one (Fig. 8E) and by the apposition of terminals to gephyrin (glycine receptor-associated protein) (Fig. 8F3, arrows) for the inhibitory interneuron (Fig. 8F). This latter interneuron was not immunoreactive for glutamate decarboxylase (data not shown).
5-HT3A-immunoreactive axons were distributed sparsely along the dendrites of all neurons (Fig. 8A,B) but were concentrated around the cell bodies of two interneurons (1/1 and 1/2) where they formed ring-like structures (Fig. 9A2,A4,B2,B4). This arrangement is striking because there are relatively few 5-HT3A-immunoreactive axons in this area (illustrated in the single optical sections shown in Fig. 9A2-D2).
Figure 9.
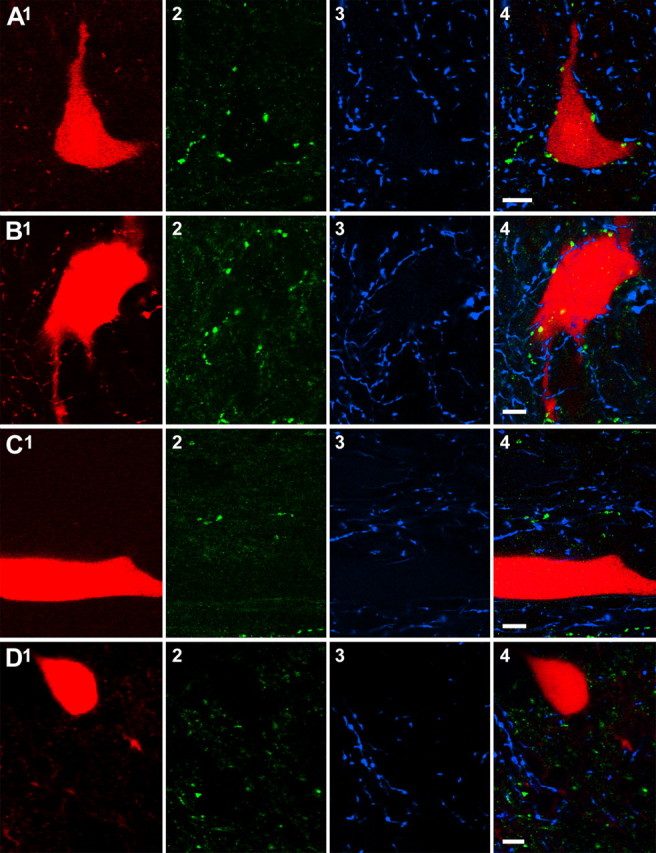
Clustering of terminals immunoreactive for 5-HT3A receptor subunits around somata of dorsal horn interneurons. A series of single optical sections of four neurons (A, cell 1/1; B, cell 1/2; C, cell 5/1; D, cell 2/1) show that two of these (A, B) had contacts from both types of immunolabeled axons clustered around the somata. Two additional cells from the sample (C, D) show no such arrangements, although immunoreactive axons are present in the surrounding tissue. 1, Sections through labeled cells (red); 2, 3, immunolabeling for 5-HT3A receptor subunits (green) and 5-HT (blue); 4, merged images. Scale bars, 10 μm.
The distribution of 5-HT3A varicosities along the dendrites followed two patterns. First, two cells showed similar low-contact densities at different distances from the soma (Fig. 8D, left panel). Second, the contact density was higher on proximal than on distal dendrites (Fig. 8D, right panel). This latter type of distribution was also found in interneurons with ring-like immunoreactive varicosities (1/1 and 1/2).
Generally, 5-HT3A-immunopositive axons were less numerous than 5-HT varicosities in apposition to the interneurons, and there was no obvious relationship between 5-HT axons and those possessing 5-HT3A receptor subunits. This is illustrated by the separation of red and green symbols in Figure 8, A and B, and different locations of green and blue varicosities in Figure 9, A4 and B4. There was considerable variation in the total numbers of contacts for individual neurons, with numbers ranging from 30 to 229 for 5-HT and 6 to 78 for 5-HT3A terminals per cell. The mean numbers of 5-HT3A-immunoreactive axons was approximately half that of 5-HT axons, considering both the total numbers, and contact densities on the soma and dendrites. However, in two interneurons, with the ring-like arrangements of 5-HT3A terminals, the number and the density of 5-HT3A-immunoreactive terminals were higher for the soma (Table 1, rows 1/1, 1/2).
Discussion
The results show that 5-HT depresses the activity of dorsal horn interneurons in pathways from group II afferents via both metabotropic (5-HT1A&7) and ionotropic (5-HT3) membrane receptors. These results are consistent with the previously reported effects of 5-HT1A&7 and 5-HT3 membrane receptor agonists on synaptic actions of group II afferents on unspecified dorsal horn neurons (Bras et al., 1990).
The same experimental procedures as in previous studies (Bras et al., 1990; Jankowska et al., 2000; Hammar et al., 2004) were used for agonist ionophoresis to allow us to rely on previous tests of the specificity of effects evoked under our experimental conditions. In contrast, the procedure of testing effects of ionophoresis of 5-HT antagonists against effects of raphe stimulation was new. The effects of these antagonists, in addition, were differentiated from any effects of GABAA receptor-mediated inhibition likely induced by coactivated reticulospinal tract neurons (Lovick, 1983; Riddell et al., 1993) by susceptibility to bicuculline.
Bicuculline counteracted the raphe stimulation-induced depression of dorsal horn neurons, suggesting that presynaptic GABAergic inhibition did contribute to the depression. However, effects of bicuculline must be interpreted cautiously, because there are indications of interactions between GABA and 5-HT ligands and receptors. For instance, it has been demonstrated that certain GABAA receptor antagonists, including bicuculline, inhibit 5-HT3 receptors (Sun and Machu, 2000; Das et al., 2003), and certain 5-HT3 receptor ligands interact with GABA receptors (Kawamata et al., 2003) and glycine receptors (Maksay, 1998; Chesnoy-Marchais et al., 2000). Other complicating factors are that, in the presence of bicuculline, the depression was not only counteracted but replaced by excitation (possibly by unmasking an excitatory pathway) and that bicuculline might also reduce the test responses. The latter effect suggests that it might also interact with an excitatory receptor, such as the nicotinic acetylcholine receptor possibly found on primary afferents (Ninkovic and Hunt, 1983; Khan et al., 2003) and known to be blocked by bicuculline (Demuro et al., 2001).
8-OH-DPAT interacts with both 5-HT1A and 5-HT7 membrane receptors (Barnes and Sharp, 1999; Hochman et al., 2001; Hoyer et al., 2002; Alexander et al., 2004). However, the effect of WAY100635, an antagonist specific for the 5-HT1A receptor (Forster et al., 1995), in reversing the 5-HT-induced depression increases our confidence in the involvement of 5-HT1A receptors. 8-OH DPAT, like a number of other 5-HT agonists, could act postsynaptically and/or presynaptically at the level of presynaptic terminals of sensory fibers and other neurons (Pompeiano et al., 1992).
5-HT effects mediated by 5-HT3 receptors could be reasonably and reliably attributed to presynaptic actions (Proudfit et al., 1980; Singer and Berger, 1996; Singer et al., 1996; Khasabov et al., 1999), because 5-HT3 receptors are present on the axon terminals of small primary afferent fibers (in particular, C, possibly Aδ fibers) and on excitatory interneurons and interneuron terminals in the dorsal horn (Kia et al., 1996; Zeitz et al., 2002; Maxwell et al., 2003). However, because 5-HT3A subunit immunoreactivity is not found on axons labeled with VGLUT 1 or myelinated axons that transport CTb in laminas III-VI of rat dorsal horn (D. Conte, E. D. Legg, A. C. McCourt, E. Silajdzic, G. G. Nagy, and D. J. Maxwell, unpublished observations), it is unlikely that the 5-HT3 receptors are on the terminals of group II muscle afferents themselves. It is much more likely that they are present on excitatory interneurons as they colocalize with the vesicular glutamate transporter 2, which is found mainly within terminals of spinal interneurons (Todd et al., 2003; Conte, Legg, McCourt, Silajdzic, Nagy, and Maxwell, unpublished observations). 5-HT-induced depression mediated by 5-HT3 receptors may thus occur as a consequence of reduction of actions of excitatory interneurons, which provide background input to dorsal horn interneurons or mediate their disynaptic or polysynaptic excitation from group II afferents.
Two series of present experiments dealt with involvement of 5-HT3 receptors. In one of these, the highly selective 5-HT3 receptor agonist 2-Me 5-HT (Hochman et al., 2001; Alexander et al., 2004) was found to depress responses of dorsal interneurons from group II afferents and the 5-HT3 receptor antagonist Y-25130 to reduce the depression evoked by stimuli applied in the raphe nuclei. In the other, axon terminals immunoreactive for 5-HT3A receptors were shown to surround the dorsal horn interneurons.
In pain pathways, 5-HT acting on 5-HT3 receptors has been reported to have both excitatory and inhibitory effects (Peng et al., 1996; Green et al., 2000; for review, see Hochman et al., 2001). In contrast, only inhibitory actions have been found to be evoked via 5-HT3 receptors on dorsal horn interneurons activated by group II afferents. In addition, no obvious differences occurred in effects of 2-Me 5-HT on the sample of the 10 of 11 cells tested, and the lack of effects on the 11th cell could be attributable to technical reasons. It is therefore of interest that subgroups of dorsal horn group interneurons showed a tendency to be targeted in a specific way by axons that possess 5-HT3A receptors on their terminals. If the data for interneurons 3/1 and 4/1 are representative, they would suggest that inhibitory neurons have cell bodies that are surrounded by axons that are immunoreactive for the 5-HT3A subunit (Fig. 8), although this arrangement may be absent on excitatory cells.
Because there was no clear relationship between 5-HT axons and axons possessing 5-HT3A receptor subunits, we hypothesize that 5-HT depresses excitatory transmission to dorsal horn interneurons by acting on terminals of excitatory input cells via volume transmission, 5-HT3 receptors having a high affinity for 5-HT (mean Ki = 160 nm in rat nervous system; PDSP database: http://kidb.cwru.edu/pdsp.php). Volume transmission could also be involved in actions mediated by 5-HT1A membrane receptors. Nevertheless, the higher density of the 5-HT3A than that of 5-HT-immunoreactive terminals in apposition to soma and proximal dendrites might explain differences in dynamics of effects of 5-HT3 and 5-HT1A receptor agonists and antagonists on dorsal horn interneurons if effects of 2-Me 5-HT and Y-25130 on 5-HT3 receptors would require a shorter time to diffuse from the ionophoretic electrode, which was always located close to the soma. This, along with faster ionotropic (5-HT3) versus metabotropic (5-HT1A) actions, could account for the lag in effect.
As for the consequences of the enhanced or weakened control of dorsal horn interneurons by 5-HT for the state-dependent actions of group II afferents on contralateral motoneurons, the results of the present study lead to the following conclusions. First, they show that effects of 5-HT are associated with the modulation of actions of group II afferents on dorsal horn interneurons both postsynaptically (via 5-HT1A membrane receptors) and presynaptically (via 5-HT3, possibly also 5-HT1A and/or other metabotropic 5-HT receptors). By acting presynaptically via metabotropic receptors, 5-HT may weaken transmission from group II afferents to dorsal horn interneurons and strengthen the effects of the GABAergic presynaptic inhibition. In both cases, when the raphespinal connections are interrupted, dorsal horn interneurons would be more effectively activated, and their actions on commissural interneurons would be enhanced. Systemically applied 5-HT1A membrane receptor agonists and antagonists (8-OH DPAT, WAY 100635) would change this situation and restore the postsynaptic, and possibly also presynaptic, depression of activation of dorsal horn interneurons.
Second, if postsynaptic actions of 5-HT on excitatory and inhibitory dorsal horn interneurons are similar, they may not be compatible with the major role of these actions for the funneling of nerve impulses from group II afferents to contralateral motoneurons (Aggelopoulos et al., 1996) via either excitatory or inhibitory commissural interneurons (Bannatyne et al., 2003; Butt and Kiehn, 2003). However, the presynaptic actions via 5-HT3 membrane receptors on dorsal horn interneurons appear to be more differentiated. If we hypothesize that these actions are stronger on inhibitory interneurons (see below), after damage to raphespinal connections, these interneurons might be relatively more released from the depressive actions of 5-HT, and inhibition of commissural interneurons by dorsal horn interneurons may become stronger than the excitation. This would not by itself explain stronger actions of excitatory commissural interneurons on contralateral motoneurons in the absence of 5-HT. However, one might putatively consider that actions of excitatory dorsal horn interneurons have greater impact on the excitatory commissural interneurons and actions of inhibitory dorsal horn interneurons on inhibitory commissural interneurons and, in addition, that the coupling between the excitatory commissural interneurons with contralateral motoneurons is stronger than the coupling of the inhibitory interneurons. Under these conditions, lack of 5-HT control of dorsal horn interneurons would contribute to the dominance of the crossed excitation.
5-HT might also act on interneurons that mediate disynaptic excitation or inhibition of dorsal horn interneurons and on synaptic transmission between them. It might also act on polysynaptic actions of commissural interneurons on contralateral motoneurons. There are indications that such interneurons are located in the ventral horn and in the intermediate zone at the same side as the contralateral motoneurons (Matsuyama and Mori, 1998; Bannatyne et al., 2003; Matsuyama et al., 2004). The choice between these putative explanations would require that we know more about properties of different functional categories of neurons in these networks.
Footnotes
This work was supported by National Institutes of Health Grant NS40863. We thank Dr. S. Hochman for his helpful comments and Rauni Larsson for her invaluable assistance.
Correspondence should be addressed to E. Jankowska, Department of Physiology and Pharmacology, Medicin-aregatan 11, Box 432, 405 30 Göteborg, Sweden. E-mail: Elzbieta.Jankowska@physiol.gu.se.
K. J. Dougherty's present address: Department of Physiology, Emory University, 615 Michael Street, Atlanta, GA 30322.
P. Krutki's present address: Department of Neurobiology, University School of Physical Education, 60-352 Poznań, Poland.
Copyright © 2005 Society for Neuroscience 0270-6474/05/250584-11$15.00/0
References
- Abhold RH, Bowker RM (1990) Descending modulation of dorsal horn biogenic amines as determined by in vivo dialysis. Neurosci Lett 108: 231-236. [DOI] [PubMed] [Google Scholar]
- Aggelopoulos NC, Burton MJ, Clarke RW, Edgley SA (1996) Characterization of a descending system that enables crossed group II inhibitory reflex pathways in the cat spinal cord. J Neurosci 16: 723-729. [DOI] [PMC free article] [PubMed] [Google Scholar]
- Alexander SP, Mathie A, Peters JA (2004) Guide to receptors and channels. Br J Pharmacol 141[Suppl 1]: S1-S126. [DOI] [PMC free article] [PubMed] [Google Scholar]
- Alstermark B, Kummel H, Tantisira B (1987) Monosynaptic raphespinal and reticulospinal projection to forelimb motoneurones in cats. Neurosci Lett 74: 286-290. [DOI] [PubMed] [Google Scholar]
- Bannatyne BA, Edgley SA, Hammar I, Jankowska E, Maxwell DJ (2003) Networks of inhibitory and excitatory commissural interneurons mediating crossed reticulospinal actions identified by immunocytochemistry. Eur J Neurosci 18: 2273-2284. [DOI] [PMC free article] [PubMed] [Google Scholar]
- Barnes NM, Sharp T (1999) A review of central 5-HT receptors and their function. Neuropharmacology 38: 1083-1152. [DOI] [PubMed] [Google Scholar]
- Bowker RM, Abhold RH (1990) Evoked changes in 5-hydroxytryptamine and norepinephrine release: in vivo dialysis of the rat dorsal horn. Eur J Pharmacol 175: 101-106. [DOI] [PubMed] [Google Scholar]
- Bras H, Jankowska E, Noga B, Skoog B (1990) Comparison of effects of various types of NA and 5-HT agonists on transmission from group II muscle afferents in the cat. Eur J Neurosci 2: 1029-1039. [DOI] [PubMed] [Google Scholar]
- Butt SJ, Kiehn O (2003) Functional identification of interneurons responsible for left-right coordination of hindlimbs in mammals. Neuron 38: 953-963. [DOI] [PubMed] [Google Scholar]
- Chesnoy-Marchais D, Levi S, Acher F (2000) Glycinergic potentiation by some 5-HT3 receptor antagonists: insight into selectivity. Eur J Pharmacol 402: 205-213. [DOI] [PubMed] [Google Scholar]
- Das P, Bell-Horner CL, Machu TK, Dillon GH (2003) The GABA(A) receptor antagonist picrotoxin inhibits 5-hydroxytryptamine type 3A receptors. Neuropharmacology 44: 431-438. [DOI] [PubMed] [Google Scholar]
- Demuro A, Palma E, Eusebi F, Miledi R (2001) Inhibition of nicotinic acetylcholine receptors by bicuculline. Neuropharmacology 41: 854-861. [DOI] [PubMed] [Google Scholar]
- Edgley SA, Jankowska E (1987a) Field potentials generated by group II muscle afferents in the middle lumbar segments of the cat spinal cord. J Physiol (Lond) 385: 393-413. [DOI] [PMC free article] [PubMed] [Google Scholar]
- Edgley SA, Jankowska E (1987b) An interneuronal relay for group I and II muscle afferents in the midlumbar segments of the cat spinal cord. J Physiol (Lond) 389: 647-674. [DOI] [PMC free article] [PubMed] [Google Scholar]
- Edgley SA, Jankowska E (1988) Information processed by dorsal horn spinocerebellar tract neurones in the cat. J Physiol (Lond) 397: 81-97. [DOI] [PMC free article] [PubMed] [Google Scholar]
- Edgley SA, Jankowska E, Krutki P, Hammar I (2003) Both dorsal horn and lamina VIII interneurones contribute to crossed reflexes from group II muscle afferents. J Physiol (Lond) 552: 961-974. [DOI] [PMC free article] [PubMed] [Google Scholar]
- Engberg I, Källström Y, Marshall KC (1972) Double micromanipulator for independent impalements of one neurone with two electrodes. Acta Physiol Scand 84: 4A. [Google Scholar]
- Forster EA, Cliffe IA, Bill DJ, Dover GM, Jones D, Reilly Y, Fletcher A (1995) A pharmacological profile of the selective silent 5-HT1A receptor antagonist, WAY-100635. Eur J Pharmacol 281: 81-88. [DOI] [PubMed] [Google Scholar]
- Green GM, Scarth J, Dickenson A (2000) An excitatory role for 5-HT in spinal inflammatory nociceptive transmission; state-dependent actions via dorsal horn 5-HT(3) receptors in the anaesthetized rat. Pain 89: 81-88. [DOI] [PubMed] [Google Scholar]
- Hammar I, Bannatyne BA, Maxwell DJ, Edgley SA, Jankowska E (2004) The actions of monoamines and distribution of noradrenergic and serotoninergic contacts on different subpopulations of commissural interneurons in the cat spinal cord. Eur J Neurosci 19: 1305-1316. [DOI] [PMC free article] [PubMed] [Google Scholar]
- Hentall ID, Pinzon A, Noga BR (2003) Pattern of spinal monoamine release produced by raphe magnus stimulation. Soc Neurosci Abstr 29: 481.419. [Google Scholar]
- Hochman S, Garraway SM, Machacek DW, Shay BL (2001) 5-HT receptors and the neuromodulatory control of spinal cord function. In: Motor neurobiology of the spinal cord (Cope TC, ed), pp 47-87. Boca Raton, FL: CRC.
- Hoyer D, Hannon JP, Martin GR (2002) Molecular, pharmacological and functional diversity of 5-HT receptors. Pharmacol Biochem Behav 71: 533-554. [DOI] [PubMed] [Google Scholar]
- Jankowska E, Riddell JS, Skoog B, Noga BR (1993) Gating of transmission to motoneurones by stimuli applied in the locus coeruleus and raphe nuclei of the cat. J Physiol (Lond) 461: 705-722. [DOI] [PMC free article] [PubMed] [Google Scholar]
- Jankowska E, Hammar I, Chojnicka B, Heden CH (2000) Effects of monoamines on interneurons in four spinal reflex pathways from group I and/or group II muscle afferents. Eur J Neurosci 12: 701-714. [DOI] [PubMed] [Google Scholar]
- Kawamata T, Omote K, Toriyabe M, Yamamoto H, Namiki A (2003) The activation of 5-HT3 receptors evokes GABA release in the spinal cord. Brain Res 978: 250-255. [DOI] [PubMed] [Google Scholar]
- Khan I, Osaka H, Stanislaus S, Calvo RM, Deerinck T, Yaksh TL, Taylor P (2003) Nicotinic acetylcholine receptor distribution in relation to spinal neurotransmission pathways. J Comp Neurol 467: 44-59. [DOI] [PubMed] [Google Scholar]
- Khasabov SG, Lopez-Garcia JA, King AE (1998) Serotonin-induced population primary afferent depolarisation in vitro: the effects of neonatal capsaicin treatment. Brain Res 789: 339-342. [DOI] [PubMed] [Google Scholar]
- Khasabov SG, Lopez-Garcia JA, Asghar AU, King AE (1999) Modulation of afferent-evoked neurotransmission by 5-HT3 receptors in young rat dorsal horn neurones in vitro: a putative mechanism of 5-HT3 induced anti-nociception. Br J Pharmacol 127: 843-852. [DOI] [PMC free article] [PubMed] [Google Scholar]
- Kia HK, Miquel MC, Brisorgueil MJ, Daval G, Riad M, El Mestikawy S, Hamon M, Vergé D (1996) Immunocytochemical localization of serotonin1A receptors in the rat central nervous system. J Comp Neurol 365: 289-305. [DOI] [PubMed] [Google Scholar]
- Krnjevic K (1971) Microiontophoresis. In: Methods of neurochemistry (Fried H, ed), pp 129-171. New York: Dekker.
- Lovick TA (1983) The role of 5-HT, GABA and opioid peptides in presynaptic inhibition of tooth pulp input from the medial brainstem. Brain Res 289: 135-142. [DOI] [PubMed] [Google Scholar]
- Maksay G (1998) Bidirectional allosteric modulation of strychnine-sensitive glycine receptors by tropeines and 5-HT3 serotonin receptor ligands. Neuropharmacology 37: 1633-1641. [DOI] [PubMed] [Google Scholar]
- Matsuyama K, Mori S (1998) Lumbar interneurons involved in the generation of fictive locomotion in cats. Ann NY Acad Sci 860: 441-443. [DOI] [PubMed] [Google Scholar]
- Matsuyama K, Nakajima K, Mori F, Aoki M, Mori S (2004) Lumbar commissural interneurons with reticulospinal inputs in the cat: morphology and discharge patterns during fictive locomotion. J Comp Neurol 474: 546-561. [DOI] [PubMed] [Google Scholar]
- Maxwell DJ, Kerr R, Jankowska E, Riddell JS (1997) Synaptic connections of dorsal horn group II spinal interneurons: synapses formed with the interneurons and by their axon collaterals. J Comp Neurol 380: 51-69. [PubMed] [Google Scholar]
- Maxwell DJ, Hartley R, Todd AJ, Arber S, Kramer I, Jessell TM (2002) Characterization of spinal interneuron subpopulations with green fluorescent protein by mouse genetic. Soc Neurosci Abstr 28: 850.853. [Google Scholar]
- Maxwell DJ, Kerr R, Rashid S, Anderson E (2003) Characterisation of axon terminals in the rat dorsal horn that are immunoreactive for serotonin 5-HT3A receptor subunits. Exp Brain Res 149: 114-124. [DOI] [PubMed] [Google Scholar]
- Ninkovic M, Hunt SP (1983) Alpha-bungarotoxin binding sites on sensory neurones and their axonal transport in sensory afferents. Brain Res 272: 57-69. [DOI] [PubMed] [Google Scholar]
- Noga BR, Bras H, Jankowska E (1992) Transmission from group II muscle afferents is depressed by stimulation of locus coeruleus/subcoeruleus, Kolliker-Fuse and raphe nuclei in the cat. Exp Brain Res 88: 502-516. [DOI] [PubMed] [Google Scholar]
- Noga BR, Jankowska E, Skoog B (1995) Depression of transmission from group II muscle afferents by electrical stimulation of the cuneiform nucleus in the cat. Exp Brain Res 105: 25-38. [DOI] [PubMed] [Google Scholar]
- Peng YB, Lin Q, Willis WD (1996) The role of 5-HT3 receptors in periaque-ductal gray-induced inhibition of nociceptive dorsal horn neurons in rats. J Pharmacol Exp Ther 276: 116-124. [PubMed] [Google Scholar]
- Pompeiano M, Palacios JM, Mengod G (1992) Distribution and cellular localization of mRNA coding for 5-HT1A receptor in the rat brain: correlation with receptor binding. J Neurosci 12: 440-453. [DOI] [PMC free article] [PubMed] [Google Scholar]
- Proudfit HK, Larson AA, Anderson EG (1980) The role of GABA and serotonin in the mediation of raphe-evoked spinal cord dorsal root potentials. Brain Res 195: 149-165. [DOI] [PubMed] [Google Scholar]
- Riddell JS, Jankowska E, Eide E (1993) Depolarization of group II muscle afferents by stimuli applied in the locus coeruleus and raphe nuclei of the cat. J Physiol (Lond) 461: 723-741. [DOI] [PMC free article] [PubMed] [Google Scholar]
- Sato N, Sakamori M, Haga K, Takehara S, Setoguchi M (1992) Antagonistic activity of Y-25130 on 5-HT3 receptors. Jpn J Pharmacol 59: 443-448. [DOI] [PubMed] [Google Scholar]
- Sherrington CS (1906) The integrative action of the nervous system, Chap 2-5. London: Yale UP.
- Singer JH, Berger AJ (1996) Presynaptic inhibition by serotonin: a possible mechanism for switching motor output of the hypoglossal nucleus. Sleep 19: S146-S149. [DOI] [PubMed] [Google Scholar]
- Singer JH, Bellingham MC, Berger AJ (1996) Presynaptic inhibition of glutamatergic synaptic transmission to rat motoneurons by serotonin. J Neurophysiol 76: 799-807. [DOI] [PubMed] [Google Scholar]
- Skoog B, Noga BR (1991) Do noradrenergic descending tract fibres contribute to the depression of transmission from group II muscle afferents following brainstem stimulation in the cat? Neurosci Lett 134: 5-8. [DOI] [PubMed] [Google Scholar]
- Stewart W, Maxwell DJ (2000) Morphological evidence for selective modulation by serotonin of a subpopulation of dorsal horn cells which possess the neurokinin-1 receptor. Eur J Neurosci 12: 4583-4588. [PubMed] [Google Scholar]
- Sun H, Machu TK (2000) Bicuculline antagonizes 5-HT(3A) and alpha2 glycine receptors expressed in Xenopus oocytes. Eur J Pharmacol 391: 243-249. [DOI] [PubMed] [Google Scholar]
- Todd AJ, Hughes DI, Polgar E, Nagy GG, Mackie M, Ottersen OP, Maxwell DJ (2003) The expression of vesicular glutamate transporters VGLUT1 and VGLUT2 in neurochemically defined axonal populations in the rat spinal cord with emphasis on the dorsal horn. Eur J Neurosci 17: 13-27. [DOI] [PubMed] [Google Scholar]
- Zeitz KP, Guy N, Malmberg AB, Dirajlal S, Martin WJ, Sun L, Bonhaus DW, Stucky CL, Julius D, Basbaum AI (2002) The 5-HT3 subtype of serotonin receptor contributes to nociceptive processing via a novel subset of myelinated and unmyelinated nociceptors. J Neurosci 22: 1010-1019. [DOI] [PMC free article] [PubMed] [Google Scholar]