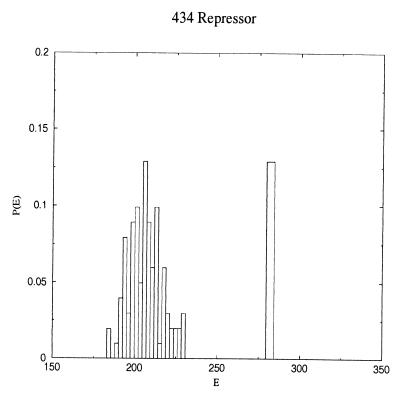
Figure 1.
Distribution of conformational energies for the 434 repressor. The figure shows the energies of the misfolded ensemble of states as well as that of the native state. The misfolded conformations were generated in a constant temperature molecular dynamics simulation at a reduced temperature of 1.2. Energies were evaluated by using the final interaction weights obtained from the self-consistent optimization procedure.

