Abstract
Misinterpretations of visual information received by the retina are called visual illusions, which are known to occur in higher brain areas. However, whether they would be also processed in lower brain structures remains unknown, and how to explain the neuronal mechanisms underlying the motion after-effect is intensely debated. We show by extracellular recording that all motion-sensitive neurons in the pigeon's pretectum respond similarly to real and illusory contours, and their preferred directions are identical for both contours in unidirectional cells, whereas these directions are changed by 90 deg for real versus illusory contours in bidirectional cells. On the other hand, some pretectal neurons produce inhibitory (excitatory) after-responses to cessation of prolonged motion in the preferred (null) directions, whose time course is similar to that of the motion after-effect reported by humans. Because excitatory and inhibitory receptive fields of a pretectal cell overlap in visual space and possess opposite directionalities, after-responses to cessation of prolonged motion in one direction may create illusory motion in the opposite direction. It appears that illusory contours and motion could be detected at the earliest stage of central information processing and processed in bottom-up streams, and that the motion after-effect may result from functional interactions of excitatory and inhibitory receptive fields with opposite directionalities.
Something we see does not always exist in the real world due to misinterpretations of light patterns striking at the retina. These visual illusions may act as a ‘window’ into neural mechanisms of visual information processing and therefore they have been extensively studied (Anstis et al. 1998; Eagleman, 2001; Nieder, 2002; Seghier & Vuilleumier, 2006). The shape defined by contours or edges and motion of an object are its two main physical attributes and thus the response properties of visual neurons to real and illusory contours and motion have attracted a great deal of attention (Eagleman, 2001; Nieder, 2002; Clifford & Ibbotson, 2003; Seghier & Vuilleumier, 2006). Physiological studies have found that cortical cells in mammals (Heydt et al. 1984; Grosof et al. 1993; Sheth et al. 1996; Ramsden et al. 2001) and forebrain cells in owls (Nieder & Wagner, 1999) can detect illusory contours. On the other hand, brain imaging has indicated that the motion after-effect (MAE) or waterfall illusion also occurs in cortical areas sensitive to visual motion (Tootell et al. 1995; He et al. 1998; Huk et al. 2001). It seems likely that illusory contours and motion may be exclusively detected in cortical neurons (Anstis et al. 1998). However, whether the visual illusions are also processed in lower brain areas remains unknown, and how to explain the neuronal mechanisms underlying MAE is intensely debated (Anstis et al. 1998; Eagleman, 2001; Nieder, 2002; Seghier & Vuilleumier, 2006).
To answer these questions, the nucleus lentiformis mesencephali (nLM) in the avian pretectum may be a good model that is homologous to the nucleus of the optic tract in mammals. Both of these nuclei are involved in generating optokinetic nystagmus (OKN) consisting of following and rapid eye movements to stabilize retinal images so that their neurons should detect anything in motion. It is known that pretectal cells detect the edges defined by luminance contrasts in gratings moving through their receptive fields (RF) (Fu et al. 1998b), implying that they may also respond to illusory edges or contours that lack luminance contrasts but can be inferred by ‘second-order’ cues such as texture. On the other hand, pretectal neurons are motion-sensitive and selective for the direction, speed and acceleration of visual motion (Gioanni et al. 1983; Frost et al. 1990; Fu et al. 1998a, b; Wylie & Crowder, 2000; Ibbotson & Price, 2001; Cao et al. 2004). They may also respond to cessation of prolonged motion as motion-sensitive neurons in cortical MT/V5 area shown by brain imaging (Tootell et al. 1995; He et al. 1998; Huk et al. 2001). Moreover, the excitatory RF (ERF) and inhibitory RF (IRF) of a pretectal cell overlap in the visual field but possess opposite directionalities (Fu et al. 1998a, b; Cao et al. 2004). This opponent RF organization would be suitable for revealing the neural mechanisms underlying MAE because after-responses to cessation of prolonged motion in one direction may create illusory motion in the opposite direction.
To investigate the response characteristics of pretectal cells to illusory contours and motion and the underlying neural mechanisms, the present study was undertaken by extracellular recording from the pigeon nLM and computer mapping of receptive fields. Finally, recording sites were histologically confirmed within nLM. In addition, changes in eye movements occurring after cessation of prolonged motion imply that the pigeon is able to perceive MAE.
Methods
Forty-five pigeons (Columba livia) were used following the guidelines for the care and use of animals established by the Society for Neuroscience. In physiological studies, each pigeon was anaesthetized with urethane (20%, 1 ml (100 g)−1) and then placed in a stereotaxic apparatus. The left caudal forebrain and rostral tectum were exposed, and the dura mater overlying nLM was excised. The right eye was held open and the left eye was covered. During single-unit recordings in the anaesthetized pigeons, the eye movements were intermittently monitored by the experimenter and no observable eye movements were found (Gu et al. 2002). A screen of 130 deg × 140 deg was placed tangential to and 40 cm away from the viewing eye. A pigeon normally holds its head with the bill angled down 34 deg relative to the horizontal axis of the visual field (Erichsen et al. 1989), whereas this angle is 72 deg when the pigeon is stereotaxically fixed; the horizontal axis was thus rotated by 38 deg (Britto et al. 1990; Fu et al. 1998a, b; Cao et al. 2004) to meet the normal conditions of the pigeon.
Three kinds of visual stimuli were generated by a computer (X900PI4; Asus) and back-projected on the screen with a projector (Sharp PG-M20X). (1) A black square (5–10 deg) was moved at 20–50 deg s−1 randomly along a series of parallel paths covering the whole screen to map the ERF and IRF of a visual cell (Fu et al. 1998a; Cao et al. 2004, 2006; Li et al. 2006). (2) A large-field grating pattern consisting of black and white stripes with equal-width and spatial frequencies of 0.1–0.3 cycles deg−1 was moved at 20–50 deg s−1 perpendicularly to stripe orientations in eight directions spaced by 45 deg with nasal 0 deg to measure the firing rate in each direction. The preferred and null directions of a pretectal cell were determined by Bspline interpolating to firing rates obtained in eight directions. This stimulus pattern was then moved in either of the directions at a series of speeds of 2–128 deg s−1 to measure the firing rate at each of speeds, and the optimal speed in the direction was obtained by Bspline interpolating to these firing rates. In experiments for examining MAE, the stimulus pattern was kept moving at the optimal speed for a series of durations (3–180 s) in the preferred and/or null directions and then stopped moving for up to 180 s to measure after-responses of the pretectal cell to cessation of stimulus motion. (3) A grey bar (1–3 deg wide, 90 deg long) on grating/black background or a black bar on white background was used as real contours. The luminance values of white, grey and black were 6.6, 2.7 and 0.1 cd m−2, respectively. A gap formed between two groups of gratings and phase-shifted abutting gratings were used as illusory contours with identical dimensions (Fig. 1). Spatial frequencies of gratings ranged from 0.1 to 0.3 cycles deg−1 and abutting gratings were phase-shifted by 45, 90 and 180 deg. They were moved at 20–50 deg s−1 perpendicularly to contour orientations to examine the visual responses. They were also presented in eight directions, as detailed above, to measure the directional tuning of pretectal cells. The stimulus first stayed on the screen for 5–20 s to collect spontaneous spikes as controls, and then moved with an interval of at least 5 s between trials to allow the cell to recover from any adaptation. The firing rates and preferred directions of pretectal cells were statistically analysed (Kruskal-Wallis tests) for real and illusory stimuli.
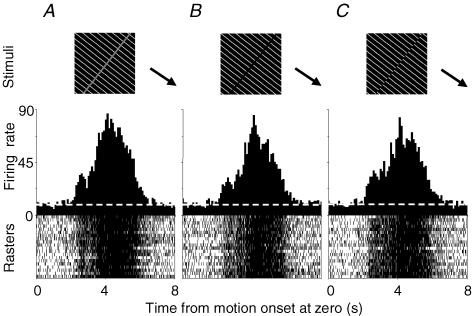
Figure 1. Histograms and rasters show visual responses of a pretectal neuron to real and illusory contours.
Grey bar (A) and grating gap (B) of 1.5 deg in width and 180 deg phase-shifted abutting gratings (C) were moved at the optimal speed (30 deg s−1) perpendicular to their orientations in the preferred temporonasal direction (arrows). The white stripe of gratings was 0.3 deg wide and spaced by 4.5 deg. Histograms were obtained by averaging 20 repeats and their rasters are shown below. Average firing rates in A, B and C were 45, 39 and 41 spikes s−1, respectively. Dashed lines represent the spontaneous level (9 spikes s−1). Time bin = 100 ms.
Visual cells were recorded from nLM according to its stereotaxic co-ordinates (Karten & Hodos, 1967) with a micropipette (∼2 μm tip diameter) filled with 2 m sodium acetate and 2% pontamine skyblue (Sigma). Neuronal spikes were amplified (WPI, DAM 70), displayed (Agilent 54622A) and fed into the computer for off-line analysis by averaging firing rates in 3–20 repeats. In some experiments, recording sites were marked with dye iontophoretically deposited by negative current pulses of 10–20 μA in intensity and 0.5 s in duration at 1 Hz for 10–15 min (Gu et al. 2001; Cao et al. 2004). Under deep anaesthesia, with an overdose of urethane (20%, 2 ml (100 g)−1), the brain was removed from the skull, fixed in 4% paraformaldehyde for 6–12 h, and soaked in 30% sucrose solution in a refrigerator overnight. Coronal sections were cut on a freezing microtome (Leica CM 1850) at 40 μm thickness and counterstained with cresyl violet. They were dehydrated and covered for subsequent microscopic observation.
To explore whether the pigeon could experience MAE, eye movements during and after prolonged motion were compared between pigeons and subjects who reported MAE. Each of four pigeons was anaesthetized with ketamine hydrochloride (5%, 0.25 ml (100 g)−1) and fixed in a stereotaxic apparatus, and then a steel rod was cemented onto the skull to replace the ear bars as a means to fix the pigeon's head. The pigeon was allowed to recover from anaesthesia in 8–12 h. Three metal needle electrodes were used, two of which were inserted into the anterior and posterior regions of the right orbital arch, and the third as reference in the occipital bone (Wohlschläger et al. 1993). Electrooculograms (EOG) characterizing horizontal eye movements were recorded during motion of large-field gratings (0.1–0.3 cycles deg−1) at 20–50 deg s−1 for 10–180 s and after motion for up to 180 s, and EOG signals were amplified (DC to 200 Hz), displayed, and stored in the computer for off-line analysis. Eye movements were also simultaneously videographed with an infrared video camera (DCR-HC40E; Sony). The ocular rotation was calculated, and its relation to EOG changes was described by an average sensitivity of 62 μV deg−1. Meanwhile, horizontal eye movements in four subjects aged 20–25 years with normal vision were analysed with EyeLink II system (SR Research, Canada). They watched a TV monitor (TCL MF969A, China) that was placed 40 cm away and subtended 40 × 50 deg. Their eye movements were recorded during motion of gratings (0.5–1.5 cycles deg−1) at 4–10 deg s−1 for 10–180 s and after motion for up to 180 s, so that eye movements in both species could be compared when they watched the gratings that were moved at identical spatial speed (2–15 cycles s−1). While eye movements were recorded, the subjects were asked to report MAE by pushing a button of the data collecting system connected to EyeLink II system at the onset and offset of MAE.
Results
Visual responses of 204 pretectal neurons to real and illusory contours and motion were examined, including 195 unidirectional cells (96%) that evoked maximal firing rate to motion in one (preferred) direction and minimal rate in the opposite (null) direction, and nine bidirectional cells (4%) characterized by maximal firing rates in two opposite preferred directions and minimal rates in the two directions orthogonal to both preferred directions. Because of many physiological parameters to be examined, these cells were divided into two groups for experimentation. The first group of 25 cells was examined for visual responses to real and illusory contours, and the second group of 179 cells was examined for after-responses to cessation of prolonged motion. Twenty-five recording sites marked with dye were all localized within the nucleus.
Visual responses of pretectal cells to illusory contours
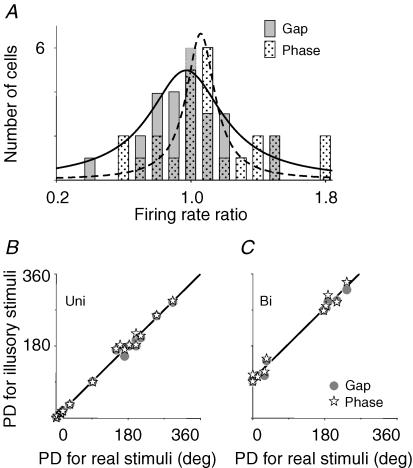
The first group of neurons contained 20 unidirectionals and 5 bidirectionals that were examined for responses to real and illusory contours. They all responded similarly to real bars, grating gaps and 180 deg phase-shifted abutting gratings when they were moved perpendicularly to contour orientations at the optimal speeds in the preferred directions. Figure 1 shows typical responses of a pretectal cell to these stimuli. Its average firing rates to the real bar, grating gap and abutting gratings were 45, 39 and 41 spikes s−1, respectively, and visual firing lasted ∼4.5 s. To compare responses to real bars with those to illusory contours, a response ratio was defined by R = (fi − fs)/(fr − fs) where fi, fr and fs represent firing rates evoked by illusory and real contours and spontaneous rate, respectively. Distribution of 20 unidirectionals and 5 bidirectionals was plotted against their response ratios in Fig. 2A. The firing rate of a bidirectional used for calculating the ratio was obtained by averaging firing rates in the two preferred directions. Lorentzian fitting to the distributional data shows that the ratio curve for grating gaps peaked at R = 0.97, with a correlation coefficient of 0.98, and that for 180 deg phase-shifted abutting gratings peaked at R = 1.1, with a coefficient of 0.91. Kruskal-Wallis tests indicate that firing rates of 20 unidirectionals and 5 bidirectionals to real bars were similar to those to grating gaps and phase-shifted gratings when these stimuli were moved at the optimal speeds in the preferred directions (n = 20 + 2 × 5, H2 = 1.664, P = 0.435). However, response strengths of these cells were affected by the contrast of real bars and phase-shifts of abutting gratings. For example, the firing rate evoked by a black bar on white background was 144% of that by a grey bar with identical dimensions (1.5 deg wide, 90 deg long) on grating/black background (n = 4), and firing rate for 180 deg phase-shifted gratings was 115% of that for 45 deg phase-shifted gratings (n = 4). The width of bars or gaps in a range of 1.5–3 deg did not affect visual responses.
Figure 2. Correlation analysis of pretectal responses to real and illusory contours.
A, the distribution of 25 cells was plotted against their firing rate ratios (see Results). The continuous and dashed curves fitted with Lorentzian functions for grating gaps and phase-shifted gratings peaked at R = 0.97 and 1.1, respectively. The preferred directions (PD) of 20 unidirectionals for illusory contours are linearly related to those for real ones, with the intercept of 1.3 deg and slope of 1.0 (B). A similar graph was plotted for five bidirectionals (n = 2 × 5) showing that PD is changed by ∼90 deg (C).
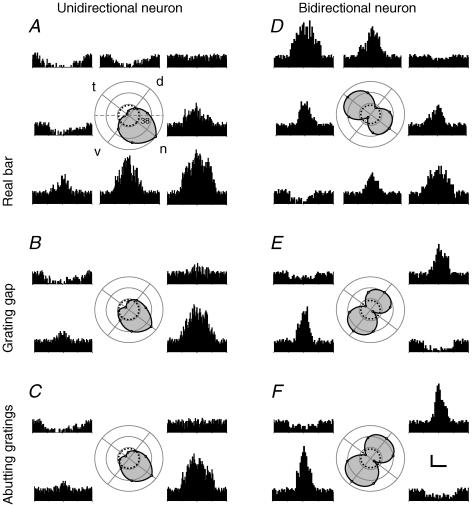
On the other hand, the preferred directions for real and illusory contours were identical in unidirectionals, whereas they were orthogonal for real versus illusory contours in bidirectionals. Examples in Fig. 3 show that a unidirectional cell preferred motion in the temporonasal direction for both real and illusory contours, whereas a bidirectional cell preferred horizontal motion of a real bar versus vertical motion of illusory contours. It appears that the preferred direction of the unidirectional cell was not changed, but the preferred directions of the bidirectional cell were rotated by ∼90 deg for real versus illusory contours. Durations of visual responses in various directions were different because ERF and IRF of both cells were elongated parallel to the horizontal axis of the visual field. The relationship between the preferred directions of 20 unidirectionals for illusory contours and those for real bars is described by a linear function y = y0 + ax where y0 and a are the intercept and slope of the line, respectively. These values (y0 = 1.3, a = 1.0) indicate that the preferred directions of these unidirectionals for real and illusory contours were identical (Fig. 2B). Kruskal-Wallis tests also show that the preferred directions of unidirectionals were not changed for real versus illusory contours (n = 20, H2 = 0.0375, P = 0.981). Though the preferred directions of five bidirectionals (n = 2 × 5) for illusory contours were also linearly related to those for real bars, these values (y0 = 96, a = 1.0) show that the preferred directions were rotated by ∼90 deg for real versus illusory stimuli (Fig. 2C). However, the optimal speeds determined by motion of real and illusory contours in the preferred direction were identical.
Figure 3. Directional tuning curves in two pretectal neurons for real and illusory contours.
Histograms were obtained from firing rates evoked by motion at 25 (A–C) and 20 (D–F) deg s−1 in eight directions spaced by 45 deg. For clarity, B, C, E and F depict histograms in four main directions only. Directional tuning curves (shaded) in polar coordinates were fitted with Bspline interpolations. The preferred directions were identical for real and illusory contours in unidirectionals (A–C), but changed by ∼90 deg in bidirectionals (D–F). The horizontal axis of the visual field was rotated by 38 deg to meet the pigeon's normal conditions (A). Letters d, n, t and v symbolize dorsal, nasal, temporal, and ventral, respectively. The dashed circles represent the spontaneous levels (18 spikes s deg s−1 in A–C, 17 spikes s−1 in D–F), and concentric circles are spaced by 20 spikes s−1. Four repeats were averaged. Scales: 20 spikes s−1, 2 s in A–C, and 1.25 s in D–F, time bin = 100 ms.
After-responses of pretectal cells to cessation of prolonged motion
The second group of neurons (175 unidirectionals, 4 bidirectionals) was examined for after-responses to cessation of stimulus motion. Among these, 132 unidirectionals and 4 bidirectionals were characterized by bell-shaped speed-tuning curves in the preferred and null directions, and 43 others were characterized by plateau-shaped speed-tuning curves in the preferred and/or null directions as defined by Cao et al. (2004). According to their responses to cessation of prolonged (up to 180 s) motion, pretectal cells with bell-shaped tuning curves were divided into two types. One type included 16 cells that produced either inhibitory or excitatory after-responses to cessation of prolonged motion and were designated MAE cells, and the other contained 116 unidirectionals and 4 bidirectionals that evoked no after-responses to cessation of motion and were named non-MAE cells and thus omitted from further analysis.
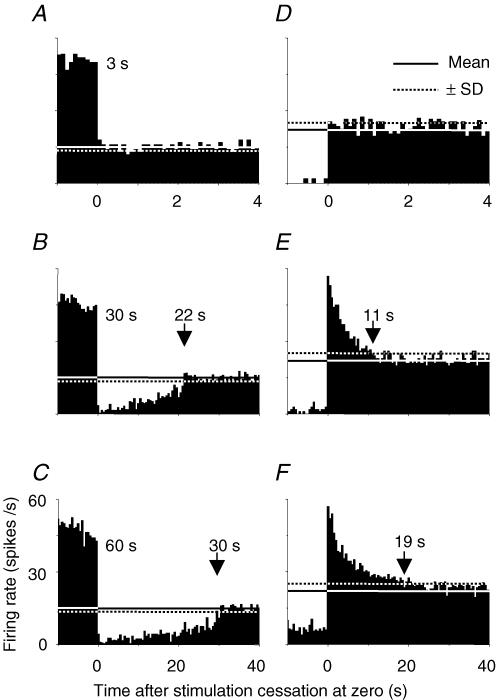
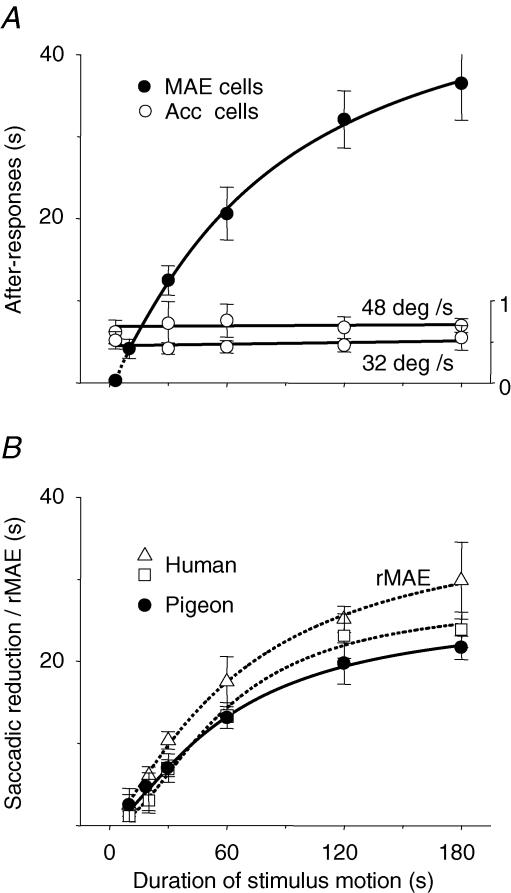
Histograms in Fig. 4 show example responses of two MAE cells to cessation of stimulus motion. The cell in Fig. 4A–C evoked excitatory responses in the preferred direction and inhibitory after-responses to cessation of prolonged motion, which lasted 22–30 s depending on duration of stimulus motion (30–60 s). On the other hand, the cell in Fig. 4D–F produced inhibitory responses in the null direction and excitatory after-responses to cessation of prolonged motion, which lasted 11–19 s when motion persisted for 30–60 s. However, neither of the cells responded to cessation of brief motion (e.g. 3 s). Statistical data of 16 MAE cells were plotted in Fig. 5A showing that duration of after-responses was monotonically increased as stimulus motion persisted longer. Seven of 43 cells with plateau-shaped tuning curves were examined and all responded to cessation of motion. Similar to MAE cells, they produced inhibitory (excitatory) after-responses to cessation of motion in the preferred (null) direction. However, the duration and strength of their after-responses depended on speed/deceleration values but not on duration of stimulus motion (Fig. 5A). These acceleration-sensitive cells were also omitted from further analysis.
Figure 4. Pretectal neurons evoked after-responses to cessation of prolonged motion.
Upon cessation of prolonged motion (30–60 s), the cell in A–C produced inhibitory after-responses in the preferred direction, whereas the cell in D–F produced excitatory after-responses in the null direction. However, cessation of brief motion (e.g. 3 s) did not evoke after-responses. Arrows point to the termination of after-responses determined by the intersection of histograms with the mean spontaneous rate (continuous lines) minus (A–C) or plus (D–F) s.d. (dotted lines). Five repeats were averaged. Time bin = 100 ms in A and D, 500 ms in others.
Figure 5. After-responses of pretectal cells and psychophysical responses in humans and pigeons depend on duration of stimulus motion.
Duration of after-responses in 16 motion after-effect (MAE) cells was increased as motion persisted longer, whereas that in eight acceleration-sensitive (Acc) cells was constant for a given speed value (e.g. 48 and 32 deg s−1 in A). Following cessation of motion, saccadic rates in four subjects and four pigeons were reduced for a short while, during which the subjects reported MAE (rMAE). This period was extended as motion lasted longer (B). The curves are fitted by logistic functions. A, the ordinate on the right is for Acc-cells. Error bars represent ±s.e.m.
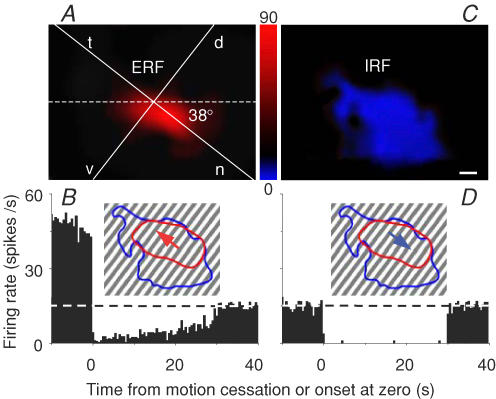
The RF extent was determined with computer mapping by the equal-rate line of 20% higher (ERF) or lower (IRF) than the average spontaneous rate with software Micrografx Picture Publisher (7a, Micrografx). Pretectal RF was composed of an ERF and IRF, both of which spatially overlapped in the visual field but possessed opposite directionalities. Inhibitory (excitatory) after-responses were evoked following cessation of prolonged motion in the preferred (null) direction, which just mirrored inhibitory (excitatory) responses to real stimulus motion in the null (preferred) direction (Fig. 6). In MAE cells, these after-responses to cessation of prolonged motion seemed to the pigeon that stationary stimulus appeared to move in the direction opposite to that of real motion.
Figure 6. Overlapping excitatory (ERF) and inhibitory (IRF) receptive fields and their opposite directionalities in a pretectal cell may underlie after-responses to cessation of motion.
After-responses of this cell to cessation of prolonged motion at 30 deg s−1 in the preferred direction (oblique-up arrow) through ERF (A and B) approximated inhibitory responses to real motion for 30 s in the null direction (oblique-down arrow) through IRF (C and D). ERF and IRF were computer-mapped and coded with a scale (spikes s−1) between A and C, and their outlines are sketched in B and D. The horizontal axis of the visual field was rotated as in Fig. 3. Five repeats were averaged, and time bin = 500 ms. Scale bar, 10 deg.
Eye movements after cessation of prolonged motion
To explore whether the pigeon would be able to see MAE, eye movements of both pigeons and humans were recorded under similar MAE-inducing conditions. Meanwhile, the subjects were asked to report their visual perceptions upon cessation of prolonged motion.
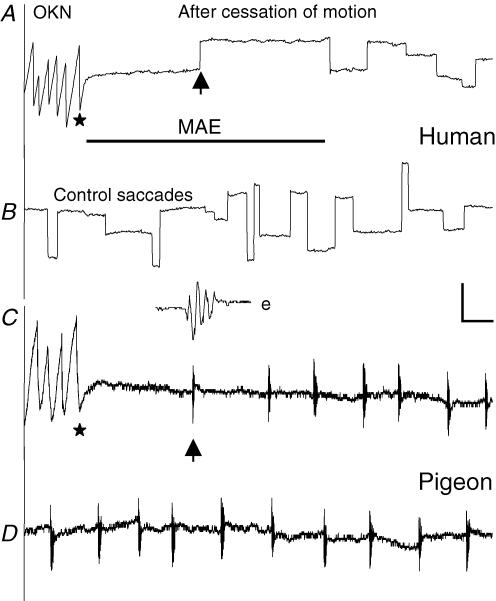
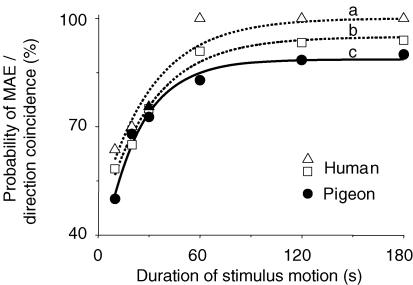
Similar large-field gratings were presented to four subjects and four pigeons, and their eyes made saccades spontaneously while they looked at stationary gratings without any fixation demand. When the gratings were moved horizontally, OKN composed of following and saccadic eye movements was induced. Eye movements following cessation of prolonged motion in both species were similar in two aspects (Fig. 7). First, the eyes stayed for a short while and then a saccade was initiated with its horizontal component probably pointing to the direction of stimulus motion. Directional coincidence probability (cp) of the initial saccade with stimulus motion was defined by cp = mt/nt where mt and nt were m coincidences out of n trials following horizontal stimulus motion lasting t seconds. For example, cp = 68, 83 and 90% for four pigeons, and 65, 91 and 94% for four subjects when t = 20, 60 and 180 s, respectively. Meanwhile, occurrence probability of MAE reported by the subjects was 70% when t = 20 s and 100% when t > 60 s. If 75% was considered to be a chance level, threshold duration of motion for reporting MAE was 24 s, and that for directional coincidences was 29 s for humans and 32 s for pigeons (Fig. 8). Second, saccadic rate was reduced and then gradually recovered after cessation of prolonged motion. Facing stationary gratings, average rate was 1.24 ± 0.56 saccades s−1 for humans and 0.33 ± 0.14 saccades s−1 for pigeons (n = 5 × 4). After cessation of motion, duration of saccadic reduction was determined from the moment when rate was lower than mean rate minus s.d. to the moment when rate was higher than mean rate plus s.d. As shown in Fig. 5B, duration of saccadic reduction lasted 1–24 s in subjects after cessation of motion lasting 10–180 s. Meanwhile, they also reported MAE, though MAE was slightly longer than saccadic reduction in duration. Under similar conditions, duration of saccadic reduction in pigeons lasted 3–22 s.
Figure 7. Comparisons of horizontal eye movements recorded in a subject and pigeon.
Optokinetic nystagmus (OKN) was evoked by motion of large-field gratings. Upon cessation (stars) of prolonged motion (60 s) at a spatial speed of 4 cycles s−1 for both species, saccadic rates were reduced and the initial saccade (upward arrows) after cessation of motion was shifted to the direction of stimulus motion (A and C). Meanwhile, the subject reported the onset and end of MAE (bar). The subject and pigeon made saccades while they confronted stationary gratings (B and D). The inset e shows the temporally expanded saccade arrowed in C. Scale bars: 2 s, 3 deg.
Figure 8. Probability of psychophysical responses related to MAE depends on duration of stimulus motion.
The curve labelled a shows that MAE was more likely to be observed when stimulus motion persisted longer. The initial saccade upon cessation of stimulus motion in humans (b) and pigeons (c) was more probably directed to the direction of stimulus motion, and this directional coincidence probability was increased as persistence of motion increased. If probability 75% is taken as the chance level, its intersections with the curves fitted by simple exponent functions are defined as threshold durations of motion, and thresholds for a, b and c are 24, 29 and 32 s, respectively.
Recording sites
The avian nLM is divided into magnocellular (nLMm) and parvocellular (nLMp) (Tang & Wang, 2002) or medial and lateral divisions (Gamlin & Cohen, 1988). The recording sites of 10 illusory contour-detecting cells, 11 MAE cells and 4 acceleration-sensitive cells were marked, demonstrating that 21 cells responding to illusory stimuli were in the dorsal (5), middle (8) and ventral (6) nLMm, and 2 others in the ventral nLMp; 4 acceleration-sensitive cells were located in the middle and ventral nLM. It appears that pretectal cells responding to illusory stimuli were mainly localized within nLMm.
Discussion
Extensive studies have shown that illusory contours and motion after-effect are processed in visual cortex in humans and other mammals (Heydt et al. 1984; Grosof et al. 1993; Tootell et al. 1995; Sheth et al. 1996; He et al. 1998; Ramsden et al. 2001; Seghier & Vuilleumier, 2006) and in the visual forebrain in birds (Nieder & Wagner, 1999), which may be homologous to the primary visual cortex (Karten et al. 1973). The present study found for the first time that visual neurons in the pigeon nLM, a retinorecipient structure in the pretectum, respond to illusory contours and cessation of prolonged motion (motion aftereffect), indicating that visual illusions in birds occur at the earliest stage of central information processing and implying that visual forebrain in birds or cortex in mammals may not be a prerequisite for processing visual illusions.
It is known that pretectal cells respond to real edges or contours defined by luminance contrasts in gratings moving through their receptive fields (Fu et al. 1998b). This study shows that these cells also respond to illusory contours that lack luminance contrasts but can be inferred by ‘second-order’ cues such as texture. When real and illusory contours with comparable parameters are moved at the optimal speeds in the preferred directions, they would evoke similar firing rates in pretectal cells examined. However, the preferred directions for real and illusory contours are identical in unidirectionals, whereas those are orthogonal for real versus illusory contours in bidirectionals. This preferred direction change in pretectal cells is reminiscent of the preferred orientation change in monkey's cortical cells responding to real versus illusory contours (Ramsden et al. 2001). It seems that pretectal bidirectionals can discriminate real from illusory contours but unidirectionals cannot. These neurons may combine outputs of two detection mechanisms, one of which detects real contours and the other illusory contours (Ohzawa, 1999), and both mechanisms are characterized by identical directionalities in unidirectionals and orthogonal directionalities in bidirectionals. Detection of illusory contours may help in discriminating borders of camouflaged objects or filling in gaps in physically incomplete stimuli (see Nieder, 2002).
We provided several lines of evidence that after-responses of pretectal cells to cessation of prolonged motion may underlie the motion after-effect. First, similar to the waterfall illusion we experience, there is a threshold duration of visual motion for eliciting such after-responses. Duration of after-responses is monotonically increased as motion persists longer. Second, the time course of pretectal after-responses is similar to that of MAE observed by humans and to that of saccadic reduction caused by cessation of prolonged motion in humans and pigeons. Third, the opponent receptive field organization of pretectal cells is suitable for producing MAE. For example, inhibitory responses to cessation of prolonged motion in the preferred direction would produce illusory motion in the null direction. However, the decline in firing rates in some motion-sensitive cells in response to cessation of visual motion (Barlow & Hill, 1963; Hammond et al. 1988; Clifford & Ibbotson, 2003) alone is not sufficient to satisfactorily explain the neuronal mechanisms underlying MAE because this decline may be due to responses to visual deceleration (Cao et al. 2004) or transients at the offset of motion. Furthermore, after-responses of pretectal cells to cessation of prolonged motion are unlikely to result from neural fatigue because most cells do not produce after-responses to cessation of prolonged motion and after-responses are not only inhibitory in the preferred direction but also excitatory in the null direction. Moreover, after-responses of acceleration-sensitive cells depend on speed/acceleration values but not on duration of stimulus motion. It appears that MAE is produced through such functional interactions between ERF and IRF of MAE cells that after-responses in one direction would create illusory motion in the opposite direction because ERF and IRF are opposite in directionality. These lend a considerable support to the notion that MAE is not due to passive neural fatigue but stems from active processes, which may be useful for error correction or/and coding optimization in visual information processing (see Anstis et al. 1998).
Similarities between responses to real and illusory contours suggest that pretectal responses to illusory stimuli may derive from those to real stimuli. The latter responses are related to inputs from retinal ganglion cells (Gamlin & Cohen, 1988), some of which are sensitive for the direction of motion and stimulus edges (Holden, 1977a, b), and to afferents from the nucleus of the basal optic root (nBOR), which is sensitive for the direction and speed of motion (Baldo & Britto, 1990; Zhang et al. 1999; Gu et al. 2001) and also for stimulus edges (Wang et al. 2000). Pretectal cells also receive inputs from telencephalic neurons (Crowder et al. 2004) which may be able to detect illusory contours (Nieder & Wagner, 1999). However, telencephalic afferents do not contribute to the directional or spatiotemporal tuning of pretectal cells (Crowder et al. 2004), and thus telencephalic cells seem not to contribute much, if any, to pretectal responses to illusory stimuli. Taken together, it is probable that information from the retina, nBOR and possibly other structures is integrated and processed within nLM, resulting in pretectal responses to illusory stimuli at the earliest stage of central information processing. On the other hand, this pretectal nucleus also sends information to the telencephalon through the visual thalamus (Wild, 1989; Güntürkün & Karten, 1991), suggesting that telencephalic responses to illusory contours (Nieder & Wagner, 1999) may stem at least in part from nLM, and thus visual illusions may be processed in bottom-up streams. The mammalian homologue of this nucleus is the nucleus of the optic tract in the pretectum; both nuclei are involved in generating OKN so that their cells should detect anything in motion including real and illusory stimuli. It would be interesting to study whether optokinetic neurons in mammals could detect illusory contours and motion.
Acknowledgments
We thank Professor Onur Güntürkün at Ruhr-University Bochum for critically reading the manuscript. This work was supported by the National Natural Science Foundation of China and by the Chinese Academy of Sciences.
References
- Anstis S, Verstraten FAJ, Mather G. The motion aftereffect. Trends Cogn Sci. 1998;2:111–117. doi: 10.1016/s1364-6613(98)01142-5. [DOI] [PubMed] [Google Scholar]
- Baldo MV, Britto LR. Accessory optic–pretectal interactions in the pigeon. Braz J Med Biol Res. 1990;23:1037–1040. [PubMed] [Google Scholar]
- Barlow HB, Hill RM. Evidence for a physiological explanation of the waterfall phenomenon and figural aftereffects. Nature. 1963;200:1434–1435. doi: 10.1038/2001345a0. [DOI] [PubMed] [Google Scholar]
- Britto LR, Gasparotto OC, Hamassaki DE. Visual telencephalon modulates directional selectivity of accessory optic neurons in pigeons. Vis Neurosci. 1990;4:3–10. doi: 10.1017/s0952523800002728. [DOI] [PubMed] [Google Scholar]
- Cao P, Gu Y, Wang SR. Visual neurons in the pigeon brain encode the acceleration of stimulus motion. J Neurosci. 2004;24:7690–7698. doi: 10.1523/JNEUROSCI.2384-04.2004. [DOI] [PMC free article] [PubMed] [Google Scholar]
- Cao P, Yang Y, Yang Y, Wang SR. Differential modulation of thalamic neurons by optokinetic nuclei in the pigeon. Brain Res. 2006;1069:159–165. doi: 10.1016/j.brainres.2005.11.063. [DOI] [PubMed] [Google Scholar]
- Clifford CW, Ibbotson MR. Fundamental mechanisms of visual motion detection: models, cells and functions. Prog Neurobiol. 2003;68:409–437. [Google Scholar]
- Crowder NA, Dickson CT, Wylie DR. Telencephalic input to the pretectum of pigeons: an electrophysiological and pharmacological inactivation study. J Neurophysiol. 2004;91:274–285. doi: 10.1152/jn.00763.2003. [DOI] [PubMed] [Google Scholar]
- Eagleman DM. Visual illusions and neurobiology. Nat Rev Neurosci. 2001;2:920–926. doi: 10.1038/35104092. [DOI] [PubMed] [Google Scholar]
- Erichsen JT, Hodos W, Evinger C, Bessette BB, Phillips SJ. Head orientation in pigeon: postral, locomotor and visual determinants. Brain Behav Evol. 1989;33:268–278. doi: 10.1159/000115935. [DOI] [PubMed] [Google Scholar]
- Frost BJ, Wylie DR, Wang YC. The processing of object and self-motion in the tectofugal and accessory optic pathways of birds. Vision Res. 1990;30:1677–1688. doi: 10.1016/0042-6989(90)90152-b. [DOI] [PubMed] [Google Scholar]
- Fu YX, Gao HF, Guo MW, Wang SR. Receptive field properties of visual neurons in the avian nucleus lentiformis mesencephali. Exp Brain Res. 1998a;118:279–285. doi: 10.1007/s002210050282. [DOI] [PubMed] [Google Scholar]
- Fu YX, Xiao Q, Gao HF, Wang SR. Stimulus features eliciting visual responses from neurons in the nucleus lentiformis mesencephali in pigeons. Vis Neurosci. 1998b;15:1079–1087. doi: 10.1017/s0952523898156055. [DOI] [PubMed] [Google Scholar]
- Gamlin PD, Cohen DH. Retinal projections to the pretectum in the pigeon (Columba livia) J Comp Neurol. 1988;269:1–17. doi: 10.1002/cne.902690102. [DOI] [PubMed] [Google Scholar]
- Gioanni H, Rey J, Villalobos J, Richard D, Dalbera A. Optokinetic nystagmus in the pigeon (Columba livia). II. Role of the pretectal nucleus of the accessory optic system (AOS) Exp Brain Res. 1983;50:237–247. doi: 10.1007/BF00239188. [DOI] [PubMed] [Google Scholar]
- Grosof DH, Shapley RM, Hawken MJ. Macaque V1 neurons can signal ‘illusory’ contours. Nature. 1993;365:550–552. doi: 10.1038/365550a0. [DOI] [PubMed] [Google Scholar]
- Gu Y, Wang Y, Wang SR. Directional modulation of visual responses of pretectal neurons by accessory optic neurons in pigeons. Neuroscience. 2001;104:153–159. doi: 10.1016/s0306-4522(01)00056-2. [DOI] [PubMed] [Google Scholar]
- Gu Y, Wang Y, Wang SR. Visual responses of neurons in the nucleus of the basal optic root to stationary stimuli in pigeons. J Neurosci Res. 2002;67:698–704. doi: 10.1002/jnr.10154. [DOI] [PubMed] [Google Scholar]
- Güntürkün O, Karten HJ. An immunocytochemical analysis of the lateral geniculate complex in the pigeon (Columba livia) J Comp Neurol. 1991;314:721–749. doi: 10.1002/cne.903140407. [DOI] [PubMed] [Google Scholar]
- Hammond P, Mouat GSV, Smith AT. Neural correlates of motion aftereffects in cat striate cortical neurons: monocular adaptation. Exp Brain Res. 1988;72:1–20. doi: 10.1007/BF00248495. [DOI] [PubMed] [Google Scholar]
- He S, Cohen ER, Hu X. Close correlation between activity in brain area MT/V5 and the perception of a visual motion aftereffect. Curr Biol. 1998;8:1215–1218. doi: 10.1016/s0960-9822(07)00512-x. [DOI] [PubMed] [Google Scholar]
- Heydt R, Peterhans E, Baumgartner G. Illusory contours and cortical neuron responses. Science. 1984;224:1260–1262. doi: 10.1126/science.6539501. [DOI] [PubMed] [Google Scholar]
- Holden AL. Responses of directional ganglion cells in the pigeon retina. J Physiol. 1977a;270:253–269. doi: 10.1113/jphysiol.1977.sp011950. [DOI] [PMC free article] [PubMed] [Google Scholar]
- Holden AL. Ganglion cell discharge and proximal negativity in the pigeon retina. J Physiol. 1977b;270:239–251. doi: 10.1113/jphysiol.1977.sp011949. [DOI] [PMC free article] [PubMed] [Google Scholar]
- Huk AC, Ress D, Heeger DJ. Neuronal basis of the motion aftereffect reconsidered. Neuron. 2001;32:161–172. doi: 10.1016/s0896-6273(01)00452-4. [DOI] [PubMed] [Google Scholar]
- Ibbotson MR, Price NS. Spatiotemporal tuning of directional neurons in mammalian and avian pretectum: a comparison of physiological properties. J Neurophysiol. 2001;86:2621–2624. doi: 10.1152/jn.2001.86.5.2621. [DOI] [PubMed] [Google Scholar]
- Karten HJ, Hodos W. A Stereotaxic Atlas of the Brain of the Pigeon (Columba Livia) Baltimore: Johns Hopkins Press; 1967. [Google Scholar]
- Karten HJ, Hodos W, Nauta WJ, Revzin AM. Neural connections of the ‘visual wulst’ of the avian telencephalon. Experimental studies in the pigeon (Columba livia) and owl (Speotyto cunicularia) J Comp Neurol. 1973;150:253–278. doi: 10.1002/cne.901500303. [DOI] [PubMed] [Google Scholar]
- Li DP, Xiao Q, Wang SR. Feedforward construction of the receptive field and orientation selectivity of visual neurons in the pigeon. Cereb Cortex. 2006 doi: 10.1093/cercor/bhk043. DOI: 10.1093/cercor/bhk043. [DOI] [PubMed] [Google Scholar]
- Nieder A. Seeing more than meets the eye: processing of illusory contours in animals. J Comp Physiol A. 2002;188:249–260. doi: 10.1007/s00359-002-0306-x. [DOI] [PubMed] [Google Scholar]
- Nieder A, Wagner H. Perception and neuronal coding of subjective contours in the owl. Nat Neurosci. 1999;2:660–663. doi: 10.1038/10217. [DOI] [PubMed] [Google Scholar]
- Ohzawa I. Do animals see what we see? Nat Neurosci. 1999;2:586–588. doi: 10.1038/10135. [DOI] [PubMed] [Google Scholar]
- Ramsden BM, Hung CP, Roe AW. Real and illusory contour processing in area V1 of the primates: a cortical balancing act. Cereb Cortex. 2001;11:648–665. doi: 10.1093/cercor/11.7.648. [DOI] [PubMed] [Google Scholar]
- Seghier ML, Vuilleumier P. Functional neuroimaging findings on the human perception of illusory contours. Neurosci Biobehav Rev. 2006;30:595–612. doi: 10.1016/j.neubiorev.2005.11.002. [DOI] [PubMed] [Google Scholar]
- Sheth BR, Sharma J, Rao SC, Sur M. Orientation maps of subjective contours in visual cortex. Science. 1996;274:2110–2115. doi: 10.1126/science.274.5295.2110. [DOI] [PubMed] [Google Scholar]
- Tang ZX, Wang SR. Intracellular recording and staining of neurons in the pigeon nucleus lentiformis mesencephali. Brain Behav Evol. 2002;60:52–58. doi: 10.1159/000064118. [DOI] [PubMed] [Google Scholar]
- Tootell RB, Reppas JB, Dale AM, Look RB, Sereno MI, Malach R, Brady TJ, Rosen BR. Visual motion aftereffect in human cortical area MT revealed by functional magnetic resonance imaging. Nature. 1995;375:139–141. doi: 10.1038/375139a0. [DOI] [PubMed] [Google Scholar]
- Wang Y, Gu Y, Wang SR. Feature detection of visual neurons in the nucleus of the basal optic root in pigeons. Brain Res Bull. 2000;51:165–169. doi: 10.1016/s0361-9230(99)00220-8. [DOI] [PubMed] [Google Scholar]
- Wild JM. Pretectal and tectal projections to the homologue of the dorsal lateral geniculate nucleus in the pigeon: an anterograde and retrograde tracing study with cholera toxin conjugated to horseradish peroxidase. Brain Res. 1989;479:130–137. doi: 10.1016/0006-8993(89)91342-5. [DOI] [PubMed] [Google Scholar]
- Wohlschläger A, Jäger R, Delius JD. Head and eye movements in unrestrained pigeons (Columba livia) J Comp Psychol. 1993;107:313–319. [Google Scholar]
- Wylie DR, Crowder NA. Spatiotemporal properties of fast and slow neurons in the pretectal nucleus lentiformis mesencephali in pigeons. J Neurophysiol. 2000;84:2529–2540. doi: 10.1152/jn.2000.84.5.2529. [DOI] [PubMed] [Google Scholar]
- Zhang T, Fu YX, Hu J, Wang SR. Receptive field characteristics of neurons in the nucleus of the basal optic root in pigeons. Neuroscience. 1999;91:33–40. doi: 10.1016/s0306-4522(98)00620-4. [DOI] [PubMed] [Google Scholar]


