Abstract
Fluorescence videomicroscopy and scanning force microscopy were used to follow, in real time, chromatin assembly on individual DNA molecules immersed in cell-free systems competent for physiological chromatin assembly. Within a few seconds, molecules are already compacted into a form exhibiting strong similarities to native chromatin fibers. In these extracts, the compaction rate is more than 100 times faster than expected from standard biochemical assays. Our data provide definite information on the forces involved (a few piconewtons) and on the reaction path. DNA compaction as a function of time revealed unique features of the assembly reaction in these extracts. They imply a sequential process with at least three steps, involving DNA wrapping as the final event. An absolute and quantitative measure of the kinetic parameters of the early steps in chromatin assembly under physiological conditions could thus be obtained.
Eukaryotic DNA is folded into chromatin, a complex structure in which DNA is wrapped around histone octamers (1) to form nucleosomes, which are further organized into higher-order structures (2–4). All DNA transactions in the cell operate in this context, implying dynamics of disassembly and reassembly of this organization (5, 6). It is now clear that chromatin dynamics play key roles in genome function. Understanding the establishment, maintenance, and control of this organization is thus of major interest. Our current understanding of nucleosome assembly (4, 7) is built upon a combination of reconstitution studies using purified nucleosomal components (DNA and histones), in vitro cell-free systems derived from Xenopus eggs, Drosophila embryos, or cultured cells competent to support assembly reactions at physiological ionic strength, and in vivo approaches. In vitro cell-free systems proficient for chromatin assembly (7) have proven most powerful in investigating many DNA-associated processes, including transcription, replication, and repair, in a physiological chromatin environment (4). The techniques routinely used to monitor the progression or extent of nucleosome assembly (8–10) include (i) the torsional stress produced on circular DNA molecules resulting from their wrapping around histone octamers (supercoiling analysis) and (ii) the size of DNA fragments generated after enzymatic digestion or chemical cleavage, typical of nucleosome protection. These techniques can probe nucleosome formation on a relatively long time scale (from minutes to hours, typically). A better time resolution was provided by physical methods applied to the reconstitution of mononucleosome core particles under nonphysiological conditions and very different rates, ranging from about 10 s to hours, were reported (11, 12).
The various above-mentioned experiments analyzed the average behavior of a large population of molecules. In any case, the early events associated with chromatin assembly in physiological conditions are still essentially unknown. This lack of information prompted us to use alternative techniques. The recent development of real-time fluorescence microscopy applied to single DNA molecules, which has considerably advanced our understanding of DNA dynamics and elasticity and unveiled a richness of individual molecular behaviors (13, 14), represented an attractive possibility. We thus combined this technology with the use of in vitro systems competent for chromatin assembly, to develop a powerful method for studying the earliest events driving DNA folding into nucleosomal structures.
Materials and Methods
DNA Preparation.
λ-phage DNA (Pharmacia, 48.5 kbp) was modified at one end by annealing and ligating a 22-mer biotinylated oligonucleotide (Genset) complementary to the arm of the λ DNA. DNA was fluorescently labeled with YOYO-1 (Molecular Probes; 1 molecule every 10 bp) and then grafted onto streptavidin-coated coverslips at a density of 10 molecules per 100 μm (15).
Extract Preparation.
Xenopus egg extracts (16–18) and Drosophila embryo extracts (19–21) were prepared as described. The competence of these extracts in assembling chromatin was systematically verified before their use, by standard supercoiling assays and micrococcal nuclease digestion (8–10). The histone concentration in the extract is estimated to be 80–100 ng/μl (16, 17). Titration of the Xenopus extract capability to assemble chromatin was performed by incubating it with 0.2 μg/μl genomic DNA (17). Assembly capability was restored by adding back the four core histones (Boehringer) prebound to poly(glutamic acid) (22), to a final concentration of 0.2 μg/μl. Depleted and complemented extracts were also tested in a supercoiling assay before use. Extraction buffer (20 mM Hepes, pH 7.5/70 mM potassium acetate/1 mM DTT/5% sucrose) supplemented with 5 mM MgCl2 was used to dilute the extracts (1:1 to 1:1000). All solutions were degassed with argon, and oxygen scavengers were added (23). Neither the presence of oxygen scavengers nor labeling with YOYO-1 at a ratio of 1:10 significantly affected the assembly reaction, as assessed by micrococcal nuclease digestion. This latter result is consistent with previous experiments using ethidium bromide (24), showing that intercalators induce negligible dissociation of nucleosomes (less than 5%) up to a ratio of order 0.1–0.15 dye molecule per base pair). Therefore, the labeling of DNA with YOYO-1 does not seem to qualitatively affect nucleosome formation. It is not totally possible at this stage, however, to rule out a minor modification of the kinetics, due to the presence of the dye (also see Kinetic Model below). Purified H2A–H2B dimers (25) were used to vary the histone ratio in the extracts.
Videomicroscopy Experiments and Data Analysis.
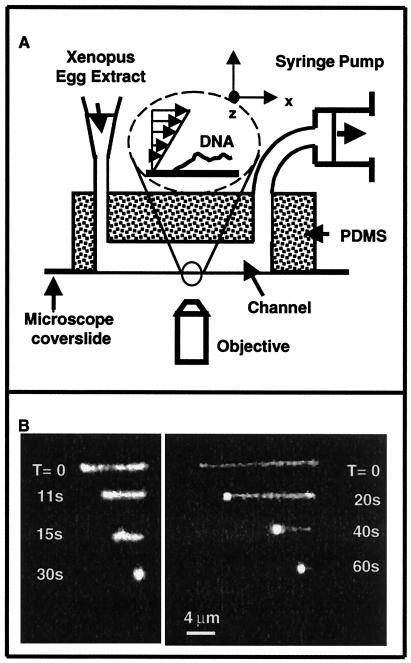
Our experimental system is presented in Fig. 1A. A poly(dimethylsiloxane) (PDMS) flow channel (500 μm width, 135 μm depth), prepared by micromolding, was mounted on top of a coverslip and placed in an inverted microscope (Zeiss) with laser excitation, equipped with an oil objective (×100, numerical aperture 1.4). The temperature was maintained at 24 ± 3°C. Extracts were circulated by using a syringe pump (KD Scientific, Bioblock, Illkirch, France) at flow rates suitable for ensuring constant renewal of the extract without affecting molecular collision rates. Images were collected using an intensified charge-coupled device camera (LHESA, les Ulis, France) with home-made nitrogen cooling and digitized in real time. DNA length (data points in Fig. 2) was measured from the digitized images by using an automated algorithm written in nih image (26). Different extracts yielded compaction profiles identical within experimental error. The uncertainty on time 0 was 2, 1, and 0.2 s for 26.25, 175, and 1,050 s−1, respectively (evaluated by using flow tracers).
Figure 1.
Videomicroscopy experiments. (A) Experimental setup. (B) Examples of compaction of individual DNA molecules with time in the presence of 1:50 diluted extracts at shear rates of 26.25 s−1 (Left) and 1,050 s−1 (Right).
Figure 2.
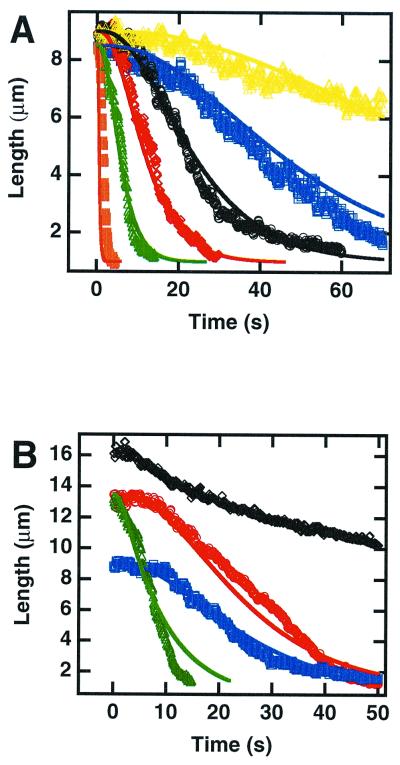
Length versus elapsed time. (A) For different extract dilutions at a shear rate 26.25 s−1: 1:2.5 (orange ■); 1:25 (green ▵); 1:50 (red ⋄); 1:100 (black ○); 1:200 (blue □); and 1:400 (yellow ▵). (B) In 1:100-diluted extracts at shear rates 26.25 s−1 (blue □); 175 s−1 (red ○), and 1050 s−1 (black ⋄), and at 175 s−1 in 10-fold H2A/H2B-enriched extracts (green ▵). Points represent experimental data, and lines were fitted by using the three-step model (Eq. 1). Different extracts yielded compaction profiles identical within experimental error.
Scanning Force Microscopy (SFM) Experiments.
SFM was performed at 50% relative humidity in tapping mode on a Nanoscope III (Digital Instruments). A drop of solution was diluted in a large amount of buffer, immediately deposited on mica, incubated 20 s to initiate adsorption of complexes, and spread with argon to favor extended conformations.
Results and Discussion
Real-Time Observation of λ-Phage DNA Compaction in Xenopus Cell Extracts.
Fluorescently labeled λ-phage DNA was attached by one end to the wall of a microchannel and extended by Poiseuille flow. Xenopus egg extracts (16–18) competent for chromatin assembly were then introduced into the flow channel at various dilutions. Examples of DNA behavior after immersion in 1:50-diluted extract are shown in Fig. 1B: the length of the DNA molecule decreased regularly and very quickly (order of 20 s for maximal compaction). This DNA retraction proceeded down to a quasispherical “ball” of diameter ≤1.5 μm, located at the DNA attachment point. The ball then displayed a residual Brownian motion, indicating that it was not adsorbed on the surface. Recovery of the intact initial extended DNA could be obtained by circulating a 0.1% SDS solution in the chamber. Taking into account the initial length of the naked DNA molecule, the compaction factor is greater than 7 at a flow rate 26.25 s−1, and greater than 17 at 1,050 s−1 (only a lower bound to the actual compaction factor can be obtained from videomicroscopy, because of the resolution of our device (in the order of 1 μm)). This range of compaction is compatible with the 30-nm fiber in chromatin (2, 3). A qualitatively similar retraction was observed in Drosophila embryo extracts competent for chromatin assembly (19). In contrast, no retraction of the DNA was detected even after 2.5 min in a nuclear extract of equivalent total protein concentration, rich in DNA-binding proteins but yet unable to support chromatin assembly (20, 21). Importantly, when a solution of purified histones was used (at a final histone concentration comparable to the 1:2-diluted extract), a slower (typically 30–60 s), irregular, and discontinuous retraction occurred, followed by an irreversible adsorption [probably because of formation of aggregates (22)]. Thus, smooth DNA compaction is specifically observed in extracts competent for assembly and cannot be attributed to general protein–DNA interactions or DNA aggregation.
We then established that histones are key components in the observed DNA retraction: when histones and chromatin assembly capacity were titrated out from the extracts by an incubation with naked genomic DNA before injection into the chamber, no retraction occurred. Remarkably, DNA retraction was recovered from these depleted extracts, simply supplemented with purified histones prebound to poly(glutamic acid) [preventing histone aggregation (22)].
The retraction of DNA as a function of time is displayed in Fig. 2, where the shear rate was kept constant at 26.25 s−1 and extract concentration was varied (Fig. 2A), or shear rates were varied at a constant extract dilution (1:100) (Fig. 2B). Although data from 10 to 30 molecules were averaged in each case to improve signal-to-noise ratio, the behavior of all molecules in the same flow-rate and dilution conditions were found to be identical within experimental error. Compaction dynamics were essentially independent of shear rate up to 175 s−1 (apart from a different initial length value due to flow-induced stretching) but were significantly slowed at 1,050 s−1 (Fig. 2B, black). At this flow rate, retraction clearly initiated at the free end of the DNA and progressed to the anchoring point, whereas at low flow rates it appeared distributed (Fig. 1B Left). Independent experiments and simulations (26) revealed that the maximum tension on the DNA (at the attachment point) was on the order of 0.3, 2, and 12 pN for shear rates of 26.25, 175, and 1,050 s−1, respectively. Forces in the piconewton range are thus necessary to significantly affect the processes involved in these reactions. Interestingly, Cui and Bustamante (28) reported that the unfolding of a single native chromatin fiber, at comparable ionic strengths, displays a plateau attributed to the rupture of internucleosomal interactions at forces of approximately 6 pN and a hysteresis attributed to the release of nucleosome cores around 20 pN. Thus, the forces involved in our early compaction reaction are of the same order as those required to destabilize the structure of native chromatin.
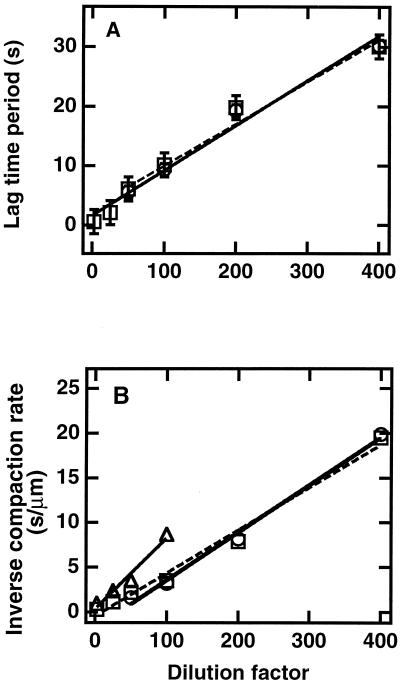
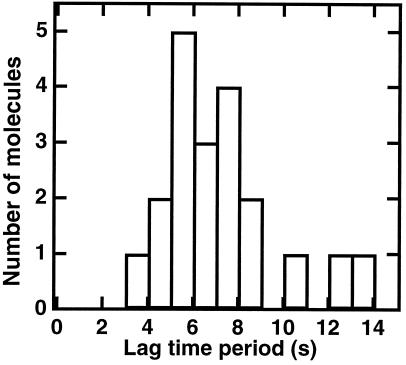
The decrease in DNA length as a function of time was then studied in detail at low flow rates. The graph shown in Fig. 2 was sigmoidal and different from the linear progressive compaction observed for protamine-induced condensation (29) or from Michaelis–Menten kinetics (30). The lag time and the compaction time (defined as the inverse of the maximal compaction rate) increased approximately linearly with extract dilution (Fig. 3), and retraction could still be detected when a 1:1000 dilution was used (although in this case it was often interrupted by photoscission of the DNA). This linear dependence upon dilution suggests that no threshold effect exists for dilutions down to at least 1:400. Importantly, the sigmoidal shape was also revealed in the (nonaveraged) length evolution of individual molecules, and the histogram of lag times for different molecules in identical conditions displays a peak at finite time (Fig. 4). Parallel observation of a series of single molecules allowed us to assess that the unusual shape of the averaged retraction curve is not due to the presence of a population with a large distribution of kinetic behaviors but rather reflects an identical kinetic process occurring consistently on all single molecules. When purified histones prebound to poly(glutamic acid) (22) were used, a smooth compaction was still observed but the kinetics were quasi-exponential and the rate was 1/50 as fast (not shown). Thus, the fast and sigmoidal kinetics are an intrinsic property of systems containing both histones and assembly factors (7): the contribution of factors distinct from the histones themselves is important. Taken together, these data support a process related to nucleosome formation because (i) it occurs only in extracts known for their competence for nucleosome assembly, (ii) it depends on the presence of histones, and (iii) it leads to a packing ratio of DNA that is compatible with chromatin structures.
Figure 3.
Effect of dilution on kinetics. (A) Lag time (time of intercept of the tangent to inflexion point with the horizontal line drawn from length at time 0) versus dilution. (B). Inverse of the maximal compaction rate (inverse slope at inflexion point) versus dilution. Shear rates 26.25 (□), 175 (○), and 1,050 (▵) s−1.
Figure 4.
Histogram of lag times before the onset of compaction, for individual molecules in identical conditions (shear rate 26.25 s−1, 1:50 dilution).
Vizualisation of Chromatin Fibers by SFM.
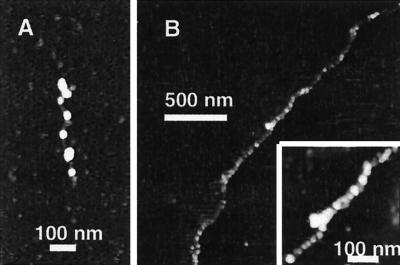
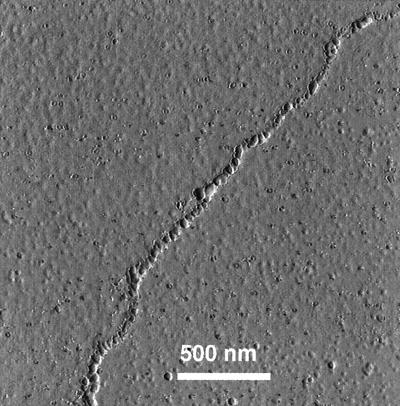
A high resolution of the structural properties of our reaction product was, however, necessary to determine whether canonical nucleosomes or chromatin could be directly observed. SFM was used for this purpose. In 1:100-diluted extracts, after a 1-min incubation time (corresponding to full compaction in videomicroscopy at this dilution) a majority of “beads-on-a-string” structures, very similar to those obtained for native chromatin depleted of linker histones (27, 31), was observed (Fig. 5A for a short sheared fragment). For soft biological samples in air, flattening and spreading cannot be avoided, because of van der Waals forces and finite pressure of the tip. Therefore, the width (15–45 nm in a direction parallel to the surface) and thickness (typically 3 nm in the direction perpendicular to the surface) of the beads do not reflect the actual three-dimensional dimensions of the fiber in water. They are, however, consistent with those previously described for canonical chromatin by SFM (27). The distribution of bead sizes suggests they do not all correspond to individual nucleosomal particles. In extracts at 1:20 dilution, more compact “sausage-like” fibers reminiscent of the 30-nm fiber in native chromatin (27, 31) were obtained (Fig. 5B and Fig. 6; the structures in our experiments appear slightly smoother than in ref. 27, because of a larger tip radius, about 30 nm). Thirty-nanometer structures normally contain linker histones such as H1. It is thus conceivable that, in our experiments, B4, an embryonic variant present in our extract, could be incorporated in the fiber (32). At intermediate dilutions, a combination of beads and “sausage” structures could be detected on the same DNA molecule. In general, the sausage conformation was favored by longer incubation times and higher extract concentrations. These observations are consistent with an assembly process in which nucleosomes are formed first and then folded into a higher-order structure (30-nm fiber type). Most importantly, they reveal that this high compaction level can be reached in less than 1 min, even in 20-fold-diluted extracts. This time is shorter than the time required in vivo to reestablish mature chromatin structures after the passage of the replication fork, as determined by nuclease sensitivity (33).
Figure 5.
SFM images of the assembled chromatin [at 50% relative humidity in tapping mode on a Nanoscope III (Digital Instruments)] after 1-min incubation. (A) Short DNA fragment, obtained by shearing λ-phage, in extract at 1:100 dilution. (B) T4 DNA in extract at 1:25 dilution (Inset: magnified view). A drop was diluted in a large amount of buffer, immediately deposited on mica, incubated 20 s to initiate adsorption of complexes, and spread with argon to favor extended conformations.
Figure 6.
Amplitude full images, for the SFM scan of Fig. 5B (T4 phage DNA incubated at 1:25 dilution).
Kinetic Model.
Our results provide a detailed kinetic study of very early events involved in chromatin assembly. The sigmoidal length decrease observed implies nontrivial kinetic laws. Several sequential events of similar time scale must occur before the DNA wrapping, which produces the detected compaction. Different analytical models that could describe the experimental data were examined, and an adequate fit could be obtained only for a mechanism involving a minimum of three steps with comparable time constants. We could also deduce from Fig. 3 that the limiting step(s) in the compaction process are first order reactions in concentration of extracts (note that this finding also confirms that the release of YOYO dyes is not rate-limiting in the reaction). Considering that histones were critical in the reaction, and taking into account in vivo and in vitro data supporting a two-step model for histone deposition (7, 33–42), we could incorporate our findings in this model to provide definite kinetic parameters. We thus fitted our data to a kinetic model (Eq. 1) with the following steps: (i) a H3–H4 tetramer is loaded at a random position along the DNA (k1); (ii) a first H2A–H2B dimer binds on one of two available sites on the tetramer/DNA complex (k2) followed by a second H2A–H2B dimer on the remaining site (constant k′2 = k2/2, because only one site among two remains available); (iii) DNA wraps around the complex, leading to compaction into a nucleosome core particle (k3).
 |
Note that a process in which the DNA would wrap around the H3–H4 tetramer readily upon its complexation, as previously observed in partial reconstitution, would yield an exponential evolution of the molecule length.
Length data were fitted, by using Igor Pro software (Lake Oswego, OR), to the analytical solution of the three-step chemical kinetic model (Eq. 1). The same set of kinetic constants k1, k2, and k3 was used for all extract dilutions, and the histone concentration in each experiment was deduced from the dilution factor, assuming an equal proportion of histones in the extract. To improve fit stability, k3 was set manually. Only values much larger than k1 and k2 led to reasonable fits. This is indeed consistent with the first-order dependence of the retraction time on extract concentration (Fig. 3): DNA wrapping is zeroth order and thus it cannot be the rate-limiting step of a first-order process). The set of curves obtained for all dilutions at shear rates of 26.5 and 125 s−1 fits well with this model (Fig. 2, full lines), with k1 = 5.2 × 10⁶ (s⋅mol/liter)−1, k′2 ≈ ½k2 = 5.4 × 10⁶ (s⋅mol/liter)−1, and k3 ≫ k2.
The role of H2A–H2B on the compaction was experimentally confirmed, because a 10-fold enrichment in H2A–H2B dimers in the reaction medium speeds up the compaction process in a manner quantitatively fitted by the model (Fig. 2B, green versus red curve). The contribution of H3–H4 tetramer was tentatively assessed by using the same approach, but irreversible aggregation occurred. For simplification, only components that are part of the final product have been represented in the kinetic model (Eq. 1), but it is important to note that chaperones and assembly factors are implicitly taken into account in this equation. The experimental approach proposed here, combined with enrichment-depletion of extracts with specific factors or combinations of such, will provide a unique way of getting a deeper and quantitative understanding of the molecular mechanisms underlying chromatin assembly.
Conclusions
This study unveils unpredicted features of the earliest events underlying chromatin assembly, providing us with a quantitative framework for understanding the dynamics of this structure. We can now determine quantitatively the kinetic constants involved in the early stages of chromatin assembly. The fact that highly compacted forms could be obtained and detected in physiological conditions on a time scale much shorter than observed so far will have to be incorporated into our appreciation of chromatin dynamics. In that respect it is remarkable to note that the progression rate of Escherichia coli RNA polymerase or T7 DNA polymerase measured on naked DNA (43, 44) is of the order of 2–12 bp/s and 100 bp/s, respectively. Notwithstanding the complexity of chromatin rearrangements during both replication and transcription of DNA in vivo (6), it is thus compelling to realize that the assembly machinery present in the cell nucleus could accommodate such a rapid polymerase progression without leaving any significant portion of unassembled DNA behind. This machinery provides the cell with means to undergo fast expression without compromising the high level of DNA organization and protection offered by chromatin. Further studies of assembly under controlled mechanical constraints will certainly be useful to deepen our understanding of the molecular mechanisms of assembly.
Acknowledgments
We are indebted to Dr. P. Nassoy for his advice on DNA grafting protocols, to Dr. P. Silberzan for his help in SFM, to D. Roche for her help in preparing and characterizing Xenopus egg extracts, to Drs. D. Jary for providing T4 DNA and J. Mello for critical reading. We thank Drs. P. B. Becker, D. Bensimon, F. Brochard, H. Buc, D. Chatenay, P.-G. de Gennes, D. Louvard, and J. Prost for their stimulating comments on the manuscript. This Work was financed in part by grants from the Centre National de la Recherche Scientifique, the Institut Curie, the Direction Générale de l'Armement, and the Association de la Recherche sur le Cancer. P.D. acknowledges postdoctoral grants from the Ministère des Affaires Etrangères and the Fondation pour la Recherche Médicale.
Abbreviation
- SFM
scanning force microscopy
Footnotes
Article published online before print: Proc. Natl. Acad. Sci. USA, 10.1073/pnas.250471597.
Article and publication date are at www.pnas.org/cgi/doi/10.1073/pnas.250471597
References
- 1.Luger K, Mader A W, Richmond R K, Sargent D F, Richmond T J. Nature (London) 1997;389:251–260. doi: 10.1038/38444. [DOI] [PubMed] [Google Scholar]
- 2.Van Holde K E. Chromatin. New York: Springer; 1988. [Google Scholar]
- 3.Kornberg R D, Lorch Y. Cell. 1999;98:285–294. doi: 10.1016/s0092-8674(00)81958-3. [DOI] [PubMed] [Google Scholar]
- 4.Wolffe A P. Chromatin Structure and Function. 3rd Ed. London: Academic; 1998. [Google Scholar]
- 5.Felsenfeld G. Cell. 1996;86:13–19. doi: 10.1016/s0092-8674(00)80073-2. [DOI] [PubMed] [Google Scholar]
- 6.Workman J L, Kingston R E. Annu Rev Biochem. 1998;67:545–579. doi: 10.1146/annurev.biochem.67.1.545. [DOI] [PubMed] [Google Scholar]
- 7.Kaufman P D, Almouzni G. In: Chromatin Structure and Gene Expression, Frontiers in Molecular Biology. 2nd Ed. Elgin S, Workman J, editors. Oxford, U.K.: Oxford Univ. Press; 2000. , in press. [Google Scholar]
- 8.Wassarman P M, Kornberg R D, editors. Nucleosomes, Methods in Enzymology. London: Academic; 1989. [Google Scholar]
- 9.Wassarman P M, Wolffe A P, editors. Chromatin, Methods in Enzymology. London: Academic; 1999. [Google Scholar]
- 10.Becker P, editor. Chromatin Protocols, Methods in Molecular Biology. Totowa, NJ: Humana; 1999. [Google Scholar]
- 11.Stein A. J Mol Biol. 1979;130:103–134. doi: 10.1016/0022-2836(79)90421-2. [DOI] [PubMed] [Google Scholar]
- 12.Daban J R, Cantor C R. J Mol Biol. 1982;156:771–779. doi: 10.1016/0022-2836(82)90141-3. [DOI] [PubMed] [Google Scholar]
- 13.Smith S B, Finzi L, Bustamante C. Science. 1992;258:1122–1126. doi: 10.1126/science.1439819. [DOI] [PubMed] [Google Scholar]
- 14.Perkins T T, Smith D E, Chu S. Science. 1997;276:2016–2021. doi: 10.1126/science.276.5321.2016. [DOI] [PubMed] [Google Scholar]
- 15.Merkel R, Nassoy P, Leung A, Ritchie L, Evans E. Nature (London) 1999;397:50–53. doi: 10.1038/16219. [DOI] [PubMed] [Google Scholar]
- 16.Laskey R A, Mills A D, Morris N R. Cell. 1977;10:237–243. doi: 10.1016/0092-8674(77)90217-3. [DOI] [PubMed] [Google Scholar]
- 17.Almouzni G, Méchali M. EMBO J. 1988;7:665–672. doi: 10.1002/j.1460-2075.1988.tb02861.x. [DOI] [PMC free article] [PubMed] [Google Scholar]
- 18.Almouzni G, Méchali M. EMBO J. 1988;7:4355–4365. doi: 10.1002/j.1460-2075.1988.tb03334.x. [DOI] [PMC free article] [PubMed] [Google Scholar]
- 19.Becker P B, Wu C. Mol Cell Biol. 1992;12:2241–2249. doi: 10.1128/mcb.12.5.2241. [DOI] [PMC free article] [PubMed] [Google Scholar]
- 20.Soeller W C, Poole S J, Kornberg T. Genes Dev. 1988;2:68–81. doi: 10.1101/gad.2.1.68. [DOI] [PubMed] [Google Scholar]
- 21.Kadonaga J T. J Biol Chem. 1990;265:2624–2631. [PubMed] [Google Scholar]
- 22.Stein A, Whitlock J P, Jr, Bina M. Proc Natl Acad Sci USA. 1979;76:5000–5004. doi: 10.1073/pnas.76.10.5000. [DOI] [PMC free article] [PubMed] [Google Scholar]
- 23.Perkins T T, Quake S R, Smith D E, Chu S. Science. 1994;264:822–826. doi: 10.1126/science.8171336. [DOI] [PubMed] [Google Scholar]
- 24.McMurray C T, van Holde K E. Proc Natl Acad Sci USA. 1986;83:8472–8476. doi: 10.1073/pnas.83.22.8472. [DOI] [PMC free article] [PubMed] [Google Scholar]
- 25.Simon R H, Felsenfeld G. Nucleic Acids Res. 1979;6:689–696. doi: 10.1093/nar/6.2.689. [DOI] [PMC free article] [PubMed] [Google Scholar]
- 26.Doyle P S, Ladoux B, Viovy J-L. Phys Rev Lett. 2000;84:4769–4772. doi: 10.1103/PhysRevLett.84.4769. [DOI] [PubMed] [Google Scholar]
- 27.Leuba S H, Yang G, Robert C, Samori B, van Holde K, Zlatanova J, Bustamante C. Proc Natl Acad Sci USA. 1994;91:11621–11625. doi: 10.1073/pnas.91.24.11621. [DOI] [PMC free article] [PubMed] [Google Scholar]
- 28.Cui Y, Bustamante C. Proc Natl Acad Sci USA. 2000;97:127–132. doi: 10.1073/pnas.97.1.127. [DOI] [PMC free article] [PubMed] [Google Scholar]
- 29.Brewer L R, Corzett M, Balhorn R. Science. 1999;286:120–123. doi: 10.1126/science.286.5437.120. [DOI] [PubMed] [Google Scholar]
- 30.Segal I H. Enzyme Kinetics. New York: Wiley; 1975. [Google Scholar]
- 31.Yang G, Leuba S H, Bustamante C, Zlatanova J, van Holde K. Nat Struct Biol. 1994;1:761–763. doi: 10.1038/nsb1194-761. [DOI] [PubMed] [Google Scholar]
- 32.Smith R C, Dworkin-Rastl E, Dworkin M B. Genes Dev. 1988;2:1284–1295. doi: 10.1101/gad.2.10.1284. [DOI] [PubMed] [Google Scholar]
- 33.Worcel A, Han S, Wong M L. Cell. 1978;15:969–977. doi: 10.1016/0092-8674(78)90280-5. [DOI] [PubMed] [Google Scholar]
- 34.Senshu T, Fukuda M, Ohashi M. J Biochem (Tokyo) 1978;84:985–988. doi: 10.1093/oxfordjournals.jbchem.a132213. [DOI] [PubMed] [Google Scholar]
- 35.Cremisi C, Chestier A, Yaniv M. Cell. 1977;4:947–951. doi: 10.1016/0092-8674(77)90159-3. [DOI] [PubMed] [Google Scholar]
- 36.Jackson V. Biochemistry. 1987;26:2315–2325. doi: 10.1021/bi00382a037. [DOI] [PubMed] [Google Scholar]
- 37.Jackson V. Biochemistry. 1988;27:2109–2120. doi: 10.1021/bi00406a044. [DOI] [PubMed] [Google Scholar]
- 38.Jackson V. Biochemistry. 1990;29:719–731. doi: 10.1021/bi00455a019. [DOI] [PubMed] [Google Scholar]
- 39.Almouzni G, Clark D J, Méchali M, Wolffe A P. Nucleic Acids Res. 1990;18:5767–5774. doi: 10.1093/nar/18.19.5767. [DOI] [PMC free article] [PubMed] [Google Scholar]
- 40.Smith S, Stillman B. EMBO J. 1991;10:971–980. doi: 10.1002/j.1460-2075.1991.tb08031.x. [DOI] [PMC free article] [PubMed] [Google Scholar]
- 41.Hansen J C, van Holde K E, Lohr D. J Biol Chem. 1991;266:4276–4282. [PubMed] [Google Scholar]
- 42.Gruss C, Wu J, Koller T, Sogo J M. EMBO J. 1993;12:4533–4545. doi: 10.1002/j.1460-2075.1993.tb06142.x. [DOI] [PMC free article] [PubMed] [Google Scholar]
- 43.Wuite G J L, Smith S B, Young M, Keller D, Bustamante C. Nature (London) 2000;404:103–106. doi: 10.1038/35003614. [DOI] [PubMed] [Google Scholar]
- 44.Davenport R J, Wuite G J L, Landick R, Bustamante C. Science. 2000;287:2497–2500. doi: 10.1126/science.287.5462.2497. [DOI] [PubMed] [Google Scholar]


