Abstract
Gastrointestinal (GI) motility is well organized. GI muscles act as a functional syncytium to achieve physiological functions under the control of neurones and pacemaker cells, which generate basal spontaneous pacemaker electrical activity. To date, it is unclear how spontaneous electrical activities are coupled, especially within a micrometre range. Here, using a microelectrode array, we show a spatio-temporal analysis of GI spontaneous electrical activity. The muscle preparations were isolated from guinea-pig stomach, and fixed in a chamber with an array of 8 × 8 planar multielectrodes (with 300 μm in interpolar distance). The electrical activities (field potentials) were simultaneously recorded through a multichannel amplifier system after high-pass filtering at 0.1 Hz. Dihydropyridine Ca2+ channel antagonists are known to differentiate the electrical pacemaker activity of interstitial cells of Cajal (ICCs) by suppressing smooth muscle activity. In the presence of nifedipine, we observed spontaneous electrical activities that were well synchronized over the array area, but had a clear phase shift depending on the distance. The additional application of tetrodotoxin (TTX) had little effect on the properties of the electrical activity. Furthermore, by constructing field potential images, we visualized the synchronization of pacemaker electrical activities resolving phase shifts that were measurable over several hundred micrometres. The results imply a phase modulation mechanism other than neural activity, and we postulate that this mechanism enables smooth GI motility. In addition, some preparations clearly showed plasticity of the pacemaker phase shift.
Numerous mechanisms underlie the co-ordinated movement(s) of gastrointestinal (GI) muscle to appropriately mix, digest and transport the luminal contents. GI smooth muscle cells are electrically connected via gap junctions, thus acting as a functional syncytium (Nakamura et al. 1998; Daniel & Wang, 1999; Sperelakis & Daniel, 2004). It is also well known that enteric neural networks organize peristaltic movement. Different phases of muscle movement (ascending contraction and descending relaxation), which are location dependent, are simultaneously evoked by the mechanical pressure of luminal contents through the coactivation of ascending excitatory and descending inhibitory motor neurones (Hansen, 2003).
Evidence now being accumulated suggests that neither smooth muscle nor enteric neurones but, rather, network-forming interstitial cells in the myenteric plexus produce basal pacemaker electrical activity in the GI tract, referred to as slow waves. These special pacemaker cells are identified with Kit-immunoreactivity and show some histological resemblance to interstitial cells of Cajal (ICCs) (Maeda et al. 1992; Hirst & Ward, 2003; Takaki, 2003; Rumessen & Vandervinden, 2003). We have shown a plausible cellular mechanism underlying pacemaker activity whereby intracellular Ca2+ oscillations periodically activate Ca2+-dependent ion channels in the plasma membrane of pacemaker cells (Aoyama et al. 2004; Liu et al. 2005a,b; Nakayama et al. 2005). However, how spontaneous electrical activities are coupled in the circular and longitudinal directions remains ambiguous. This study employs an array of 8 × 8 planar microelectrodes previously used for brain slice and explant preparations (Shimono et al. 2000; Nakamura et al. 2002) to demonstrate the first spatial and temporal analysis of spontaneous electrical activities in the smooth muscle of the stomach. The findings presented here demonstrate that spontaneous electrical activities are synchronized resolving phase shifts that were measurable over a range of several hundred micrometres.
Methods
Animals and preparations
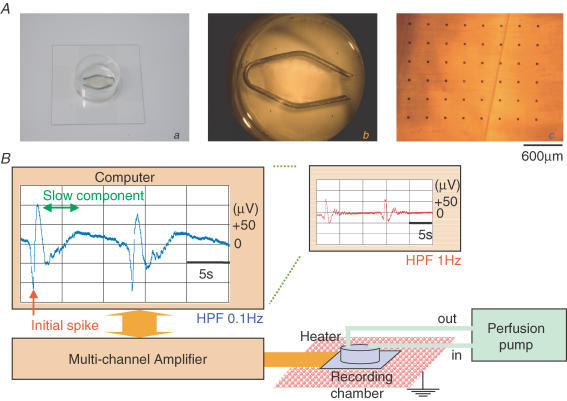
Approximately 3 weeks after birth, guinea-pigs were killed by cervical dislocation and exanguination after being anaesthetized with diethyl ether. All procedures conformed with the Guiding Principles for the Care and Use of Animals in the Field of Physiological Sciences published by the The Physiological Society of Japan, japanese Government Animal Protection and Managing Law (No. 105), and Japanese Government Notification on Methods on Sacrificing Animals (No. 40). Also, the animal experiments carried out in the present study were approved by the Committee for Animal Experiments in Nagoya University Graduate School of Medicine. The stomach was quickly excised, and the mucosa was removed with fine scissors. Small segments of the whole-muscle layer (∼8 mm × 15 mm) were dissected and mounted in a probe containing 64 planar electrodes (8 × 8 grid). The preparation was held down under the strings of a slice anchor (SDH series, Harvard Apparatus Japan, Tokyo, Japan); this procedure is normally used to attach brain slices to multiple planar electrodes in a recording chamber. The preparation is illustrated in Fig. 1Aa–c.
Figure 1. A multiple electrode system to measure spontaneous electrical activity in the stomach muscle.
Micrographs in Aa (camera), Ab (stereo microscope) and Ac (inverted microscope) show a stomach muscle preparation fixed in a recording chamber with an 8 × 8 array of planar microelectrodes. Scale bar, 600 μm. The diagram in B summarizes the recording set-up. A stomach muscle preparation fixed in a recording chamber was placed on a carefully earthed heater and superfused with a peristaltic pump. The field potentials were measured through a multichannel amplifier. The main and submonitors of the computer system display spontaneous electrical activities measured from the same preparation after high-pass filtering at 1 and 0.1 Hz, respectively.
Electrical recordings
An 8 × 8 planar electrode array (300 μm in polar distance) connected to a 64-channel amplifier (MED 64 System, Alpha Medical Science, Osaka, Japan) was used to simultaneously record electrical field potentials over the stomach smooth muscle segments. The whole-muscle layer preparation was fixed in the recording chamber, normally with the circular muscle layer placed directly on the electrodes. The tissue was superfused with a modified Krebs solution (normal extracellular solution) at a constant rate of 2 ml min−1, and placed on a heater kept at 35°C (Fig. 1B). A circle of Pt wire running along the inner wall of the recording chamber was used as an earth electrode. After low-pass filtering at 10 kHz, the electrical potentials were recorded at a sampling rate of 20 kHz. A high-pass filter (HPF) of 0.1 Hz was applied to stabilize the baseline drift of the DC potential (Brock & Cunnane, 1987).
The field potential trace displayed in the computer monitor (Fig. 1B) exemplifies such a recording. The small monitor (right) shows the effect of high-pass filtering at 1 Hz on the shape of the extracellularly recorded spontaneous electrical potentials.
The recording chamber with arrayed electrodes was made from non-toxic materials (Oka et al. 1999). After field potential recordings were made, an antral muscle preparation was checked using a confocal microscope. No impairment was observed in transmission images and immunostaining images of Kit-immunopositive cells in the circular muscle layer (see Supplemental Fig. 1 in online Supplemental material; the images were obtained from the same preparation as used in Fig. 3).
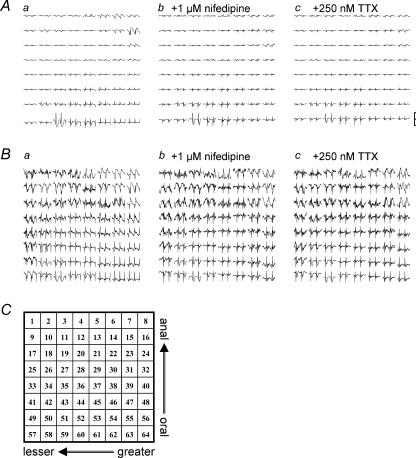
Figure 3. An example of the distribution of spontaneous electrical activities in a stomach muscle preparation recorded using an 8 × 8 array of microelectrodes with a polar distance of 300 μm.
Each trace in A shows the normalized field potential with a y-range of ±150 μV (scale bar). Recording duration, 30 s. The upper and lower ends correspond to the anal and oral ends of the gastric antrum, while the left and right correspond to the lesser and greater curvature ends, respectively. The array of traces in a was recorded in normal solution. The array in b was obtained approximately 5 min after the application of 1 μm nifedipine. Subsequently, the array in c was obtained 5 min after an additional application of 250 nm TTX. In B, the y-range was adjusted to show more clearly the shape of spontaneous electrical activity at each recording channel. The channel number of the arrayed electrodes is shown in C.
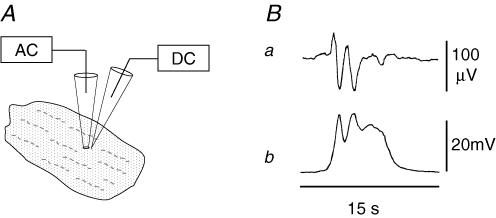
In order to assess how the extracellularly recorded field potentials reflect changes in the intracellular membrane potential during spontaneous electrical activity, extracellular and intracellular recordings were carried out simultaneously in separate experiments using isolated stomach muscle preparations (∼5 mm × 10 mm). Glass electrodes with tips 200–400 μm in diameter were used for extracellular recordings (high-pass frequency: 0.03 Hz; low-pass frequency: 100 Hz), and conventional sharp glass microelectrodes (30–50 MΩ resistance after being filled with 3 m KCl) were used for intracellular recordings (Katayama et al. 1990, 1993; Nakayama et al. 1990). A homemade AC amplifier and a commercial high-impedance amplifier (MEZ-8201: Nihon Koden Ltd, Tokyo, Japan), respectively, were used for these recordings.
Solutions and drugs
The composition of the ‘normal’ extracellular solution, the modified Krebs solution, was (mm): NaCl 125, KCl 5.9, MgCl2 1.2, CaCl2 2.4, glucose 11, Tris-Hepes 11.8 (pH 7.4). Nifedipine and tetrodotoxin (TTX) were purchased from Sigma (St Louis, MO, USA).
Statistics and analyses
Numerical data are expressed as means ± s.d. A cross-correlation of spontaneous electrical potentials recorded in distinct electrodes was performed using commercial add-in software (Kyowa Electronic Instruments, Tokyo, Japan).
Two-dimensional field potential images were constructed by calculating the values at the desired location via spline interpolation, using the MATLAB software package (Mathworks: Natick, MA, USA) (Shimono et al. 2000).
Results
Measurements of gastric spontaneous electrical activity using an array of microelectrodes
An array of 8 × 8 planar microelectrodes was employed to extracellularly record spontaneous electrical activity at 64 sites across the muscle layer preparations, which were isolated from the guinea-pig gastric antrum, and mounted in the recording chamber with the circular muscle layer attached to the electrodes. As previously found in studies using glass extracellular electrodes (Katayama et al. 1990; Nakayama et al. 1990), the shape of the spontaneous electrical activity varied greatly, but usually consisted of an initial, fast negative potential (red arrow in Fig. 1B) followed by a slowly decaying component (green double arrow). Additional positive and/or negative fluctuations were often observed, although they sometimes obscured the slowly decaying component (see below).
In order to examine the relationship of these two components to intracellular events, we carried out simultaneous recordings with extracellular and intracellular electrodes (Fig. 2). The initial, fast negative potential recorded extracellularly corresponds to the initial, rapid depolarization of the membrane potential, while the following slow component, which fluctuates near the baseline in this sample, reflects the plateau and repolarizing phases.
Figure 2. Simultaneous recordings of extracellular and intracellular spontaneous electrical activities in a stomach muscle preparation.
A, diagram of the simultaneous recordings. Electrical signals were recorded through extracellular (AC amplifier) and intracellular (DC amplifier) glass microelectrodes. B, extracellular and intracellular recordings are shown in the upper and lower traces, respectively. For the extracellular recording, a high-pass filter frequency of 0.03 Hz was applied.
As will be shown in further analysis (below), the slow component of the field potential appears to reflect the electrical activity over a considerably wide area of the stomach muscle. The slow component therefore exhibits large variations in shape, both within and across preparations. For example, as shown in Fig. 2, the second, fast negative potential in the extracellular record corresponds well with the second rapid depolarization. The second negative potential, which obscures much of the slow component, can probably be attributed to long-range coupling, as shown below (e.g. Fig. 7).
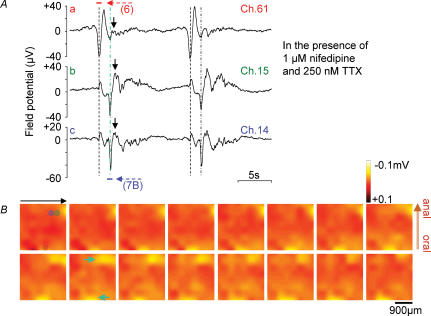
Figure 7. Interaction of field potentials in a long range.
In A, traces a–c show spontaneous electrical activities recorded at Ch. 61, 15 and 14, respectively, in the presence of 1 μm nifedipine and 250 nm TTX. Note that the initial fast negative potential (second dotted line) and the following positive hump (arrows) seen at Ch. 15 and 14 influenced in the slowly decaying component at Ch. 61, recorded at a distance of ∼2 mm. The first dotted lines represent the initial negative potentials at Ch. 61. Field potential images in B were acquired at 50 ms intervals during the period indicated by a blue horizontal bar (800 ms) in Ac. A red horizontal bar (750 ms) in Aa indicates the period during which field potential images in Fig. 6 were acquired. In B, cyan arrows indicate the coupling of spontaneous long-distance electrical activities (corresponding to the cyan dotted line in A).
Effects of nifedipine and TTX
Figure 3 shows the distribution of spontaneous electrical activities recorded from the guinea-pig gastric antrum. In Fig. 3Aa, a muscle preparation was under superfusion with a ‘normal’ (modified Krebs) extracellular solution. In this recording, the array electrode probe had a polar distance of 300 μm. The upper and lower ends correspond to the anal and oral ends of the gastric antrum, respectively, while the left and right correspond to the lesser and greater curvature ends. This set of 8 × 8 field potential recordings is plotted with the same scale of amplitude, indicating the existence of a gradient in the field potential amplitude.
Figure 3B was reconstructed from Fig. 3A by expanding the amplitude (y-axis) to more clearly display spontaneous electrical activity recorded in each planar electrode, indicating that the occurrence of spontaneous electrical activity was well synchronized over the electrode array area. Essentially, the synchronicity of electrical activities was similar in all antral muscle preparations tested. The frequency of spontaneous electrical activity ranged from 2.60 to 4.58 cycles min−1 (3.53 ± 0.66 cycles min−1, n = 18).
Dihydropyridine (DHP) Ca2+ channel antagonists are known to isolate pacemaker electrical activity generated by ICCs (equivalent to Kit-immunopositive interstitial cells) by suppressing smooth muscle contractility (Dickens et al. 1999; Torihashi et al. 2002). (It is hypothesized that pacemaker potentials generated in ICCs are conducted toward smooth muscle cells via gap junction channels. Consequently, voltage-dependent Ca2+ channels (VDCCs) (mainly DHP sensitive, L-type) are periodically activated to cause spontaneous phasic contractions in the GI tract. Therefore, application of DHP Ca2+ channel antagonists can dissociate the E–C coupling.) Figure 3Ab shows the distribution of spontaneous electrical activities in the presence of 1 μm nifedipine. This treatment had little effect on the frequency of spontaneous electrical activity. In addition, the shape of the field potential was not significantly altered in the majority of recording channels, a finding which agrees well with previous intracellular recordings (Huang et al. 1999; Dickens et al. 1999).
In order to assess whether the enteric nerve activity altered the coupling of pacemaker electrical activities originating from ICCs, the effect of TTX was examined. The additional application of 250 nm TTX had little or no further effect on these field potential recordings (Fig. 3Ac).
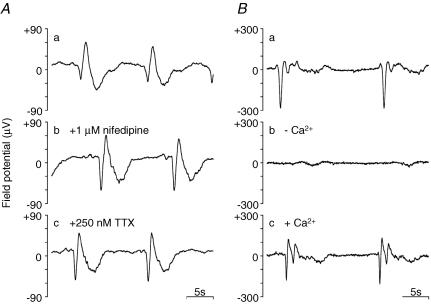
The effects of nifedipine and TTX are exemplified in Fig. 4A, in which spontaneous electrical activity recorded at channel (Ch.) 50 is expanded. Application of nifedipine caused no remarkable change in the majority of the recording channels. A small number of recording channels in this preparation showed suppression of a slow decaying component, not accompanied by changes in the noise level, i.e. at the electrodes in the upper right quadrant (Supplemental Fig. 2). This result could be explained by a localized high L-type Ca2+ current density area and/or local contractile activity. The noise level is known to proportionally reflect the square root of access resistance (impedance). The lack of a significant change in the noise level after the application of nifedipine suggests that the electrical and mechanical contacts between the recording electrodes and the surface of the circular muscle were relatively stable, but it is likely that inner smooth muscle cells periodically contracted following pacemaker electrical activity during the field potential recordings in the absence of Ca2+ channel antagonists. Alterations of the field potential shape were obscure in many antral muscle preparations, due partly to the plasticity of pacemaker activity (Supplemental Fig. 3), as shown below. Unlike the case of applications of DHP Ca2+ antagonists and TTX, removal of extracellular Ca2+ terminated, and a subsequent reapplication of Ca2+ restored spontaneous electrical activity (Fig. 4B).
Figure 4. Sample traces showing the effects of nifedipine, TTX and extracellular Ca2+.
In A, the field potentials recorded at Ch. 50 in the same stomach muscle preparation used in Fig. 3 are shown in an expanded form. The trace in a was recorded in normal solution. The traces in b and c were obtained in the presence of 1 μm nifedipine, and the additional presence of 250 nm TTX. In B, the effects of the removal and reapplication of extracellular Ca2+ are shown. The field potential recordings were obtained from another preparation.
Pacemaker phase shift within a distance of several micrometres
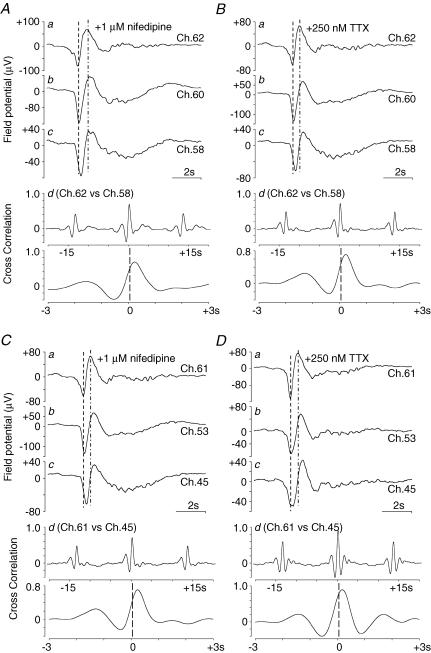
Although the frequency of spontaneous electrical activity was essentially the same over the recording area, phase differences were clearly observed between some of the electrodes. Figure 5Aa–c shows spontaneous potentials recorded from electrodes orientated in the same direction as the circular muscle (Ch. 62, 60 and 58, respectively) in the presence of nifedipine. These electrodes were lined along the circular muscle direction. The peak of the initial fast component of the field potential in Ch. 62 (a) preceded those in Ch. 60 (b) and Ch. 58 (c). Cross-correlation was analysed between the recordings at Ch. 62 and 58 at a distance of 1200 μm (d). The peak of the correlation curve was at ∼230 ms (r = 0.684). These results indicate that the phase shift of spontaneous electrical activity was measurable over a relatively short distance, i.e. within several hundred micrometres. The phase shift of spontaneous field potential activity was also observed in the longitudinal direction (Fig. 5C and D). The peak of the correlation curve between the recordings at Ch. 61 and 45 (600 μm apart) was ∼250 ms (r = 0.864). In this preparation, the spontaneous electrical activity proceeded from the oral and greater curvature ends.
Figure 5. Phase shift of the spontaneous electrical activity.
The field potential traces in A were simultaneously recorded in the presence of 1 μm nifedipine (from the same preparation as that used in Fig. 3), while those in B were recorded after an additional application of 250 nm TTX. The spontaneous electrical activities in a, b and c were recorded at Ch. 62, 60 and 58, respectively. These electrodes were run along the circular muscle. The assignment of the channel number is shown in Fig. 3C. The set of field potential traces represents the phase shift in the circular direction. The cross-correlation curves between spontaneous electrical activities in a and c are shown in d: cross-correlation between Ch. 60 and 58. The upper graphs in d show the cross-correlation curve in the range of ±15 s, while, in the lower graphs, the cross-correlation curves in the range of ±3 s are shown in an expanded form. C and D show the phase shift of the spontaneous electrical activity at Ch. 61, 53 and 45 in the longitudinal (oral-to-anal) direction. Electrical activities in C and D were recorded simultaneously with those in A and B, respectively.
Like the peristaltic reflex co-ordinating ascending contraction and descending relaxation, it is possible that neural activity could produce the pacemaker phase shift. As shown in Fig. 5B, however, the additional application of TTX had little effect on the phase shift and the frequency of pacemaker activity. This result suggests that mechanisms other than neural activity underlie the phase differences of ICC pacemaking over the myenteric plexus. Similar results for phase shifts in the presence of nifedipine and TTX were obtained for all preparations tested (n = 8).
Field potential images
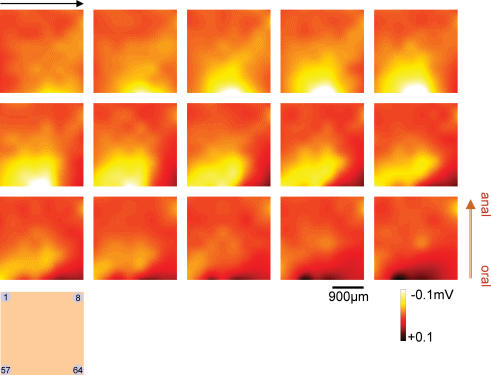
Field potential images were constituted from the array microelectrode recordings in the presence of TTX and nifedipine. Figure 6 contains the field potential images corresponding to the period of the initial fast component (red horizontal bar, 750 ms) in Fig. 7Aa. The excitation near the bottom right (Ch. 61 and 62) preceded the surrounding regions and propagated toward the upper left but localized mainly along the direction of the circular muscle (right to left). (See also Supplemental video 1).
Figure 6. Field potential images constructed from 8 × 8 array planar electrode recordings.
Yellow (to white) and black represent the negative (depolarization) and positive (repolarization) field potentials, respectively. In the presence of 1 μm nifedipine and 250 nm TTX, the images from the top left to the bottom right were sequentially acquired at 50 ms intervals during the initial fast negative potentials indicated by the horizontal bar (red, 750 ms) in Fig. 7Aa.
Long-range interaction
Figure 7 shows an example of the long-range interaction of spontaneous electrical activities. The recordings in Fig. 7Aa–c were from the electrodes of Ch. 61, 15 and 14, respectively, in the presence of nifedipine and TTX (in the same preparation as that used in Fig. 6). A careful comparison of the traces suggests that the largest down-strokes (negative field potentials) in b and c correspond to the peak of a slowly decaying component in a. Furthermore, the following upstrokes in b and c appear to correspond to transient positive humps in a.
The field potential images in Fig. 7B show a long-range interaction of spontaneous excitation, corresponding to Fig. 7A. The period used for reconstructing these images is indicated by a horizontal bar (blue) in Fig. 7Ac. The upper right and bottom middle regions (indicated by arrows in the second image of the lower row) had synchronized excitation. These results indicate that spontaneous activities over the recording area of ∼2 mm are synchronized in a complex manner: one region has an initial spike (near Ch. 14 and 15) and, at the same time, a slow component is running in another region (near Ch. 61 at the time indicated by a cyan line in A and cyan arrows in B). It seems likely that analogous long-range interaction is responsible for the second, negative component of the field potential recording shown in Fig. 2Ba.
Plasticity of the pacemaker phase shift
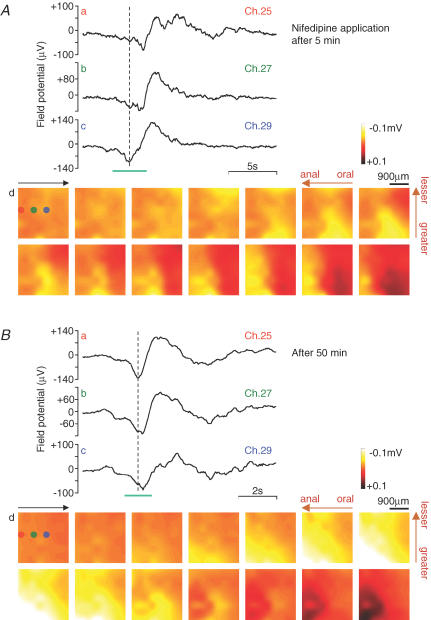
Figure 8 contains an example which shows that the direction of the pacemaker phase shift is not fixed. The field potential traces and images in Fig. 8A were obtained from a gastric antrum preparation approximately 5 min after nifedipine (1 μm) was applied. The field potential traces (a–c) were recorded in Ch. 25, 27 and 29, respectively, and these electrodes ran along the longitudinal muscle from the anal to the oral end. The initial spike (down-stroke) in trace a was followed by those in b and c, indicating that pacemaker activity proceeded from the oral end. The field potential images in d show excitation (yellow area) running from the right to the left (see also Supplemental video 2).
Figure 8. Plasticity of the pacemaker shift.
Field potential recordings with an 8 × 8 array of planar microelectrodes were performed in a gastric antrum preparation, approximately 5 min (A) and 50 min (B), respectively, after the application of 1 μm nifedipine. The field potential traces (a–c) were obtained at Ch. 25, 27 and 29, respectively. The positions of these three electrodes (Ch. 25, 27 and 29) are indicated in the first image in d (brown, green and blue, respectively). The field potential images were acquired at 250 ms and 100 ms intervals, in (A) and (B), respectively, during the period indicated in c (cyan bar).
The field potential traces and images in Fig. 8Ba–d were obtained from the same gastric antrum preparation used in Fig. 8A, approximately 50 min after the application of nifedipine. This preparation was continuously superfused with the same extracellular solution (containing nifedipine). The field potential traces and images clearly show reversed electrical excitation, running from the anal to the oral end (see Supplemental video 3).
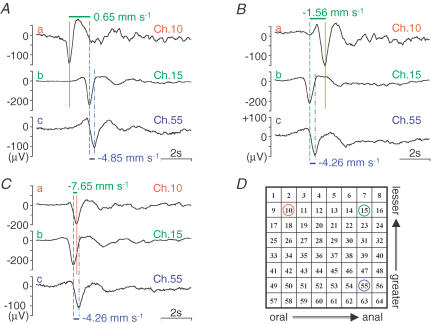
Another example of the plasticity of the pacemaker phase shift is shown in Fig. 9. In the presence of nifedipine (1 μm), this preparation initially had a phase shift of spontaneous electrical activity preceded by the oral end, but unlike preparations shown earlier, spontaneous electrical activity in the lesser curvature end preceded that of the greater curvature end (Fig. 9A). The field potentials (a–c) were recorded in Ch. 10, 15 and 55, respectively. Comparisons of Ch. 10 and 15, and Ch. 15 and 55 show the phase shifts along the longitudinal and circular muscles, respectively. After approximately 15 min, the phase shift was reversed in the longitudinal direction, with excitation running from the anal to the oral end (Fig. 9B). After 20 min, the direction of electrical excitation was the same along both the longitudinal and circular muscles, but the propagation (coupling) velocity increased greatly in the longitudinal direction (Fig. 9C).
Figure 9. An example of spontaneous electrical activity showing the phase shift in the direction of lesser to greater curvature.
The sets of field potential recordings in A–C were obtained approximately 5, 15 and 20 min after the application of nifedipine (1 μm). Recording electrodes are indicated in D.
Phase shift along longitudinal and circular muscles
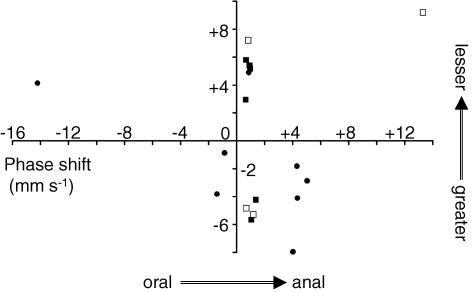
Figure 10 summarizes the phase shift of the spontaneous electrical activity initially observed in antral muscle preparations in the presence of nifedipine (1 μm). The directions of the oral to the anal end (x-axis) and the greater to the lesser curvature end (y-axis), are indicated by plus signs. The phase shift proceeding from the oral end was observed in the majority (15 out of 18) of the preparations, while that proceeding from the lesser curvature end was in more than half (10 out of 18) of the preparations. The propagation velocity of the spontaneous electrical activity along the longitudinal muscle ranged from −14.25 to +13.27 mm s−1, but it was around ∼1 (or −1) mm s−1 in the majority (13 out of 18) of preparations. The velocity along the circular muscle ranged from −7.96 to +9.18 mm s−1 (average absolute velocity of 4.79 ± 2.04 mm s−1). In 10 antral muscle preparations with the pacemaker phase shift proceeding from the oral end in the initial observation (squares in Fig. 10), field potentials were continuously recorded for ∼30 min. It is noteworthy that the direction of excitation was reversed in four (open squares) out of the 10 preparations. Altogether, these results indicate the plasticity of the ICC pacemaker phase shift, although the mechanisms responsible for the alteration of the pacemaker coupling are unclear.
Figure 10. Graph showing the phase shift of spontaneous electrical activity in the longitudinal (x-axis) and circular muscle directions (y-axis).
In the initial recording of spontaneous electrical activity using an 8 × 8 array of planar microelectrodes in the presence of nifedipine, the phase shift was measured between electrodes at a distance of 1200–1500 μm. The directions toward the anal and lesser curvature ends are indicated by plus signs. Ten squares represent preparations which showed the pacemaker phase shift proceeding from the oral end in the initial observation, and in which field potentials were continuously recorded for 20–50 min. □ and ▪ represent preparations in which the pacemaker phase shift proceeding from the oral end was reversed, and preserved, respectively, during the continuous recordings.
Discussion
In isolated guinea-pig stomach muscle, the spontaneous electrical activity recorded with an array of extracellular electrodes is normally divided into two components: (1) an initial fast negative potential, and (2) a subsequent slowly decaying component. A comparison between the extracellular and intracellular recordings with glass electrodes (Fig. 2) suggests that the two components of the spontaneous field potential activity correspond to (1) an initial upstroke (depolarization), and (2) a subsequent plateau and repolarizing phases of the spontaneous activity in the membrane potential, referred to as slow waves in intracellular recordings (Tomita, 1981; Szurszewski, 1987). It is considered that both of these components mainly reflect electrical activity of intramuscular ICCs (ICC-IM), which is triggered by spontaneous electrical activity (giant potentials) of ICCs in the myenteric plexus (ICC-MyP) (Dickens et al. 1999; Edwards & Hirst, 2005).
The field potential amplitude showed a gradient in the surface of the muscle layer (Fig. 3A). Since nifedipine and TTX, inhibitors for smooth muscle and neurones, respectively, had little effect, this field potential gradient is attributable to ICCs (Hirst & Ward, 2003; Takaki, 2003; Rumessen & Vandervinden, 2003). In the preparation shown in Fig. 3, the population of ICC-IM did not differ between the regions showing the gradient of field potential amplitude (Supplemental Fig. 1). Moreover, this gradient is not merely due to differences in the distance between electrodes and pacemaker cells, because the ratio of the amplitudes of the slow and initial fast components (As/Ai) varied depending on the recording points of the preparations. For example, as shown in Fig. 4Ac, As/Ai was 33.6% in Ch. 61, while it increased to 123% in Ch. 58 (450 μm from Ch. 61), even though Ai itself decreased to 43.4% (from 143 to 62 μV). In addition, as shown in Fig. 7, the slow component in Ch. 61 was affected by spontaneous electrical activities around Ch. 14–15, i.e. long-range coupling. These observations suggest that the slow component is produced by the interactions of electrical activities in a wide area, reflecting not only the plateau and repolarizing components of spontaneous electrical activity produced by the nearest pacemaker cells to the recording electrode, but also a fast-rising component generated from a region with a relatively long distance. This interpretation is consistent with the previous conclusions reached through experiments involving the use of multiple glass extracellular electrodes (Katayama et al. 1990).
In the GI tract, the luminal contents cause ascending contraction and descending relaxation through co-ordinating actions of enteric nervous activity. The most striking finding in the present study, the identification of TTX-resistant phase differences in the electrical activities over the recording area of the muscle preparation, stands in contrast to this well-known dogma of GI motility. It is hypothesized that such a phase shift of pacemaker activity in a few hundred micrometres enables smooth GI motility. Namely, the contractions of small segments of the GI tracts linked with a linear phase shift in distance would elaborately squeeze luminal contents in a certain direction. It would be interesting to explore further the mechanism that underlies the phase differences seen here, which occur over a distance of several hundred micrometres (the polar distance of each arrayed electrode was 300 μm in Fig. 6) and to assess the role of this pacemaker shift.
The direction of pacemaker phase shift was reversible in antral muscle preparations, presumably because the preparations used in the present study lack a dominant pacemaker region of the stomach and spontaneous electrical activity can thereby proceed from numerous regions. It has been recently reported that the gastric corpus provides the leading pacemaker activity (referred to as atypical slow waves), the frequency of which is higher than those in adjacent regions of the stomach (Hashitani et al. 2005). In addition, the fact that ICC-MyP are not contained in the corpus suggests that ICC-IM are responsible for this electrical activity. In line with this notion, we previously showed that ICC-IM (and/or other excitable components) in antral muscle can yield spontaneous electrical activity, when the myenteric region is removed (Huang et al. 1999). ICC-MyP are thought to generate primary pacemaker activity in isolated antral muscle preparations (Dickens et al. 1999), but it is possible that numerous components of the tissue, including ICC-IM, contribute to the plasticity of pacemaker phase shift observed in the present study.
Lines of evidence have shown that spontaneous [Ca2+]i oscillations in Kit-immunoreactive interstitial cells (equivalent to ICCs) play a crucial role in generating pacemaker activity (Yamazawa & Iino, 2002; Torihashi et al. 2002; Aoyama et al. 2004; Liu et al. 2005a,b) probably through periodically activating Ca2+-dependent ion channels (Tokutomi et al. 1995; Huizinga et al. 2002; Walker et al. 2002) and subsequently activating voltage-operated ion channels (Strege et al. 2003; Goto et al. 2004). Spatio-temporal properties of spontaneous electrical activity in the gastrointestinal tract, e.g. the plasticity of pacemaker phase shift observed in the present study, appear distinct from cardiac pacemaking, in which pacemaker cells normally dominate the heartbeat by conducting excitation towards cardiac myocytes through special conducting pathways (Publicover & Sanders, 1989). It is thought that the [Ca2+]i oscillations in each ICC are synchronized via an unidentified mechanism over the GI tracts, a pacemaker model based on Ca2+ phase waves. A plausible mechanism currently applied is voltage-dependent activation of phospholipase C and the consequent production of InsP3 (Imtiaz et al. 2002; van Helden & Imtiaz, 2003). The mapping of spontaneous electrical activities in the present study, including the long-range coupling shown in Fig. 7, is consistent with the notion of coupled Ca2+ oscillators ([Ca2+]i oscillations in ICCs) that can operate with a clear phase shift by modulating the connectivity (Imtiaz et al. 2002; van Helden & Imtiaz, 2003). Interestingly, we previously observed that pacemaker [Ca2+]i oscillations have phase differences more frequently in small cell cluster preparations (100–300 μm in diameter) from stomach muscle than in ileal preparations (Liu et al. 2005a).
It has been shown that ICCs are responsible for spontaneous electrical activity recorded in extracellular electrodes (Torihashi et al. 2002; Wang et al. 2005). Alterations in ICCs, referred to as GI pacemaker cells, have been reported in numerous diseases causing GI dismotility, including achalasia of the cardia, infantile hypertrophic pyloric stenosis, chronic intestinal pseudoobstruction, and Hirschsprung's disease. (Vanderwinden et al. 1996; Vanderwinden & Rumessen, 1999). Furthermore, in the light of recent extensive studies, this notion appears to cover popular diseases, including diabetes mellitus (Koch, 2001; Camilleri, 2002) and inflammatory bowel diseases (Wang et al. 2002; Suzuki et al 2004). In the present study, using an 8 × 8 array of planar multielectrodes to map and visualize the distribution of spontaneous electrical activities, it was found that field potentials are heterogeneous in amplitude and phase over an area of several hundred square micrometres, and that TTX does not alter the phase shift. This array microelectrode system provides unique indices for GI motility, and could also be useful in the study of pacemaker activity in numerous diseases, such as those listed above, especially in model animals for GI dismotility.
Acknowledgments
This work was supported by grants-in-aid for scientific research from the Japan Society for the Promotion of Science. The authors are grateful to Drs Thomas C. Cunnane (Oxford University), Frank Schottler (Alpha MED Sciences Co.) and Professor Miyako Takaki (Nara Medical University) for their useful advice and proofreading.
Supplemental material
The online version of this paper can be accessed at:
DOI: 10.1113/jphysiol.2006.118893
http://jp.physoc.org/cgi/content/full/jphysiol.2006.118893/DC1 and contains supplemental material consisting of three figures entitled:
Histological examinations in two recording regions A and B in the same preparation used in Fig. 3
The field potentials recorded at Ch. 14 in the same stomach muscle preparation used in Fig. 3, are shown expanded
An example of spontaneous electrical activity recorded using an array of 8 × 8 microelectrodes
and three videos representing the following:
Field potential movie corresponding to the spontaneous electrical activities shown in Figs 6 and 7;
Field potential movie corresponding to Fig. 8A;
Field potential movie corresponding to Fig. 8B.
This material can also be found as part of the full-text HTML version available from http://www.blackwell-synergy.com
References
- Aoyama M, Yamada A, Wang J, Ohya S, Furuzono S, Goto T, Hotta S, Ito Y, Matsubara T, Shimokata K, Chen SRW, Imaizumi Y, Nakayama S. Requirement of ryanodine receptors for pacemaker Ca2+ activity in ICC and HEK293 cells. J Cell Sci. 2004;117:2813–2825. doi: 10.1242/jcs.01136. [DOI] [PubMed] [Google Scholar]
- Brock JA, Cunnane TC. Relationship between the nerve action potential and transmitter release from sympathetic postganglionic nerve terminals. Nature. 1987;326:605–607. doi: 10.1038/326605a0. [DOI] [PubMed] [Google Scholar]
- Camilleri M. Advances in diabetic gastroparesis. Rev Gastroenterol Disord. 2002;2:47–56. [PubMed] [Google Scholar]
- Daniel EE, Wang YF. Gap junctions in intestinal smooth muscle and interstitial cells of Cajal. Microsc Res Tech. 1999;47:309–320. doi: 10.1002/(SICI)1097-0029(19991201)47:5<309::AID-JEMT2>3.0.CO;2-K. [DOI] [PubMed] [Google Scholar]
- Dickens EJ, Hirst GDS, Tomita T. Identification of rhythmically active cells in guinea-pig stomach. J Physiol. 1999;514:515–531. doi: 10.1111/j.1469-7793.1999.515ae.x. [DOI] [PMC free article] [PubMed] [Google Scholar]
- Edwards FR, Hirst GDS. An electrical description of the generation of slow waves in the antrum of the guinea-pig. J Physiol. 2005;564:213–232. doi: 10.1113/jphysiol.2004.077123. [DOI] [PMC free article] [PubMed] [Google Scholar]
- Goto K, Matsuoka S, Noma A. Two types of spontaneous depolarizations in the interstitial cells freshly prepared from the murine small intestine. J Physiol. 2004;559:411–422. doi: 10.1113/jphysiol.2004.063875. [DOI] [PMC free article] [PubMed] [Google Scholar]
- Hansen MB. Neurohumoral control of gastrointestinal motility. Physiol Res. 2003;52:1–30. [PubMed] [Google Scholar]
- Hashitani H, Garcia-Londono AP, Hirst GDS, Edwards FR. Atypical slow waves generated in gastric corpus provide dominant pacemaker activity in guinea pig stomach. J Physiol. 2005;569:459–465. doi: 10.1113/jphysiol.2005.097907. [DOI] [PMC free article] [PubMed] [Google Scholar]
- Hirst GDS, Garcia-Londono AP, Edwards FR. Propagation of slow waves in the guinea-pig gastric antrum. J Physiol. 2006;571:165–177. doi: 10.1113/jphysiol.2005.100735. [DOI] [PMC free article] [PubMed] [Google Scholar]
- Hirst GDS, Ward SM. Interstitial cells: involvement in rhythmicity and neural control of gut smooth muscle. J Physiol. 2003;550:337–346. doi: 10.1113/jphysiol.2003.043299. [DOI] [PMC free article] [PubMed] [Google Scholar]
- Huang S-M, Nakayama S, Iino S, Tomita T. Voltage sensitivity of slow wave frequency in isolated circular muscle strips from guinea pig gastric antrum. Am J Physiol Gastrointest Liver Physiol. 1999;276:G518–G528. doi: 10.1152/ajpgi.1999.276.2.G518. [DOI] [PubMed] [Google Scholar]
- Huizinga JD, Zhu Y, Ye J, Molleman A. High-conductance chloride channels generate pacemaker currents in interstitial cells of Cajal. Gastroenterology. 2002;123:1627–1636. doi: 10.1053/gast.2002.36549. [DOI] [PubMed] [Google Scholar]
- Imtiaz MS, Smith DW, van Helden DF. A theoretical model of slow wave regulation using voltage-dependent synthesis of inositol 1,4,5-trisphosphate. Biophys J. 2002;83:1877–1890. doi: 10.1016/S0006-3495(02)73952-0. [DOI] [PMC free article] [PubMed] [Google Scholar]
- Katayama N, Huang S-M, Tomita T, Brading AF. Effects of cromakalim on the electrical slow wave in the circular muscle of guinea-pig gastric antrum. Br J Pharmacol. 1993;109:1097–1100. doi: 10.1111/j.1476-5381.1993.tb13735.x. [DOI] [PMC free article] [PubMed] [Google Scholar]
- Katayama N, Nakayama S, Tomita T. Extracellular recording of electrical activity in the circular muscle of guinea-pig stomach. Jpn J Physiol. 1990;40:747. [Google Scholar]
- Koch KL. Electrogastrography: physiological basis and clinical application in diabetic gastropathy. Diabetes Technol Ther. 2001;3:51–62. doi: 10.1089/152091501750220019. [DOI] [PubMed] [Google Scholar]
- Liu H-N, Ohya S, Furuzono S, Wang J, Imaizumi Y, Nakayama S. Co-contribution of IP3R and Ca2+ influx pathways to pacemaker Ca2+ activity in stomach ICC. J Biol Rhythm. 2005a;20:15–26. doi: 10.1177/0748730404269572. [DOI] [PubMed] [Google Scholar]
- Liu H-N, Ohya S, Wang J, Imaizumi Y, Nakayama S. Involvement of ryanodine receptors in pacemaker Ca2+ oscillation in murine gastric ICC. Biochem Biophys Res Commun. 2005b;328:640–646. doi: 10.1016/j.bbrc.2005.01.029. [DOI] [PubMed] [Google Scholar]
- Maeda H, Yamagata A, Nishikawa S, Yoshinaga K, Kobayashi S, Nishi K, Nishikawa S-I. Requirement of c-kit for development of intestinal pacemaker system. Development. 1992;116:369–375. doi: 10.1242/dev.116.2.369. [DOI] [PubMed] [Google Scholar]
- Nakamura W, Honma S, Shirakawa T, Honma K. Clock mutation lengthens the circadian period without damping rhythms in individual SCN neurons. Nat Neurosci. 2002;5:399–400. doi: 10.1038/nn843. [DOI] [PubMed] [Google Scholar]
- Nakamura K, Kuraoka A, Kawabuchi M, Shibata Y. Specific localization of gap junction protein, connexin 45, in the deep muscular plexus of dog and rat small intestine. Cell Tissue Res. 1998;292:487–494. doi: 10.1007/s004410051077. [DOI] [PubMed] [Google Scholar]
- Nakayama S, Katayama N, Tomita T. Slow waves in the circular muscle of guinea-pig stomach recorded with internally perfused glass pipettes. Jpn J Physiol. 1990;40:748. [Google Scholar]
- Nakayama S, Ohya S, Liu H-N, Watanabe T, Furuzono S, Wang J, Nishizawa Y, Aoyama M, Murase N, Matsubara T, Ito Y, Imaizumi Y, Kajioka S. Sulphonylurea receptors differently modulate ICC pacemaker Ca2+ activity and smooth muscle contractility. J Cell Sci. 2005;118:4163–4173. doi: 10.1242/jcs.02540. [DOI] [PubMed] [Google Scholar]
- Oka H, Shimono K, Ogawa R, Sugihara H, Taketani M. A new planar multielectrode array for extracellular recording: application to hippocampal acute slice. J Neurosci Meth. 1999;93:61–67. doi: 10.1016/s0165-0270(99)00113-2. [DOI] [PubMed] [Google Scholar]
- Publicover NG, Sanders KM. Are relaxation oscillators an appropriate model of gastrointestinal electrical activity? Am J Physiol Gastrointest Liver Physiol. 1989;256:G265–G274. doi: 10.1152/ajpgi.1989.256.2.G265. [DOI] [PubMed] [Google Scholar]
- Rumessen JJ, Vandervinden J-M. Interstitial cells in the musculature of the gastrointestinal tract: Cajal and beyond. Int Rev Cytol. 2003;229:115–208. doi: 10.1016/s0074-7696(03)29004-5. [DOI] [PubMed] [Google Scholar]
- Shimono K, Brucher F, Granger R, Lynch G, Taketani M. Origins and distribution of cholinergically induced β rhythms in hippocampal slices. J Neurosci. 2000;20:8462–8473. doi: 10.1523/JNEUROSCI.20-22-08462.2000. [DOI] [PMC free article] [PubMed] [Google Scholar]
- Sperelakis N, Daniel EE. Activation of intestinal smooth muscle cells by interstitial cells of Cajal in simulation studies. Am J Physiol Gastrointest Liver Physiol. 2004;286:G234–G243. doi: 10.1152/ajpgi.00301.2003. [DOI] [PubMed] [Google Scholar]
- Strege PR, Ou Y, Sha L, Rich A, Gibbons SJ, Szurszewski JH, Sarr MG, Farrugia G. Sodium current in human intestinal interstitial cells of Cajal. Am J Physiol Gastrointest Liver Physiol. 2003;285:G1111–G1121. doi: 10.1152/ajpgi.00152.2003. [DOI] [PubMed] [Google Scholar]
- Suzuki T, Won KJ, Horiguchi K, Kinoshita K, Hori M, Torihashi S, Momotani E, Itoh K, Hirayama K, Ward SM, Sanders KM, Ozaki H. Muscularis inflammation and the loss of interstitial cells of Cajal in the endothelin ETB receptor null rat. Am J Physiol Gastrointest Liver Physiol. 2004;287:G638–G646. doi: 10.1152/ajpgi.00077.2004. [DOI] [PubMed] [Google Scholar]
- Szurszewski JH. Electrical basis for gastrointestinal motility. In: Johnson LR, editor. Physiology of the Gastrointestinal Tract. 2. New York: Raven Press; 1987. pp. 383–422. [Google Scholar]
- Takaki M. Gut pacemaker cells: The interstitial cells of Cajal. J Smooth Muscle Res. 2003;39:137–161. doi: 10.1540/jsmr.39.137. [DOI] [PubMed] [Google Scholar]
- Tokutomi N, Maeda H, Tokutomi Y, Sato D, Sugita M, Nishikawa S, Nishikawa S, Nakao J, Imamura T, Nishi K. Rhythmic Cl− current and physiological roles of the intestinal c-kit-positive cells. Pflugers Arch. 1995;431:169–177. doi: 10.1007/BF00410188. [DOI] [PubMed] [Google Scholar]
- Tomita T. Electrical activity (spikes and slow waves) in gastrointestinal smooth muscle. In: Bülbring E, Brading AF, Jones AW, Tomita T, editors. Smooth Muscle: an Assessment of Current Knowledge. London: Edward Arnold; 1981. pp. 127–156. [Google Scholar]
- Torihashi S, Fujimoto T, Trost C, Nakayama S. Calcium oscillation linked to pacemaking of interstitial cells of Cajal. J Biol Chem. 2002;277:19191–19197. doi: 10.1074/jbc.M201728200. [DOI] [PubMed] [Google Scholar]
- Vanderwinden JM, Liu H, De Laet MH, Vanderhaeghen JJ. Study of the interstitial cells of Cajal in infantile hypertrophic pyloric stenosis. Gastroenterology. 1996;111:279–288. doi: 10.1053/gast.1996.v111.pm8690192. [DOI] [PubMed] [Google Scholar]
- Vanderwinden JM, Rumessen JJ. Interstitial cells of Cajal in human gut and gastrointestinal disease. Microsc Res Tech. 1999;47:344–360. doi: 10.1002/(SICI)1097-0029(19991201)47:5<344::AID-JEMT6>3.0.CO;2-1. [DOI] [PubMed] [Google Scholar]
- van Helden DF, Imtiaz MS. Ca2+ phase waves: a basis for cellular pacemaking and long-range synchronicity in the guinea-pig gastric pylorus. J Physiol. 2003;548:271–296. doi: 10.1113/jphysiol.2002.033720. [DOI] [PMC free article] [PubMed] [Google Scholar]
- Walker RL, Koh SD, Sergeant GP, Sanders KM, Horowitz B. TRPC4 currents have properties similar to the pacemaker current in interstitial cells of Cajal. Am J Physiol Cell Physiol. 2002;283:C1637–C1645. doi: 10.1152/ajpcell.00266.2002. [DOI] [PubMed] [Google Scholar]
- Wang XY, Berezin I, Mikkelsen HB, Der T, Bercik P, Collins SM, Huizinga JD. Pathology of interstitial cells of Cajal in relation to inflammation revealed by ultrastructure but not immunohistochemistry. Am J Pathol. 2002;160:1529–1540. doi: 10.1016/s0002-9440(10)62579-5. [DOI] [PMC free article] [PubMed] [Google Scholar]
- Wang XY, Lammers WJ, Bercik P, Huizinga JD. Lack of pyloric interstitial cells of Cajal explains distinct peristaltic motor. Am J Physiol Gastrointest Liver Physiol. 2005;289:G539–G549. doi: 10.1152/ajpgi.00046.2005. [DOI] [PubMed] [Google Scholar]
- Yamazawa T, Iino M. Simultaneous imaging of Ca2+ signals in interstitial cells of Cajal and longitudinal smooth muscle cells during rhythmic activity in mouse ileum. J Physiol. 2002;538:823–835. doi: 10.1113/jphysiol.2001.013045. [DOI] [PMC free article] [PubMed] [Google Scholar]
Associated Data
This section collects any data citations, data availability statements, or supplementary materials included in this article.
Supplementary Materials
Histological examinations in two recording regions A and B in the same preparation used in Fig. 3
The field potentials recorded at Ch. 14 in the same stomach muscle preparation used in Fig. 3, are shown expanded
An example of spontaneous electrical activity recorded using an array of 8 × 8 microelectrodes
Field potential movie corresponding to the spontaneous electrical activities shown in Figs 6 and 7;
Field potential movie corresponding to Fig. 8A;
Field potential movie corresponding to Fig. 8B.


