

Abstract
Maintaining a low extracellular glutamate concentration in the central nervous system is important for terminating synaptic transmission and preventing excitotoxic cell death. The stoichiometry of the most abundant glutamate transporter, GLT-1, predicts that a very low glutamate concentration, ∼2 nm, should be reached in the absence of glutamate release, yet microdialysis measurements give a value of ∼1 μm. If other glutamate transporters had a different stoichiometry, the predicted minimum glutamate concentration could be higher, for example if those transporters were driven by the cotransport of 2 Na+ (rather than of 3 Na+ as for GLT-1). Here we investigated the ionic stoichiometry of the glutamate transporter GLAST, which is the major glutamate transporter expressed in the retina and cerebellum, is expressed in other adult brain areas at a lower level than GLT-1, and is present throughout the brain early in development when expression of GLT-1 is low. Glutamate transport by GLAST was found to be driven, as for GLT-1, by the cotransport of 3 Na+ and 1 H+ and the counter-transport of 1 K+, suggesting that the minimum extracellular glutamate concentration should be similar during development and in the adult brain. A less powerful accumulation of glutamate by GLAST than by GLT-1 cannot be used to explain the high glutamate concentration measured by microdialysis.
Glial glutamate uptake lowers the extracellular concentration of glutamate following synaptic activity. Transport of glutamate across glial membranes is mediated by specific transporters powered by the electrochemical gradients of cotransported ions. Previously it has been shown that the most abundant glutamate transporter, GLT-1, which is present in glial cells, cotransports 3 Na+ and 1 H+ and counter-transports 1 K+ ion. This ionic stoichiometry yields a system capable of reducing the extracellular glutamate concentration to ∼2 nm in the absence of glutamate release (Levy et al. 1998). Although GLT-1 is the most abundant transporter in the brain, some areas contain relatively little GLT-1, expressing instead the glutamate transporter GLAST (Lehre et al. 1995; Haugeto et al. 1996). Areas where GLAST is the major transporter include the cerebellar cortex (Lehre & Danbolt, 1998), the inner ear (Furness & Lehre, 1997; Takumi et al. 1997), the circumventricular organs (Berger & Hediger, 2000) and the retina (Derouiche & Rauen, 1995; Lehre et al. 1997; Pow & Barnett, 1999), as well as the CNS in general early in development (Ullensvang et al. 1997). However, although GLAST shares many of the properties of GLT-1, such as cotransport of Na+ (Brew & Attwell, 1987; Storck et al. 1992), counter-transport of K+ (Amato et al. 1994) and transport of a pH changing ion (Bouvier et al. 1992), and can generate an anion flux that is not thermodynamically coupled to glutamate movement (Billups et al. 1996), its precise ionic stoichiometry remains unknown.
The stoichiometry of GLAST is important because the power of transporters to accumulate glutamate is determined by the number and identity of their cotransported ions. If GLAST had less accumulative power than GLT-1, the baseline extracellular glutamate would be expected to be higher than is predicted from the GLT-1 stoichiometry. High-affinity glutamate receptors may be activated by the baseline extracellular glutamate concentration (Cavelier et al. 2005), and hence if a difference in stoichiometry existed it would have implications for information processing in those parts of the brain expressing mainly GLAST. In addition, excitotoxic damage might occur more easily. More positively, release of glutamate by reversed uptake (Szatkowski et al. 1990) would occur more readily if the GLAST stoichiometry was less accumulative, and could be important in controlling early development of the CNS (LoTurco et al. 1995).
Whereas predictions of the minimum possible extracellular glutamate concentration based on the GLT-1 transporter stoichiometry give a very low value of ∼2 nm, measurements using microdialysis give a value of ∼1 μm (Cavelier et al. 2005), which would tonically activate NMDA receptors if present in vivo. Although this high value might reflect damage caused by microdialysis (Westergren et al. 1995; Cavelier et al. 2005), some of this discrepancy could be explained if GLAST differed from GLT-1 in its stoichiometry.
In salamander retinal Müller cells, most glutamate-induced current is caused by GLAST transporters (also known as sEAAT1: Eliasof et al. 1998b). Using whole-cell patch clamping and the specific blocker dl-threo-beta-benzyloxyaspartate (TBOA) to determine the reversal potential of GLAST at different extracellular concentrations of the driving ions, we determine the ionic stoichiometry of the GLAST glutamate transporter.
Methods
Retinal dissociation
The experiments conformed to UK animal use legislation. Immediately after tiger salamanders (Ambystoma tigrinum) were killed, the back half of the eye was removed and kept in external solution (lacking Ba2+ ions) for a maximum of 2 days at 4°C. Retinae were removed and Müller cells obtained by dissociation with papain as described by Brew & Attwell (1987).
Whole-cell patch clamping
Müller cells were whole-cell patch clamped to monitor glutamate transport as a membrane current (Brew & Attwell, 1987), using pipettes with a series resistance of ∼6 MΩ. All data shown have been corrected for the junction potential between the electrode and the bath solution. When using Cl−-free solutions, a 4 m NaCl agar bridge was used to connect the bath to a silver chloride earth pellet, and the solution in the electrode was connected to a silver chloride pellet through a short length of internal solution (in the pipette holder) containing 116 mm Cl−.
For experiments assessing the effect of TBOA on forward glutamate uptake, glutamate was applied to cells in solution containing (mm): sodium gluconate 105, potassium gluconate 2.5, calcium gluconate 3, MgCl2 0.5, glucose 15, Hepes 5 and BaCl2 6 (to block the inward rectifier K+ conductance of the cells); pH adjusted to 7.4 with NaOH, and the pipette solution contained (mm): potassium gluconate 98, sodium gluconate 10, K2EGTA 5, MgATP 5, NaCl 5, Hepes 5 and CaCl2 1; pH adjusted to 7.0 with KOH. To study the effect of extracellular TBOA on reversed uptake, the external solution contained (mm): sodium gluconate 80, N-methyl-d-glucamine (NMDG) gluconate or potassium gluconate 30 (reversed uptake was activated by raising [K+]o from 0 to 30 mm: Szatkowski et al. 1990), Hepes 5, calcium gluconate 3, MgCl2 0.5, glucose 15, BaCl2 6 and ouabain 0.1 (to block the Na+–K+ pump and therefore prevent K+-evoked currents); pH adjusted to 7.4 with NaOH, and the internal solution contained (mm): sodium glutamate, 10; sodium gluconate, 10; NMDG gluconate 83, NMDG2-EGTA 5, Hepes 5, CaCl2 1, MgCl2 2 and MgATP 5; pH adjusted to 7.2 with NMDG.
For experiments investigating the reversal potential of the transport-associated current, the internal and external solutions lacked Cl− ions to abolish currents generated by the anion conductance of the transporter (Wadiche et al. 1995). With l-glutamate, Na+, K+ and H+ present on both sides of the membrane, the direction of transport at different voltages was assessed by blocking transporter action (cf. Zerangue & Kavanaugh, 1996; Levy et al. 1998) with the non-transported blocker TBOA (Shimamoto et al. 1998). The reversal potential for the TBOA-blocked current is determined by the transporter stoichiometry, as described in the Results.
The standard internal solution used to measure the transporter reversal potential contained (mm): NMDG glutamate 20, sodium acetate 12, sodium gluconate 8, NMDG gluconate 3, potassium gluconate 50, magnesium gluconate 2, calcium gluconate 1, Hepes 20, NMDG2-EGTA 5 and MgATP 5; pH adjusted to 7.4 with NMDG. The standard external solution contained (mm): NMDG glutamate 0.2, sodium gluconate 55, NMDG gluconate 8.3, potassium gluconate 25, magnesium gluconate 0.5, calcium gluconate 3, Hepes 20, glucose 15, barium acetate 6 and ouabain 0.1; pH adjusted to 7.4 with NMDG. Having determined the reversal potential with these solutions, we then measured the shift in reversal potential when the [Na+]o was reduced by 36% (replaced by NMDG), the [glutamate]o was increased 5-fold, or the [K+]o was decreased 2.5-fold (replaced by NMDG).
We also wished to test the effect of raising [H+]o by 2.5-fold, but when [H+] is raised it reacts with the barium acetate to form acetic acid, which can cross the cell membrane and lower the internal pH. We therefore modified the external solutions in such a way that when the [H+] was raised 2.5-fold (changing from pH 7.4 to pH 7.0) the acetate concentration was reduced by a factor of 2.5, so that the same concentration of acetic acid would be present in the external solution. To make this possible, the acetate concentration had to be raised in the pH 7.4 solution: the 55 mm sodium gluconate in the standard external solution was replaced by 37 mm sodium gluconate and 18 mm sodium acetate (for the pH 7.0 solution, 55 mm sodium gluconate was used). Thus, when the pH is changed from 7.4 to 7.0, the acetate concentration decreases 2.5-fold from 30 mm (from the sodium acetate and barium acetate) to 12 mm (from the barium acetate). In addition, in the internal solution the 50 mm potassium gluconate (in the standard internal solution above) was replaced by 32 mm potassium gluconate and 18 mm potassium acetate, so that the amount of acetic acid, present was the same as in the external solution, abolishing any potential movement of acetic acid, across the membrane.
Data analysis
Data are presented as means ± s.e.m. Statistical P values are from two-tailed t tests.
Results
External TBOA blocks both forward and reversed uptake
Salamander Müller cells may express several glutamate transporters (salamander GLAST/EAAT1, GLT-1/EAAT2 and EAAT5: Eliasof et al. 1998b) and also exhibit a glutamate-evoked suppression of the resting K+ conductance via a metabotropic receptor (Schwartz, 1993). In our experiments, the K+ conductance was blocked by external Ba2+ ions (Newman, 1993). The very weak sensitivity of the Müller cell transporter-mediated current to the GLT-1/EAAT2 blocker dihydrokainate (Barbour et al. 1991) implies that GLT-1 contributes less than 15% of the glutamate-evoked current (the reduction of uptake current seen by Barbour et al. (1991) may reflect a weak inhibitory action of dihydrokainate on GLAST activity; indeed, in Müller cells from mice with GLAST knocked out, glutamate evokes no measurable transporter current Sarthy et al. 2005). Furthermore, the Müller cell glutamate transporter exhibits only a small Cl− conductance (Billups et al. 1996), with Cl− removal altering the glutamate- or aspartate-evoked current at negative potentials by a fraction similar to that seen for cloned human GLAST/EAAT1 transporters (Wadiche & Kavanaugh, 1998), whereas for EAAT5 the Cl− current is at least 20-fold larger than the transport-associated current (Eliasof & Jahr, 1996; Arriza et al. 1997). Thus, the Müller cell transporter current is dominated by the activity of GLAST transporters (Eliasof et al. 1998b).
In the experiments described below, measuring the reversal potential of the transporter, we have all the substrates (glutamate−, Na+, K+ and H+) present on both sides of the membrane. At negative membrane potentials the transporter will move glutamate in, generating an inward current, which is produced by an excess of positive charge moving with each negatively charged glutamate (Brew & Attwell, 1987). Blocking the transporter with TBOA should thus generate an outward current. At positive potentials the transporter will carry glutamate out and TBOA should generate an inward current. As a prelude to these experiments it was essential to show that external TBOA blocks both forward and reversed operation of the salamander GLAST transporter. It was also essential to demonstrate that TBOA generates no current in the absence of internal and external glutamate, because that would imply either that TBOA is transported instead of glutamate (but see Shimamoto et al. 1998) or that there is a leak of ions through the transporter that is not directly coupled to glutamate transport (Vandenberg et al. 1995) which TBOA binding alters. Either of these possibilities would imply that the reversal potential of the current evoked by TBOA would not be the true reversal potential of the transporter.
As shown in Fig. 1A, we evoked forward glutamate uptake by applying 30 or 100 μm external glutamate, using an internal solution that lacks glutamate. This results in an inward current at −65 mV that is larger for 100 μm than for 30 μm glutamate, in accordance with the uptake current dose–response curve measured previously (Brew & Attwell, 1987). Applying 300 μm TBOA evoked no significant current on its own (0.05 ± 0.20 pA in six cells) showing that there is no significant ion leak that is modulated by TBOA (it is possible that the ion leak reported by Vandenberg et al. (1995) reflects an altered permeability of the oocyte membrane in response to transporter expression (Tzounopoulos et al. 1995; Sha et al. 2001)). However, TBOA greatly reduced the uptake current, by a larger fraction for 30 μm glutamate (reduced to 3.5 ± 0.3% of the control current) than for 100 μm glutamate (reduced to 6.0 ± 0.2% of control), reflecting the competitive action of this blocker (Shimamoto et al. 1998).
Figure 1. Effect of TBOA on forward and reversed uptake currents mediated by GLAST transporters in Müller cells.

A, inward current evoked by glutamate uptake at −65 mV (comprising both transport-associated current and some current mediated by Cl− flux through the anion conductance of the transporter) is reversibly inhibited by 300 μm TBOA, and TBOA itself induces no current change. B, outward current evoked by raising [K+]o around a cell clamped with an electrode containing glutamate, to evoke reversed uptake, is also blocked by TBOA (and to a lesser extent by 300 μm glutamate).
The effect of external TBOA on reversed uptake was tested by evoking reversed uptake by raising [K+]o around cells clamped with an internal solution containing glutamate. This activated an outward current of 114 ± 3 pA in six cells (Fig. 1B) reflecting reversed operation of GLAST transporters (Szatkowski et al. 1990). TBOA evoked a small inward current in the absence of external K+ (−4.6 ± 0.3 pA) probably reflecting the block of a small amount of reversed uptake activated by external Na+ (because the K+ transport site is not highly selective (Barbour et al. 1991)), and completely abolished the outward current evoked by a rise of [K+]o, leaving a small inward K+-evoked current (−3.2 ± 1.0 pA) that presumably reflects K+ influx through the fraction of the K+ channels that remain unblocked by Ba2+. TBOA blocked the reversed uptake current more effectively than 300 μm external glutamate (raising [K+]o evoked an outward current of 21.0 ± 2.9 pA in the presence of glutamate; Fig. 1B).
Theoretical prediction of the transporter reversal potential
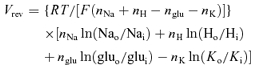
The reversal potential (Vrev) for the transporter is determined by the ionic stoichiometry of the transporter (Zerangue & Kavanaugh, 1996):
 |
(1) |
where nNa, nH, nglu and nK are the number of Na+, H+, glu− and K+ ions, respectively, moving on each carrier cycle, Nao and Nai, Ho and Hi, gluo and glui, and Ko and Ki, are the concentrations of Na+, H+, glu− and K+, outside and inside the cell, respectively, R is the gas constant, T is the temperature and F is the Faraday constant.
This equation can only be used if all of the current change produced by TBOA is due to block of ion movements coupled to glutamate translocation. In general, GLAST transporters can generate a current either by the cotransport or counter-transport of ions with glutamate, or from Cl− movement through an anion conductance which is activated when the transporter operates (Wadiche et al. 1995; Billups et al. 1996). In the following experiments, therefore, we used solutions lacking Cl− (replaced by gluconate; see Methods) to abolish any contribution from the anion conductance activated by the transporter. Thus, TBOA only blocks charge movements coupled to glutamate translocation and the reversal potential of the TBOA-evoked current can be equated to that of the glutamate translocation part of the transporter.
Effect of substrate concentration changes on the reversal potential
The reversal potential predicted by eqn (1) is determined partly by the numbers of cotransport and counter-transported ions, but also partly by the substrate concentrations on each side of the membrane. Although the external substrate concentrations are well controlled by the superfusion solution, the internal concentrations may vary somewhat from the values in the whole-cell pipette depending on the value of series resistance (which correlates inversely with the diffusive access to the cell interior). A more accurate way to determine the stoichiometry of the transporter is to measure the change of reversal potential occurring when the concentration of one of the external substrates is altered. From eqn (1), the predicted change in reversal potential when [Na+]o is changed from value [Na+]o1 to [Na+]o2 is:
 |
(2) |
which does not depend on the internal concentrations. Similarly, the predicted change in reversal potential when [H+]o is changed from value [H+]o1 to [H+]o2 is
 |
(3) |
the predicted change in reversal potential when [K+]o is changed from value [K+]o1 to [K+]o2 is:
 |
(4) |
and the predicted change when [glu−]o is changed from value [glu−]o1 to [glu−]o2 is
 |
(5) |
Measured values of the transporter reversal potential
Figure 2A shows current changes at different voltages, resulting from the application of 100 μm TBOA to a cell studied with our standard intracellular and extracellular solutions containing glutamate, Na+ and K+ which allow both forward glutamate transport (at negative potentials) and reversed glutamate transport (at positive potentials). At negative potentials, TBOA evokes an outward current shift, whereas at positive potentials it evokes an inward shift, as each of these transport modes is suppressed. The mean reversal potential, at which there is no net transport, measured in 26 cells from current–voltage (I–V) plots of the TBOA-blocked current as in Fig. 3A (i.e. plotted with the opposite sign to the TBOA-evoked current), was −10.1 ± 0.6 mV. For comparison, for the ionic conditions used, eqn (1) predicts a reversal potential of −11.1 or − 47.9 mV for 3 Na+ or 2 Na+ being cotransported, respectively, with 1 H+ and 1 glu−, and with 1 K+ being counter-transported (predictions for some other possible stoichiometries are given in Table 1). Thus, the reversal potential observed is consistent with nNa = 3, and nglu = nK = nH = 1 (P values for comparisons of the experimental measurements with the theoretical predictions of these and other possible stoichiometries are given in Table 1).
Figure 2. Specimen data showing the determination of the reversal potential for GLAST glutamate transporters.

A, current changes evoked by 100 μm TBOA with the standard internal and external medium lacking Cl−, and containing all the transporter substrates, including 55 mm[Na+]o. At positive membrane potentials TBOA suppresses an outward current associated with reversed uptake; at negative voltages it suppresses an inward current associated with forward uptake. The reversal potential of the transporter is close to −12 mV. B, as in A, but with 35 mm[Na+]o. The reversal potential is now close to −27 mV.
Figure 3. Current–voltage (I–V) relation of the current blocked by TBOA at different holding potential in different conditions.

Each panel shows an I–V relation in control conditions (•), a subsequent I–V relation obtained with the concentration of one external substrate altered (^), and then another control I–V relation (▴). The substrates altered were: Na+ (A); H+ (B); K+ (C); and glutamate− (D).
Table 1.
Comparison of experimental and theoretical reversal potentials
| Control Vrev | ΔVrev(Δ[Na]o) | ΔVrev(Δ[H]o) | ΔVrev(Δ[K]o) | ΔVrev(Δ[glu]o) | |
|---|---|---|---|---|---|
| Data | −10.1 ± 0.6 (n= 26) | −16.6 ± 0.7 (n= 6) | +9.9 ± 1.1 (n= 7) | +9.8 ± 2.0 (n= 7) | +18.3 ± 1.7 (n= 6) |
| Predictions | |||||
| 3 Na+, H+, glu−/K+ | −11.1 (P= 0.11) | −17.2 (P= 0.48) | +11.7 (P= 0.16) | +11.6 (P= 0.38) | +20.4 (P= 0.26) |
| 2 Na+, H+, glu−/K+ | −47.9 (P= 6.6 × 10⁻²⁹) | −22.9 (P= 3.4 × 10⁻⁴) | +23.3 (P= 1.9 × 10⁻⁵) | +23.2 (P= 4.7 × 10⁻⁴) | +40.8 (P= 4.4 × 10⁻⁵) |
| 2 Na+, 2 H+, glu−/K+ | −23.9 (P= 3.3 × 10⁻¹⁸) | −11.5 (P= 8.6 × 10⁻⁴) | +23.3 (P= 1.9 × 10⁻⁵) | +11.6 (P= 0.38) | +20.4 (P= 0.26) |
| 3 Na+, H+, glu−/0K+ | −13.3 (P= 2.2 × 10⁻⁵) | −11.5 (P= 8.6 × 10⁻⁴) | +7.8 (P= 0.10) | +0.0 (P= 2.5 × 10⁻³) | +13.6 (P= 0.04) |
| 3 Na+, 2 H+, glu−/0K+ | −10.0 (P= 0.81) | −8.6 (P= 1.1 × 10⁻⁴) | +11.7 (P= 0.16) | +0.0 (P= 2.5 × 10⁻³) | +10.2 (P= 5.2 × 10⁻³) |
| 3 Na+, 2 H+, glu−/K+ | −7.4 (P= 1.6 × 10⁻⁴) | −11.5 (P= 8.6 × 10⁻⁴) | +15.6 (P= 2.2 × 10⁻³) | +7.7 (P= 0.34) | +13.6 (P= 0.04) |
| 4 Na+, H+, glu−/K+ | +1.1 (P= 4.4 × 10⁻¹⁶) | −15.3 (P= 0.12) | +7.8 (P= 0.10) | +7.7 (P= 0.34) | +13.6 (P= 0.04) |
| 4 Na+, 2H+, glu−/K+ | +0.9 (P= 8.0 × 10⁻¹⁶) | −11.5 (P= 8.6 × 10⁻⁴) | +11.7 (P= 0.16) | +5.8 (P= 0.09) | +10.2 (P= 5.2 × 10⁻³) |
Control reversal potential (Vrev) and shifts in reversal potential (ΔVrev) when altering substrate concentrations are given in mV. Experimental data are in the top row of the table (±s.e.m., number of cells in brackets) and theoretically deduced values for eight different stoichiometries are given in the subsequent rows. For the stoichiometries in the left column, the ions before the slash are co-transported with glutamate, while the K+ after the slash is counter-transported. Probability values from two-tailed t tests assessing whether the theoretical value is significantly different from the experimental value are given in brackets.
Effect of substrate concentration changes on the reversal potential
From eqn (2), the predicted change in reversal potential when [Na+]o is changed from our standard value of 55 mm, to 35 mm, is −17.2 or −22.9 mV, respectively, if 3 or 2 Na+ are cotransported and nglu = nK = nH = 1. Figure 2B shows specimen data, and Fig. 3A shows the change of I–V relation (and associated reversal potential) for the TBOA-blocked current when [Na+]o was lowered in this way. To determine accurately the shift of reversal potential, in each cell we measured the I–V relation initially in control solution, then in low [Na+]o, and then in control solution again, and took the difference between the value in low [Na+]o and the average of the two control values. On average, lowering [Na+]o shifted the reversal potential negative by 16.6 ± 0.7 mV in seven cells, consistent with nNa = 3, and nglu = nK = nH = 1 (other possibilities are assessed in Table 1 and discussed below).
From eqn (3), the predicted change in reversal potential when [H+]o is changed from the control value of 40 nm (pH 7.4), to 100 nm (pH 7), is +11.7 or +23.3 mV, respectively, if 3 or 2 Na+ are cotransported and nglu = nK = nH = 1. Figure 3B shows specimen I–V relations for the TBOA-blocked current in a cell studied with these two values of [H+]o. Changing the external pH shifted the reversal potential positive by 9.9 ± 1.1 mV in seven cells, consistent with nNa = 3, and nglu = nK = nH = 1.
Nagaraja & Brookes (1996) reported that applying 0.1 μm HgCl2 led to a change of stoichiometry of the glutamate transporters expressed in cultured astrocytes (which are thought to be GLAST transporters in the absence of neurons to induce GLT-1 expression: Schlag et al. 1998; Zelenaia et al. 2000; Poulsen et al. 2006), such that the transporters no longer generated a pH change in the cells. This suggests that the transporters stop transporting H+ in the presence of HgCl2, and implies that there should no longer be a change of reversal potential when raising [H+]o from 40 to 100 nm. Experimentally, however, the reversal potential shifted in the positive direction by 9.6 ± 0.5 mV in five cells in the presence of 0.1 μm HgCl2, not significantly different (P = 0.85) to the shift occurring when no HgCl2 was present. This shift is inconsistent with the possibility that no H+ are transported (the shift is highly significantly different to 0 mV, P = 2.8 × 10⁻⁵). Thus, mercury does not change the coupling of glutamate transport to H+ movement in salamander GLAST transporters.
From eqn (4), the predicted change in reversal potential when [K+]o is changed from the control value of 25 mm, to 10 mm, is 11.6 or 23.2 mV, respectively, if 3 or 2 Na+ are cotransported and nglu = nK = nH = 1. Figure 3C shows specimen I–V relations for the TBOA-blocked current in a cell studied with these two values of [K+]o. Changing [K+]o shifted the reversal potential in the positive direction by 9.8 ± 2.0 mV in seven cells, consistent with nNa = 3, and nglu = nK = nH = 1.
From eqn (5), the predicted change in reversal potential when [glu−]o is changed from our standard value of 0.2 mm, to 1 mm, is 20.4 or 40.8 mV, respectively, if 3 or 2 Na+ are cotransported and nglu = nK = nH = 1. Figure 3D shows specimen I–V relations for the TBOA-blocked current in a cell studied with these two values of [glu−]o. Raising the external glutamate concentration shifted the reversal potential in the positive diection by 18.3 ± 1.7 mV in six cells, consistent with nNa = 3, and nglu = nK = nH = 1.
Estimation of the stoichiometry of GLAST
Table 1 summarizes the experimentally observed reversal potential of the TBOA-blocked current in the control external solution, and the shifts in reversal potential evoked by altering the external sodium, proton, potassium and glutamate concentrations. It also summarizes the theoretical predictions for these parameters of several possible transporter stoichiometries, together with P values for t tests comparing the experimental data with the prediction of each stoichiometry.
Comparing the data first with the predictions for nNa = 3 or 2 sodium ions cotransported, assuming that nglu = nK = nH = 1, it is clear that the reversal potential in control solution, and the reversal potential shifts produced by altering each of the four transported species, are all consistent with nNa = 3 and completely inconsistent with nNa = 2.
We then considered whether other possible stoichiometries might be consistent with the data. All possible stoichiometries were considered which had: (i) the sum of the number of Na+ and of H+ transported ≤6 (going up to such large numbers was considered justified because GLT-1 is thought to operate as a trimer (Haugeto et al. 1996; Yernool et al. 2004; Gendreau et al. 2004) and conceivably several ions could bind to each trimer); (ii) at least 1 Na+ and 1 glu− transported (for consistency with radiotracing data); and (iii) a net positive charge moving into the cell with glutamate (as seen electrophysiologically). These constraints led us to consider 175 possible stoichiometries, which were narrowed down to those shown in Table 1 as follows. We used the average values measured for the reversal potential in the control external solution, and for the four shifts of reversal potential measured when altering in turn the external concentration of sodium, protons, potassium and glutamate. For each of these five measurements, we computed the absolute value of the difference between the theoretical prediction and the experimental value, and then averaged this over the five measurements, to crudely assess the relative likelihood that a particular theoretical stoichiometry might be consistent with the data. When this average ‘error’ was less than 6 mV, which narrowed the search down to six possible stoichiometries (other than nNa = 2 or 3, nglu = nK = nH = 1), Student's two-tailed t test was used to assess the probability of each measurement being consistent with the theoretical prediction. These P values are shown in Table 1.
Some stoichiometries (other than nNa = 3, nH= 1, nK = 1 and nglu = 1) could predict certain individual values close to the observed values, but none of them predicted accurately both the control reversal potential and all four reversal potential shifts produced by altering the ion gradients. For example, for the postulated stoichiometry nNa = 4, nH= 2, nK = 1, nglu = 1, the predictions are reasonable for the reversal potential shifts produced by altering [H+]o and [K+]o, but much less good for the control reversal potential and the shifts produced by altering [Na+]o and [glu−]o. The two stoichiometries (other than nNa = 3, nH = 1, nK = 1, nglu = 1) which minimized the differences between the observed and predicted values were (i) nNa = 3, nH = 2, nK = 1, nglu = 1, and (ii) nNa = 4, nH = 1, nK = 1, nglu = 1. For each of these, however, and for other stoichiometries with predictions that were slightly further from the data, t tests comparing the observed and predicted values ruled them out as plausible stoichiometries (Table 1). We conclude that all predictions, other than for a stoichiometry nNa = 3, nH = 1, nK = 1, nglu = 1, are significantly different from our data.
Discussion
By using the nontransported blocker of glutamate transporters, TBOA, to block forward and reversed operation of GLAST transporters in salamander retinal Müller cells, we have measured the reversal potential of the transporter with various concentrations of substrate present. Comparing our results with theoretical predictions for a range of transporter stoichiometries, we conclude that the stoichiometry of GLAST is the same as that found previously for the less expressed neuronal transporter EAAT3 and for the major glial transporter GLT-1 (Zerangue & Kavanaugh, 1996; Levy et al. 1998). Each glutamate anion is transported into the cell with 3 Na+ ions and one H+, while one K+ is transported in the opposite direction. The power of GLAST to accumulate glutamate is therefore the same as that of EAAT3 and GLT-1. Although these experiments have been carried out on salamander retinal Müller cells, it seems likely that mammalian GLAST transporters, which have an amino acid sequence that is 92% homologous to that of the salamander transporter (Eliasof et al. 1998a), will have the same ionic stoichiometry.
Our results imply that, in areas expressing GLAST as the predominant glutamate transporter, notably the retina, the molecular layer of the cerebellum, and perhaps all of the CNS early in development (see Introduction), the minimum extracellular glutamate concentration that the transporters will be able to produce in the absence of glutamate release will be the same (∼2 nm) as that which can be maintained in brain areas where GLT-1 is the dominant transporter. Consequently, the relatively high level of extracellular glutamate found in the CNS in microdialysis experiments (∼1 μm: Cavelier & Attwell, 2005) cannot be attributed to GLAST transporters having a lower accumulative power than GLT-1 transporters (so that in an area where both were expressed, GLAST would be releasing glutamate while GLT-1 accumulates it). Instead the high resting value of [glu]o must reflect either a high rate of glutamate release which prevents the transporters pumping [glu]o down to the thermodynamic equilibrium value which is predicted by the transporter stoichiometry, or leakage of glutamate from the blood into the extracellular space as a result of damage caused by the microdialysis technique (Westergren et al. 1995).
The fact that the glutamate accumulative power is identical for GLAST and for the other major glial glutamate transporter GLT-1 raises the question of why two distinct transporters have evolved. A likely explanation relates to the regulation of expression of these transporters by the presence of neurons. GLAST is expressed early in development whereas GLT-1 appears only in the second postnatal week (Ullensvang et al. 1997). Having one transporter type (GLAST) that is constitutively expressed, and another (GLT-1) that is up-regulated by factors released by neurons (Schlag et al. 1998; Zelenaia et al. 2000; Poulsen et al. 2006) would confer on the nervous system maintenance of a low extracellular glutamate concentration from early in development together with the flexibility to provide more glutamate accumul-ation when neurons start to release glutamate as a transmitter.
Acknowledgments
This work was supported by the Wellcome Trust, a Wolfson-Royal Society award, and the Norwegian Research Council.
References
- Amato A, Barbour B, Szatkowski M, Attwell D. Counter-transport of potassium by the glutamate uptake carrier in glial cells isolated from the tiger salamander retina. J Physiol. 1994;479:371–380. doi: 10.1113/jphysiol.1994.sp020302. [DOI] [PMC free article] [PubMed] [Google Scholar]
- Arriza JL, Eliasof S, Kavanaugh MP, Amara SG. Excitatory amino acid transporter 5, a retinal glutamate transporter coupled to a chloride conductance. Proc Natl Acad Sci U S A. 1997;94:4155–4160. doi: 10.1073/pnas.94.8.4155. [DOI] [PMC free article] [PubMed] [Google Scholar]
- Barbour B, Brew H, Attwell D. Electrogenic uptake of glutamate and aspartate into glial cells isolated from the salamander (Ambystoma) retina. J Physiol. 1991;436:169–193. doi: 10.1113/jphysiol.1991.sp018545. [DOI] [PMC free article] [PubMed] [Google Scholar]
- Berger UV, Hediger MA. Distribution of the glutamate transporters GLAST and GLT-1 in rat circumventricular organs, meninges, and dorsal root ganglia. J Comp Neurol. 2000;421:385–399. doi: 10.1002/(sici)1096-9861(20000605)421:3<385::aid-cne7>3.0.co;2-s. [DOI] [PubMed] [Google Scholar]
- Billups B, Rossi D, Attwell D. Anion conductance behavior of the glutamate uptake carrier in salamander retinal glial cells. J Neurosci. 1996;16:6722–6731. doi: 10.1523/JNEUROSCI.16-21-06722.1996. [DOI] [PMC free article] [PubMed] [Google Scholar]
- Bouvier M, Szatkowski M, Amato A, Attwell D. The glial cell glutamate uptake carrier countertransports pH-changing anions. Nature. 1992;360:471–474. doi: 10.1038/360471a0. [DOI] [PubMed] [Google Scholar]
- Brew H, Attwell D. Electrogenic glutamate uptake is a major current carrier in the membrane of axolotl retinal glial cells. Nature. 1987;327:707–709. doi: 10.1038/327707a0. [DOI] [PubMed] [Google Scholar]
- Cavelier P, Attwell D. Tonic release of glutamate by a DIDS-sensitive mechanism in rat hippocampal slices. J Physiol. 2005;564:397–410. doi: 10.1113/jphysiol.2004.082131. [DOI] [PMC free article] [PubMed] [Google Scholar]
- Cavelier P, Hamann M, Rossi D, Mobbs P, Attwell D. Tonic excitation and inhibition of neurons: ambient transmitter sources and computational consequences. Prog Biophys Mol Biol. 2005;87:3–16. doi: 10.1016/j.pbiomolbio.2004.06.001. [DOI] [PMC free article] [PubMed] [Google Scholar]
- Derouiche A, Rauen T. Coincidence of L-glutamate/L-aspartate transporter (GLAST) and glutamine synthetase (GS) immunoreactions in retinal glia: evidence for coupling of GLAST and GS in transmitter clearance. J Neurosci Res. 1995;42:131–143. doi: 10.1002/jnr.490420115. [DOI] [PubMed] [Google Scholar]
- Eliasof S, Arriza JL, Leighton BH, Amara SG, Kavanaugh MP. Localization and function of five glutamate transporters cloned from the salamander retina. Vision Res. 1998a;38:1443–1454. doi: 10.1016/s0042-6989(97)00452-5. [DOI] [PubMed] [Google Scholar]
- Eliasof S, Arriza JL, Leighton BH, Kavanaugh MP, Amara SG. Excitatory amino acid transporters of the salamander retina: identification, localization, and function. J Neurosci. 1998b;18:698–712. doi: 10.1523/JNEUROSCI.18-02-00698.1998. [DOI] [PMC free article] [PubMed] [Google Scholar]
- Eliasof S, Jahr CE. Retinal glial cell glutamate transporter is coupled to an anionic conductance. Proc Natl Acad Sci U S A. 1996;93:4153–4158. doi: 10.1073/pnas.93.9.4153. [DOI] [PMC free article] [PubMed] [Google Scholar]
- Furness DN, Lehre KP. Immunocytochemical localization of a high-affinity glutamate-aspartate transporter, GLAST, in the rat and guinea-pig cochlea. Eur J Neurosci. 1997;9:1961–1969. doi: 10.1111/j.1460-9568.1997.tb00763.x. [DOI] [PubMed] [Google Scholar]
- Gendreau S, Voswinkel S, Torres-Salazar D, Lang N, Heidtmann H, Detro-Dassen S, Schmalzing G, Hidalgo P, Fahlke C. A trimeric quaternary structure is conserved in bacterial and human glutamate transporters. J Biol Chem. 2004;279:39505–39512. doi: 10.1074/jbc.M408038200. [DOI] [PubMed] [Google Scholar]
- Haugeto Ø, Ullensvang K, Levy LM, Chaudhry FA, Honore T, Nielsen M, Lehre KP, Danbolt NC. Brain glutamate transporter proteins form homomultimers. J Biol Chem. 1996;271:27715–27722. doi: 10.1074/jbc.271.44.27715. [DOI] [PubMed] [Google Scholar]
- Lehre KP, Danbolt NC. The number of glutamate transporter subtype molecules at glutamatergic synapses: chemical and stereological quantification in young adult rat brain. J Neurosci. 1998;18:8751–8757. doi: 10.1523/JNEUROSCI.18-21-08751.1998. [DOI] [PMC free article] [PubMed] [Google Scholar]
- Lehre KP, Davanger S, Danbolt NC. Localization of the glutamate transporter protein GLAST in rat retina. Brain Res. 1997;744:129–137. doi: 10.1016/s0006-8993(96)01022-0. [DOI] [PubMed] [Google Scholar]
- Lehre KP, Levy LM, Ottersen OP, Storm-Mathisen J, Danbolt NC. Differential expression of two glial glutamate transporters in the rat brain: quantitative and immunocytochemical observations. J Neurosci. 1995;15:1835–1853. doi: 10.1523/JNEUROSCI.15-03-01835.1995. [DOI] [PMC free article] [PubMed] [Google Scholar]
- Levy LM, Attwell D, Hoover F, Ash JF, Bjoras M, Danbolt NC. Inducible expression of the GLT-1 glutamate transporter in a CHO cell line selected for low endogenous glutamate uptake. FEBS Lett. 1998;422:339–342. doi: 10.1016/s0014-5793(98)00036-2. [DOI] [PubMed] [Google Scholar]
- LoTurco JJ, Owens DF, Heath MJ, Davis MB, Kriegstein AR. GABA and glutamate depolarize cortical progenitor cells and inhibit DNA synthesis. Neuron. 1995;15:1287–1298. doi: 10.1016/0896-6273(95)90008-x. [DOI] [PubMed] [Google Scholar]
- Nagaraja TN, Brookes N. Mercuric chloride uncouples glutamate uptake from the countertransport of hydroxyl equivalents. Am J Physiol Cell Physiol. 1996;271:C1487–C1493. doi: 10.1152/ajpcell.1996.271.5.C1487. [DOI] [PubMed] [Google Scholar]
- Newman EA. Inward-rectifying potassium channels in retinal glial (Muller) cells. J Neurosci. 1993;8:3333–3345. doi: 10.1523/JNEUROSCI.13-08-03333.1993. [DOI] [PMC free article] [PubMed] [Google Scholar]
- Poulsen CF, Schousboe I, Sarup A, White HS, Schousboe A. Effect of topiramate and dBcAMP on expression of the glutamate transporters GLAST and GLT-1 in astrocytes cultured separately, or together with neurons. Neurochem Int. 2006;48:657–661. doi: 10.1016/j.neuint.2006.01.006. [DOI] [PubMed] [Google Scholar]
- Pow DV, Barnett NL. Changing patterns of spatial buffering of glutamate in developing rat retinae are mediated by the Müller cell glutamate transporter GLAST. Cell Tissue Res. 1999;297:57–66. doi: 10.1007/s004410051333. [DOI] [PubMed] [Google Scholar]
- Sarthy VP, Pignatoro L, Pannicke T, Weick M, Reichenbach A, Harada T, Tanaka K, Marc R. Glutamate transport by retinal Müller cells in glutamate/aspartate transporter-knockout mice. Glia. 2005;49:184–196. doi: 10.1002/glia.20097. [DOI] [PubMed] [Google Scholar]
- Schlag BD, Vondrasek JR, Munir M, Kalandadze A, Zelenaia OA, Rothstein JD, Robinson MB. Regulation of the glial Na+-dependent glutamate transporters by cyclic AMP analogs and neurons. Mol Pharmacol. 1998;53:355–369. doi: 10.1124/mol.53.3.355. [DOI] [PubMed] [Google Scholar]
- Schwartz EA. L-glutamate conditionally modulates the K+ current of Müller glial cells. Neuron. 1993;10:1141–1149. doi: 10.1016/0896-6273(93)90062-v. [DOI] [PubMed] [Google Scholar]
- Sha Q, Lansbery KL, Distefano D, Mercer RW, Nichols CG. Heterologous expression of the Na+,K+-ATPase gamma subunit in Xenopus oocytes induces an endogenous, voltage-gated large diameter pore. J Physiol. 2001;535:407–417. doi: 10.1111/j.1469-7793.2001.t01-1-00407.x. [DOI] [PMC free article] [PubMed] [Google Scholar]
- Shimamoto K, Lebrun B, Yasuda-Kamatani Y, Sakaitani M, Shigeri Y, Yumoto N, Nakajima T. DL-threo-beta-benzyloxyaspartate, a potent blocker of excitatory amino acid transporters. Mol Pharmacol. 1998;53:195–201. doi: 10.1124/mol.53.2.195. [DOI] [PubMed] [Google Scholar]
- Storck T, Schulte S, Hofmann K, Stoffel W. Structure, expression, and functional analysis of a Na+-dependent glutamate/aspartate transporter from rat brain. Proc Natl Acad Sci U S A. 1992;89:10955–10959. doi: 10.1073/pnas.89.22.10955. [DOI] [PMC free article] [PubMed] [Google Scholar]
- Szatkowski M, Barbour B, Attwell D. Non-vesicular release of glutamate from glial cells by reversed electrogenic glutamate uptake. Nature. 1990;348:443–446. doi: 10.1038/348443a0. [DOI] [PubMed] [Google Scholar]
- Takumi Y, Matsubara A, Danbolt NC, Laake JH, Storm-Mathisen J, Usami S, Shinkawa H, Ottersen OP. Discrete cellular and subcellular localization of glutamine synthetase and the glutamate transporter GLAST in the rat vestibular end organ. Neuroscience. 1997;79:1137–1144. doi: 10.1016/s0306-4522(97)00025-0. [DOI] [PubMed] [Google Scholar]
- Tzounopoulos T, Maylie J, Adelman JP. Induction of endogenous channels by high levels of heterologous membrane proteins in Xenopus oocyte. Biophys J. 1995;69:904–908. doi: 10.1016/S0006-3495(95)79964-7. [DOI] [PMC free article] [PubMed] [Google Scholar]
- Ullensvang K, Lehre KP, Storm-Mathisen J, Danbolt NC. Differential developmental expression of the two rat brain glutamate transporter proteins GLAST and GLT. Eur J Neurosci. 1997;9:1646–1655. doi: 10.1111/j.1460-9568.1997.tb01522.x. [DOI] [PubMed] [Google Scholar]
- Vandenberg RJ, Arriza JL, Amara SG, Kavanaugh MP. Constitutive ion fluxes and substrate binding domains of human glutamate transporters. J Biol Chem. 1995;270:17668–17671. doi: 10.1074/jbc.270.30.17668. [DOI] [PubMed] [Google Scholar]
- Wadiche JI, Amara SG, Kavanaugh MP. Ion fluxes associated with excitatory amino acid transport. Neuron. 1995;15:721–728. doi: 10.1016/0896-6273(95)90159-0. [DOI] [PubMed] [Google Scholar]
- Wadiche JI, Kavanaugh MP. Macroscopic and microscopic properties of a cloned glutamate transporter/chloride channel. J Neurosci. 1998;18:7650–7661. doi: 10.1523/JNEUROSCI.18-19-07650.1998. [DOI] [PMC free article] [PubMed] [Google Scholar]
- Westergren L, Nystrom B, Hamberger A, Johansson BB. Intracerebral dialysis and the blood brain barrier. J Neurochem. 1995;64:229–234. doi: 10.1046/j.1471-4159.1995.64010229.x. [DOI] [PubMed] [Google Scholar]
- Yernool D, Boudker O, Jin Y, Gouaux E. Structure of a glutamate transporter homologue from Pyrococcus horikoshii. Nature. 2004;431:811–818. doi: 10.1038/nature03018. [DOI] [PubMed] [Google Scholar]
- Zelenaia OA, Schlag BD, Gochenauer GE, Ganel R, Song W, Beesley JS, et al. Epidermal growth factor receptor agonists increase expression of glutamate transporter GLT-1 in astrocytes through pathways dependent on phosphatidylinositol 3-kinase and transcription factor NF-kappa B. Mol Pharmacol. 2000;57:667–678. doi: 10.1124/mol.57.4.667. [DOI] [PubMed] [Google Scholar]
- Zerangue N, Kavanaugh MP. Flux coupling in a neuronal glutamate transporter. Nature. 1996;383:634–637. doi: 10.1038/383634a0. [DOI] [PubMed] [Google Scholar]