Abstract
Crystal growth mechanisms are crucial to understanding the complexity of crystal morphologies in nature and advanced technological materials, such as the faceting and dendrites found in snowflakes and the microstructure and associated strength properties of structural and icy planetary materials. In this article, we present observations of pressure-induced ice VI crystal growth, which have been predicted theoretically, but had never been observed experimentally to our knowledge. Under modulated pressure conditions in a dynamic-diamond anvil cell, rough single ice VI crystal initially grows into well defined octahedral crystal facets. However, as the compression rate increases, the crystal surface dramatically changes from rough to facet, and from convex to concave because of a surface instability, and thereby the growth rate suddenly increases by an order of magnitude. Depending on the compression rate, this discontinuous jump in crystal growth rate or “shock crystal growth” eventually produces 2D carpet-type fractal morphology, and moreover dendrites form under sinusoidal compression, whose crystal morphologies are remarkably similar to those predicted in theoretical simulations under a temperature gradient field. The observed strong dependence of the growth mechanism on compression rate, therefore, suggests a different approach to developing a comprehensive understanding of crystal growth dynamics.
Keywords: dynamic–diamond anvil cell
Crystal morphology and microstructure of ice strongly alter rheological properties of solids and, thus, affect the dynamics and evolution of many water-rich solid bodies in the solar system such as Earth crest, Pluto, Titan, and comets. Crystal growth also exhibits many interesting phenomena such as roughening–faceting transitions (1–3), surface instabilities (4), and fractal and dendritic growth (4, 5). There have been extensive studies (1–6) of the faceting and dendritic shapes of crystals, which represent, respectively, the simplest and the most complex morphologies, and play significant roles in pattern formation, metallurgy, and biology. The two morphologies have been explained by interface- and diffusion-controlled growth, i.e., atomic or molecular attachment kinetics across the interface between liquids and crystals for the former and diffusion of heat or mass for the latter. Growth mechanisms, however, are not very well understood yet, even in the case of simple facet growth, for example, the faceting and surface instability in two dimensions depending on cooling rate or concentration rate (1, 2), and abnormal growth and protrusion at crystal corners and edges (1–3, 7–9).
Facet growth has been explained by a geometric model (7) that describes the interface motion of crystals by the shape and position of the crystal surface because of the slow kinetics of atomic or molecular attachment. Interestingly, the geometric model predicts discontinuous behavior of crystal growth on faceting, called shock that forms when two or more facets or edges meet at the same position at the same time. However, such shock growth has never been experimentally observed to our knowledge, which may suggest two possibilities: (i) that the geometrical model has some shortcomings or (ii) that experimental studies may not have achieved the conditions necessary to observe shock growth. A difficulty of thermally driven crystal growth experiments is the intrinsic time-scale limitation imposed by diffusion of mass and thermal conductivities, restricting the range of environments for crystal growth. In contrast, if one can achieve precise, fast, and repeatable pressure control, pressure-driven crystal growth can overcome these limitations; the pressure conditions are transmitted more rapidly, there is a more homogeneous variation of physical and chemical environment, and there is no significant gravitational convection, which has been recognized as an issue in recent thermally and chemically driven crystallization studies (3, 10–13).
Results and Discussion
Exploiting the pressure-induced crystallization, we used an instrument called the dynamic diamond anvil cell (d-DAC) to apply a variety of compression rates to water samples and study the detailed rate dependence of the ice-VI crystallization process. The d-DAC has been described in detail (14). In this article, we report the pressure-induced shock growth and dendrite formation of ice VI under dynamic compression.
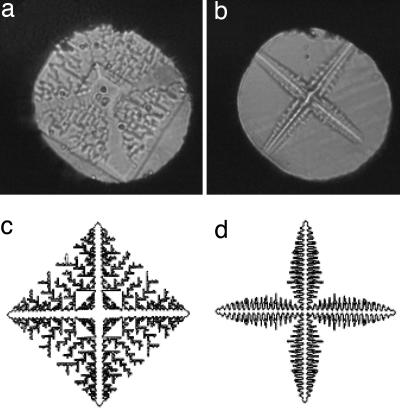
This pressure modulation capability (see Materials and Methods) has lead to a wide range of rich and complicated observations. Fig. 1 a and b shows images of a beautiful 4-fold symmetric dendritic crystal of ice VI induced by sinusoidal load variation. The detailed crystal morphology, dendritic arms, and fractal-like interstitial region alters substantially depending on the frequency and amplitude of the applied external compression. In this particular case, we used a sinusoidal signal to produce the morphologies remarkably similar to those found by Family et al. (15) in a temperature gradient at a constant pressure, which are shown in Fig. 1 c and d [supporting information (SI) Movie 1].
Fig. 1.
Microphotographic images of pressure-induced dendritic crystals (a) and (b) and the simulated patterns of temperature-driven dendritic crystal growth (c and d) by Family et al. (15), showing a remarkable similarity. Sample gasket diameter: 160 μm.
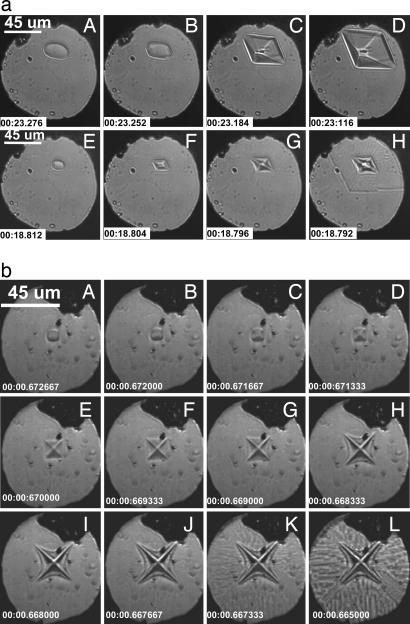
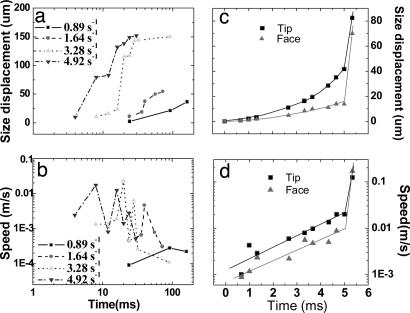
For a detailed understanding of the effect of the compression rate on crystal growth, we present a systematic study of pressure-induced crystal growth with constant and varying compression rates. Fig. 2 shows image sequences of crystal growth during compression taken by a high-speed camera (Ultima APX-RS; Photron, San Diego, CA). As shown in Fig. 2a A–D, using a relatively slow smooth ramping compression rate [or strain rate, defined by the movement of piezocrystals (Δl/l)/Δt, below 0.89 s−1 (see Materials and Methods)], we observe that a small ice VI crystal surrounded by liquid water at 0.9 GPa and 20°C grows into well defined octahedral facets, indicating interface-controlled crystal growth (3, 7, 9), which is governed by atomic or molecular attachment kinetics caused by the chemical energy difference of the two phases. However, at higher strain (or compression) rates (at least ≥1.64 s−1), the crystal surface becomes faceted and concaved (see Fig. 2a F and G), and then the growth rate abruptly jumps by an order of magnitude within 4 ms of the beginning of the compression (see Fig. 2aH and Fig. 3a).
Fig. 2.
High-speed optical microscope images of ice VI crystal in d-DAC. (a) Sequence of the crystal growth under trapezoidal compression (see Fig. 4). The images (A–H) were obtained at the ramping times (or the compression rates) 550 ms (0.89 s−1) and 150 ms (3.28 s−1), with the piezo input pulses (I and III) in Fig. 4. The recording rate of the camera was 250 frames per s with a 1,024 × 1,024-pixel resolution. Ruby chips are indicated by small black spots. The corresponding changes in crystal size and growth speed appear in Fig. 3 a and b. (b) Dendritic ice VI in d-DAC, showing the sequence of crystal growth in response to sinusoidal compression [28 Hz; average (Δl/l)/Δt = 136.13 s−1]. The recording rate was 3,000 frames per s with 1,024 × 1,024 pixels. The corresponding changes in crystal size and growth speed appear in Fig. 3 c and d.
Fig. 3.
Size displacements and growth speeds of the ice VI crystal at the constant strain rates of 0.89, 1.64, 3.28, and 4.92 s−1 (a and b) and at the sinusoidal varying compression rate of 136.13 s−1 in average (c and d). The data were obtained by measuring the major and minor lengths across the diamond-shaped crystal in Fig. 2a or the tip and face of dendritic crystal in Fig. 2b. Note that there is a sudden jump in the crystal growth rate or shock crystal growth (see text) to the maximum growth speed of ≈0.17 m/s in d, for example. The solid lines in c and d serve to guide the eye. This growth speed should be considered as a lower bound, because the surface advanced across the entire sample chamber within one framing period of the camera (333 μs), the shortest time scale of our measurements.
With a fast sinusoidal compression waveform with an average strain rate of 136.13 s−1, the crystal morphology of ice VI further changes to a distinctive dendritic shape shown in Fig. 2b. The surface of the crystal becomes faceted and further evolves to form negative curvatures, indicating a surface instability (4), and the corners of the crystal become the principle branches of the dendrite (Fig. 2b E–H). Interestingly, there is again a sudden jump in the growth rate as the concave crystal surface deepens (Fig. 2b J and K). Note, however, that the morphology outside of the dendrite is no longer dendritic, but fractal-like (carpet shape) (Fig. 2b K and L). By shifting the camera focus, it is confirmed that this growth is not nucleated by the surfaces of diamond or container gasket, but from the crystal surfaces. Based on the Raman characteristics, we confirm that both dendritic and fractal parts are made of ice VI. Fig. 3b quantitatively summarizes the changes in the crystal growth showing the sudden increase of growth rate by more than an order of magnitude.
Observations presented in this study raise several important questions: why and how does this sudden growth occur in two dimensions from 3D crystal? How does the dendrite form with a varying compression rate, but not with a constant compression rate? What is the effect of compression rate on the crystal growth? Although these questions may not be all answered based on known crystal growth mechanisms, we note that several aspects are consistent with the known geometric model (7–9). In both crystal growths shown in Fig. 2, the sudden crystal growth occurs after a sequence of morphology changes, i.e., from rough to faceted, to concave surfaces, and to the sudden rapid growth. The sudden rapid growth with the sequence is consistent with shock growth predicted in the geometric model, which is based on interface-controlled growth (7). In particular, the geometric model expects 2D growth when two crystal surfaces of a 3D crystal collide at the same position at the same time, which underlies the 2D shock growth in Fig. 2. Interestingly, the shock growth occurs a few more times, as shown in Fig. 3 a and b, as predicted by recent theoretical study (9).
The most interesting observation in this study is the shock growth of dendrites, because shock crystal growth is predicted to be controlled by the interfacial kinetics (7–9), yet dendritic growth is usually controlled by atomistic/molecular diffusion near the crystal boundary (4) in a thermal or concentration gradient. In addition, the fast growth rate indicates a large driving force. Although pressure is used as the control parameter, one can alternatively view the supercompressed liquid state as an undercooled liquid state. From the thermal perspective, the large driving force may be the result of a deeply undercooled liquid, which is often observed to lead to dendritic growth in pure materials. From this perspective, the liquid water surrounding the ice crystal may undercool by rapid compression before the crystal surface equilibrates. This undercooling is plausible if the compression rate is faster than the extraction rate of latent heat from the crystal surface because of crystallization.
To check this conjecture, we estimated the amount of such undercooling from a comparison of the ice Ih crystal growth speed (16–18) and the Clapeyron relation. Before the shock transition in Fig. 2, the crystal growth rate is ≈0.001 to 0.01 m/s in Fig. 3 a and b, which would correspond to 2.5 to 5 K undercooling of ice Ih at ambient pressure (16–18). In the present work, the measured pressure change during the dynamic modulation, ≈0.04 GPa, gives ≈2.4 K undercooling based on the Claypeyron relation, which is consistent with the level of undercooling of ice Ih (16–18). The shock crystal growth rate reaches ≈0.02 m/s under constant compression, corresponding to an undercooling of ≈8 K, whereas the shock growth rate determined from the image sequence in Fig. 2b exceeds ≈0.17 m/s, corresponding to an extremely large undercooling of ≈24 K at ambient pressure (16, 18). These undercooling values correspond to ≈0.13- and ≈0.4-GPa pressure changes, which are much greater than the measured pressure change of 0.04 GPa (corresponding to ≈2.4 K undercooling). In addition, such shock growth and the dendrite formation occur early in the compression, which implies that the undercooling should be much smaller than the values estimated here. Note that such shock crystal growth occurs in an even slow compression rate (1.64 s−1) and the growth rate increases with compression rate. Therefore, the shock growth rate does not result from deep undercooling, although the effect of undercooling may affect the rate and morphology.
A similar discontinuous crystal growth was observed previously in CCl4 with a growth rate of ≈0.1 μm/s (3), but no shock growth was identified under such a slow growth rate. In the present experiments, the shock growth is apparent, and the growth rate increases as the compression rate increases. These observations imply that sustained shock growth may require a relatively large driving force, although it does not appear to be necessary for the formation of a shock as described in the geometric model, which is based on slow interfacial kinetics caused by a low driving force.
The other interesting observation is the formation of dendritic crystals. Because a crystal surface can be described by the superposition of many wave forms, the crystal surfaces can be perturbed and become dendritic when a periodic external perturbation, in this case sinusoidal pressure, is applied. Although such a possibility has been shown in the regulation of side branches in a given dendrite with periodic pulse laser heating (19) and pressure (20), a dendrite itself has not been able to form by application of an external periodic perturbation to our knowledge. It should be noted that the beautiful 4-fold symmetric dendrite forms only by sinusoidal compression, not constant compression. We also applied a step function compression profile in pressure change giving a high compression rate and thus perhaps large undercooling, but no dendrite formed. Therefore the undercooled environment produced by pressure may help cause surface instability, but is not sufficient to form the 4-fold symmetric dendrite. On the other hand, the coexistence of shock and dendritic growth implies that the growth mechanisms for the two morphologies cross-over with the compression rate. Indeed, we observed that such shock growth disappears when a dendrite fully forms in Fig. 1 (see SI Movie 1). Therefore the rate and type of compression are the determining factors for these phenomena, which is similar to the cooling rate affecting faceting and abnormal protrusion at crystal surfaces and corners, respectively (2).
It is remarkable to note the similarity of our observed pressure-induced dendritic growth and the simulated temperature-driven study (15), despite the entirely different environments (compression versus thermal gradient). We note that our experiment was performed with a dynamic condition as the compression rate increased, which may not be adequately addressed by the classical geometric model (7–9). Therefore, the present study should stimulate further theoretical developments to help understand the formation, evolution, and propagation of shock crystal growth (9) and dendritic growth beyond the geometric model framework. Furthermore, d-DAC technology enables one to measure rheological properties (crystal growth rates, undercooling, diffusivity, etc.) and associated mechanical properties (microstructures, strength, etc.) of geo and planetary materials in a wide range of compression rates and, thus, provides a way to gain insight of the dynamics and evolution of the most ice/rock terrestrial planets, satellites, and comets. In this regard, the 4-fold dendrite presented here may be a good case for studying Martian snowflakes.
Materials and Methods
d-DAC applies a variable load to a cylindrical sample chamber of ≈100–160 μm in diameter and ≈30–50 μm thick. The load on the sample is electronically controlled and thus the sample volume can be changed. The load is provided by a piezo-electric actuator and can be driven by a variable electronic signal from a function generator. For example, the signal, and thus the way of compressing sample, can be a ramp wave, a sinusoid, or a step function. The pressure change with volume manifests phase change on the sample depending on the equation of state. Thus, using the d-DAC in the pressure-volume-temperature regime of a liquid–solid phase transition we are able to rapidly and precisely control crystal growth. See ref. 14 for a detailed description of d-DAC.
To prepare an experiment, a water sample is loaded into the hole of a stainless-steel gasket (diameter of 100–160 μm; thickness of 30–50 μm) between the two diamond anvils (diameter of 300 μm). A few ruby chips are included in the sample chamber for in situ pressure measurement. At a given static equilibrium pressure (0.9 GPa) at 20°C, by carefully adjusting the load on the piezo actuator adapted to this diamond anvil cell, an ice VI single crystal forms that is identified by its Raman spectrum. This ice VI crystal in the d-DAC sample chamber is then de/compressed with sinusoidal and trapezoidal loading drives (Fig. 4). During the pressure cycling, the ice crystal grows or recedes (melts) in phase with the de/compression drive signal. Using optical choppers to time-resolved Raman (ruby fluorescence) method, we measure the range of variation of the pressure during the de/compression to be ≈0.04 GPa. The contrast in index between the liquid and crystal is striking and the crystal growth is easily imaged and recorded during the de/compression by using a high-speed digital camera (16-bit grayscale; 1,024 × 1,024; Photron) at capture rates of 250 and 3,000 frames per s. In general, because no pressure change is expected during the crystal growth in the two-phase region (liquid/solid), the compression rate cannot be easily measured systematically with time. Therefore, instead of compression rate, we estimated the strain rate from the length change of piezoactuator as the control parameter [i.e., (Δl/l)/Δt, where l and t are total displacement of the piezo actuator (18 μm) and time, respectively].
Fig. 4.
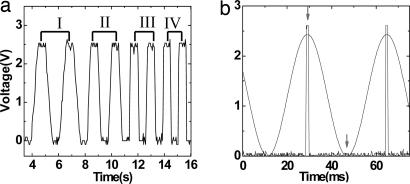
Applied voltage profiles used to modulate cell volume. (a) Trapezoidal signals showing different pair of ramping rates. The ramping times are 550 ms [(Δl/l)/Δt = 0.89 s−1] (I), 300 ms (1.64 s−1) (II), 150 ms (3.28 s−1) (III), and 100 ms (4.92 s−1) (IV). (b) Sinusoidal signal with 28 Hz [average (Δl/l)/Δt = 136.13 s−1]. The maximum and minimum pressures are measured at the places marked by arrows for a 1-ms (square slit) opening time with a dual chopper.
Supplementary Material
Acknowledgments
The work has been supported by the Lawrence Livermore National Laboratory, University of California, under the auspices of the U.S. Department of Energy under Contract W-7405-ENG-48.
Abbreviation
- d-DAC
dynamic diamond anvil cell.
Footnotes
The authors declare no conflict of interest.
This article is a PNAS Direct Submission.
This article contains supporting information online at www.pnas.org/cgi/content/full/0609390104/DC1.
References
- 1.Berge B, Faucheux L, Schwab K, Libchaber A. Nature. 1991;350:322–324. [Google Scholar]
- 2.Flesselles JM, Magnasco MO, Libchaber A. Phys Rev Lett. 1991;67:2489–2492. doi: 10.1103/PhysRevLett.67.2489. [DOI] [PubMed] [Google Scholar]
- 3.Maruyama M, Kuribayashi N, Kawabata K, Wettlaufer JS. Phys Rev Lett. 2000;85:2545–2548. doi: 10.1103/PhysRevLett.85.2545. [DOI] [PubMed] [Google Scholar]
- 4.Langer JS. Rev Mod Phys. 1980;52:1–28. [Google Scholar]
- 5.Brune H, Romainczyk C, Roder H, Kern K. Nature. 1994;369:469–471. [Google Scholar]
- 6.Liu XY, Bennema P, Vandereerden JP. Nature. 1992;356:778–780. [Google Scholar]
- 7.Taylor JE, Cahn JW, Handwerker CA. Acta Metall Mater. 1992;40:1443–1474. [Google Scholar]
- 8.Wettlaufer JS, Jackson M, Elbaum M. J Phys A Math Gen. 1994;27:5957–5967. [Google Scholar]
- 9.Tsemekhman V, Wettlaufer JS. Stud Appl Math. 2003;110:221–256. [Google Scholar]
- 10.Kar P, LaCombe JC, Koss MB. Mater Sci Tech. 2004;20:1273–1280. [Google Scholar]
- 11.Koss MB, LaCombe JC, Chait A, Pines V, Zlatkowski M, Glicksman ME, Kar P. J Crystal Growth. 2005;279:170–185. [Google Scholar]
- 12.Sawada T, Takemura K, Shigematsu K, Yoda S, Kawasaki K. J Crystal Growth. 1996;158:328–335. [Google Scholar]
- 13.Sekhar JA, Rajasekharan T. Nature. 1986;320:153–155. [Google Scholar]
- 14.Lee GW, Evans WJ, Yoo CS. Phys Rev B. 2006;74:134112. [Google Scholar]
- 15.Family F, Platt DE, Vicsek T. J Phys A Math Gen. 1987;20:L1177–L1183. [Google Scholar]
- 16.Lu YJ, Xie WJ, Wei BB. Chin Phys Lett. 2002;19:1543–1546. [Google Scholar]
- 17.Ohsaka K, Trinh EH. J Crystal Growth. 1998;194:138–142. [Google Scholar]
- 18.Shibkov AA, Zheltov MA, Korolev AA, Kazakov AA, Leonov AA. J Crystal Growth. 2005;285:215–227. [Google Scholar]
- 19.Qian XW, Cummins HZ. Phys Rev Lett. 1990;64:3038–3041. doi: 10.1103/PhysRevLett.64.3038. [DOI] [PubMed] [Google Scholar]
- 20.Borzsonyi T, Toth-Katona T, Buka A, Granasy L. Phys Rev Lett. 1999;83:2853–2856. [Google Scholar]
Associated Data
This section collects any data citations, data availability statements, or supplementary materials included in this article.


