Abstract
Our ability to interpret seismic observations including the seismic discontinuities and the density and velocity profiles in the earth's interior is critically dependent on the accuracy of pressure measurements up to 364 GPa at high temperature. Pressure scales based on the reduced shock-wave equations of state alone may predict pressure variations up to 7% in the megabar pressure range at room temperature and even higher percentage at high temperature, leading to large uncertainties in understanding the nature of the seismic discontinuities and chemical composition of the earth's interior. Here, we report compression data of gold (Au), platinum (Pt), the NaCl-B2 phase, and solid neon (Ne) at 300 K and high temperatures up to megabar pressures. Combined with existing experimental data, the compression data were used to establish internally consistent thermal equations of state of Au, Pt, NaCl-B2, and solid Ne. The internally consistent pressure scales provide a tractable, accurate baseline for comparing high pressure–temperature experimental data with theoretical calculations and the seismic observations, thereby advancing our understanding fundamental high-pressure phenomena and the chemistry and physics of the earth's interior.
Keywords: diamond–anvil cell, high–pressure research, pressure calibration, thermodynamics, x–ray diffraction
The earth has a layered internal structure with distinct boundaries. The boundaries of the five main layers (the upper mantle, the transition zone, the lower mantle, the liquid outer core, and the solid inner core) are well defined by the observed seismic velocity discontinuities at depths of 400, 670, 2,891, and 5,149 km (corresponding to pressures of 13.4, 23.8, 135.8, and 328.9 GPa, respectively) in a global average preliminary reference earth model (PREM) (1). The interpretation of these discontinuities requires experimental investigations of earth materials at high pressure and temperature. The seismic discontinuities near 400 and 670 km depth are commonly associated with the mineralogical phase transformations of (Mg,Fe)2SiO4 from α-olivine to β-phase (wadsleyite) and from γ-spinel (ringwoodite) to (Mg,Fe)SiO3-perovskite plus (Mg,Fe)O-magnesiowüstite, respectively (2). With the rapid increase in the use of broadband seismometers and seismic arrays, seismologists have been able to determine the depths of the 400- and 670-km discontinuities and their lateral variation with increasingly finer resolutions (3). To correlate the observed seismic variability with the compositional and thermal variations in the mantle, we have to be able to determine mantle phase transitions with high accuracy, better than 1% in pressure determination (i.e., ±0.25 GPa at 25 GPa). Similarly, it is critically dependent on the accuracy in pressure determination whether or not the recently discovered postperovskite transition (4, 5) indeed occurs at the base of the lower mantle and accounts for a number of seismic anomalies observed in the D″ region. Because the D″ layer is observed in a narrow depth interval, corresponding to pressures from 127 to 136 GPa, pressure uncertainties greater than 7% in experiments would have placed the transition boundary entirely outside the D″ layer.
Accurate determination of pressure is also important for understanding the composition and temperature of the earth's core and fundamental high-pressure phenomena through comparison of theoretical and experimental results. At a practical level, internally consistent pressure scales are critical for comparisons of high-pressure results produced in different laboratories by using different experimental and analytical techniques. Recently, studies of the equation of state of iron at core pressures (6–8) illustrated the importance of pressure determination in the multimegabar pressure range (up to 300 GPa): The use of different pressure scales could lead to significantly different estimates of the density deficit in the inner core, thereby different inference of its chemistry.
Recent advances in synchrotron radiation and high-pressure techniques have significantly increased the capacity for acquiring high-quality experimental data over a wide pressure–temperature (P-T) range. With a high volume of high-pressure experimental data output from synchrotron facilities, there is an urgent need to establish reliable practical and absolute pressure scales. The ruby luminescent pressure gauge has been adopted as a practical pressure scale for pressure determination in a diamond-anvil cell at room temperature. The Mao ruby scale (9) has been widely used for pressure determination under hydrostatic conditions. The scale was calibrated up to 80 GPa by using reduced shock-wave equations of state of Cu and Ag, proposed by Carter et al. (10). There are increasing evidences that the Mao ruby scale underestimates pressures, particularly above 40 GPa, based on a comparison of recent x-ray diffraction data for metal standards such as Au, Pt, Ta, W, Cu, and Al with their reduced shock-wave equations of state (11, 12) and the equation of state of diamond (13–16). A recent study on pressure calibration by combining the available shock-wave, ultrasonic, x-ray diffraction, and thermochemical data for a number of pressure standards comes to a similar conclusion (17).
Much of the discrepancy in the ruby scale can be traced back to the lack of internal consistency among different metal pressure scales based on the reduced shock-wave equations of state of the metal standards. It has been demonstrated that different pressure standards which were subjected the same pressure condition predict significantly different pressures, based on their reduced shock-wave equations of state (11). Similar discrepancy was documented in multianvil experiments under simultaneous high P-T conditions (18). Platinum (Pt) and gold (Au) are widely used as internal pressure standards in in situ x-ray diffraction measurements at high pressure because of their intense diffraction peaks, low chemical reactivity, and high crystal symmetry. Recent x-ray diffraction data (11) indicate that the pressure derived from Holmes Pt scale is ≈7% higher than that from some of the commonly used Au scales (19–21) at 100 GPa and ambient temperature. The discrepancy is even larger when the Au scales of Shim et al. (22) and Fei et al. (18) were used, whose room temperature equation of state was based on the x-ray diffraction data of Takemura (23).
The discrepancy between the Au and Pt scales at room temperature is the main source of uncertainty in establishing the ruby scale (11) and in comparisons of experimental data using Au or Pt as the internal calibrant. It also contributes to the uncertainties in determining the thermal equations of state of Au and Pt, which are widely used to determine pressures at high temperature. In this study, we report experimental data on Au and Pt as pressure calibrants and propose internally consistent P-V-T thermal equations of state of Au and Pt. In addition, we report in situ x-ray diffraction measurements of neon (Ne) and NaCl up to megabar pressures at room temperature and high temperature. Having analyzed our experimental data and crosschecked them with other pressure scales, we propose two Ne and NaCl-B2 pressure scales that are consistent with the Pt and Au pressure scales and the ruby pressure gauge as well. These pressure scales will significantly improve pressure determination at room and high temperatures and provide an internally consistent high-pressure database.
Results and Discussion
The validity of the Au pressure scale proposed by Anderson et al. (19) was questioned because the postspinel phase transition boundary determined by using the Anderson Au scale occurs at a pressure corresponding to a depth that is much shallower than the 660-km seismic discontinuity in the earth's mantle (24–26). Several recent studies (17, 22, 26–29) reevaluated the P-V-T equation of state of Au based on the existing experimental data and theoretical calculations. One noticeable difference among these Au scales is the equation of state at reference temperature (300 K). The reported pressure derivative of bulk modulus (K′0 = dK0/dP) varies from 5.0 to 6.2 with a fixed bulk modulus (K0) of 167 GPa (11), leading to very large uncertainty in pressure determination at high pressure. The recent x-ray diffraction data on Au in He pressure medium by Takemura (23) and Dewaele et al. (11), based on the ruby scale of Mao et al. (9), yielded K′0 values of 5.0 and 5.5, respectively, by fitting the data to a third-order Birch–Murnaghan equation of state,
 |
Several recently proposed ruby scales (11, 14–17, 30) converge to a scale based on the W reduced shock-wave equation of state (11), which predicts pressures ≈4% higher than the widely used Mao ruby scale at 100 GPa. When using the new ruby scale of Dewaele et al. (11), the best-fitted K′0 value is 5.77 for the data set of Dewaele et al. (11). It is worth emphasizing that the bulk modulus and its pressure derivative in the Birch–Murnaghan equation of state are not interchangeable with those in the Vinet equation of state (31) used more commonly in the high-pressure physics community. The same data set of Dewaele et al. (11) yields a K′0 value of 6.0 with K0 = 167 GPa, by fitting the data to the Vinet equation of state,
 |
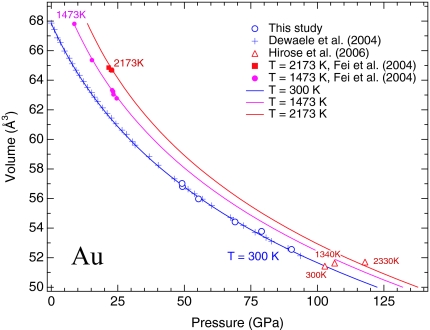
We obtained x-ray diffraction data on Au in Ne pressure medium with laser-heating annealing up to 89 GPa. The data are shown in Fig. 1, together with the data of Dewaele et al. (11). The two data sets are in excellent agreement, reproduced by Vinet equation of state with K0 = 167 GPa and K′0 = 6.0 (Table 1). The pressures in this study were calculated from the new ruby scale of Dewaele et al. (11) that produces more consistent results in comparison with other pressure scales. Fig. 1 also shows the x-ray diffraction data of Au from Hirose et al. (32) with pressures determined by using the MgO scale of Speziale et al. (33). The room temperature datum plots right on the best-fitted compression curve (Fig. 1).
Fig. 1.
Calculated isothermal compression curves of Au at 300, 1,473, and 2,173 K, compared with experimental data. The 300-K data of this study (open circles) and Dewaele et al. (11) (crosses) are based on the ruby scale of Dewaele et al. (11), where the 300-K datum of Hirose et al. (32) (open triangle) is based on the MgO scale of Speziale et al. (33). The pressures of the high-temperature data at 1,473 K (filled circles) (18), 2,173 K (filled squares) (18), and 1,340 and 2,330 K (open triangles) (32) are calculated from the MgO scale of Speziale et al. (33).
Table 1.
Model parameters for the equations of state of NaCl-B2, Solid Ne, Au, and Pt
| Parameters | NaCl-B2* | Ne* | Au† | Pt‡ |
|---|---|---|---|---|
| V0, Å3 | 41.35 | 88.967 | 67.850(4) | 60.38(1) |
| K0T, GPa (Vinet) | 26.86(2.90) | 1.16(14) | 167 | 277 |
| K′0T (Vinet) | 5.25(26) | 8.23(31) | 6.00(2) | 5.08(2) |
| K0T, GPa (B-M) | 30.69(2.90) | 1.43(14) | 167 | 277 |
| K′0T (B-M) | 4.33(26) | 8.02(31) | 5.77(2) | 4.95(2) |
| θ0, K | 290 | 75.1 | 170 | 230 |
| γ0, | 1.70 | 2.05 | 2.97(3) | 2.72(3) |
| q0 | 0.5(3) | 0.6(3) | 0.6(3) | 0.5(5) |
The choice of the equation of state at reference temperature (300 K) is critical for determining the model parameters of the thermal equation of state from the measured thermal pressures (Pth = PT,V − P300K). Fei et al. (18) derived the Debye temperature (θ0), Grüneisen parameter (γ0) and its volume dependence (q) for Au, by fitting the experimental P-V-T data to the Mie–Grüneisen relation,
where γ = γ0(V/V0)q and θD = θ0(V/V0)−γ. The harmonic internal energy E(T, θD) is calculated from the Debye model (34). The model was based on Takemura's (23) room-temperature compression data, which yield a lower K′0 value in comparison to the value derived from the data of Dewaele et al. (11) and this study, thereby underestimating pressure at room temperature and overestimating the thermal pressure. Refitting the P-V-T data of Fei et al. (18) and Hirose et al. (32) to the Mie–Grüneisen relation yields a q value of 0.6 with γ0 = 2.97 and θ0 = 170 K (Table 1).
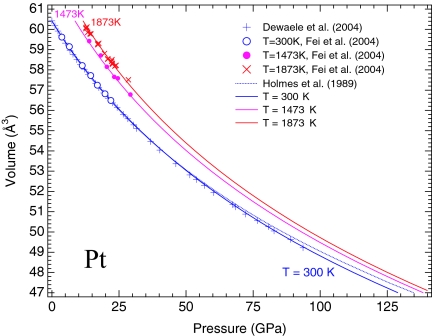
The Pt scales of Jamieson et al. (35) and Holmes et al. (36) predict higher pressures than any other metal pressure scales based on their reduced shock-wave equations of state (11). To establish consistent pressure scales among different metal standard, we propose a Pt scale by fitting the room-temperature compression data of Dewaele et al. (11) and the P-V-T data of Fei et al. (18) to the thermal equation of state describe above. The fitted model parameters are listed in Table 1. The P-V-T data of Fei et al. (18) were recalculated according to the Au scale of this study. The Pt scale is consistent with the proposed Au scale and the ruby scale of Dewaele et al. (11). In comparison, the Pt scale of Holmes et al. (36) overestimates pressures by 4 GPa at a pressure of 100 GPa at room temperature (Fig. 2).
Fig. 2.
Calculated isothermal compression curves of Pt at 300, 1,473, and 1,873 K, compared with experimental data. The 300-K data of Fei et al. (18) (open circles) and Dewaele et al. (11) (crosses) are based on the Au scale of this study and the ruby scale of Dewaele et al. (11), respectively. The Pt scales of Holmes et al. (4) (the dotted curve) systematically overestimate pressures at room temperature. The filled circles and red crosses represent experimental data of Fei et al. (18) at 1,473 and 1,873 K, respectively. The pressures of these data were recalculated by using the Au scale of this study.
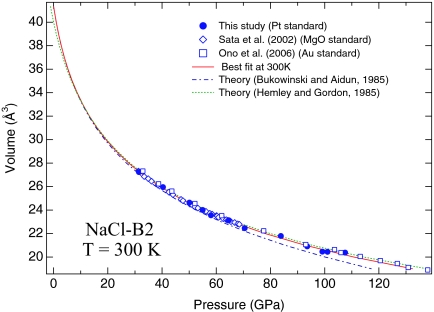
Neon (Ne) and NaCl are commonly used as pressure-transmitting media in diamond-anvil cell experiments. We have obtained compression data of solid Ne and the NaCl-B2 phase to pressures over 100 GPa at room temperature and 1,000 K, using ruby, Pt, and Au as pressure calibrants. Fig. 3 shows the compression data of the NaCl-B2 phase at 300 K, together with data from recent studies (37, 38). We obtained x-ray diffraction data up to 107 GPa using Pt as the pressure standard. All compression data were collected after laser-annealing to ≈1,600 K. Our data are in an excellent agreement with those of Sata et al. (37) and Ono et al. (38), who also used the laser-annealing technique to reduce the nonhydrostatic stress in the sample chamber and used MgO and Au as the internal pressure standards, respectively. There is a remarkable agreement among the three data sets, further strengthening the consistency among the Pt and Au scales of this study and the MgO scale of Speziale et al. (33). Compression data from two earlier studies (39, 40) are much scattered, which may be attributed to the large deviatoric stress in these experiments.
Fig. 3.
Pressure–volume relationship of the NaCl-B2 phase at 300 K. The solid curve represents the best fit to the experimental data of this study. The dashed–dotted and dotted curves represent theoretical calculations by Bukuwinski and Aidun (42) and Hemley and Gordon (43), respectively. The experimental data of Sata et al. (37) (open diamonds), Ono et al. (38) (open squares), and this study (filled circles) are based on the MgO scale of Speziale et al. (33) and the Au and Pt scales of this study, respectively.
A least-squares fit of Vinet equation of state to the compression data of the NaCl-B2 phase yielded K0 of 26.86 (±2.90) GPa and K′0 of 5.25 (±0.26), with an initial volume (V0) of 41.35 Å3. A fit of the third-order Birch–Murnaghan equation of state to the same data yielded K0 of 30.69 (±2.90) GPa and K′0 of 4.33 (±0.26), with fixed V0. In general, the Vinet equation of state gives a better representation of the data over a large compression range (41). The NaCl data cover a range up to 50% volume compression. The best-fitted experimental compression curve is in an excellent agreement with the theoretical predictions (42, 43), resolving the long-standing discrepancy between the theoretically calculated equation of state and the experimental compression data for the NaCl-B2 phase.
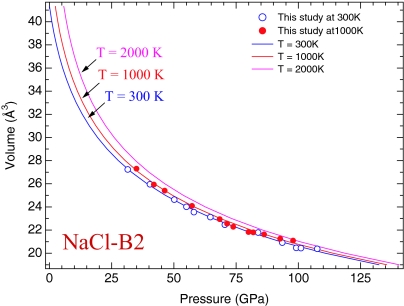
The compression data of the NaCl-B2 phase at 1,000 K were obtained by combining the synchrotron x-ray diffraction and externally heated diamond-anvil cell techniques (44). Fig. 4 shows experimental data collected during the decompression from 98 to 34 GPa while the sample was maintained at a constant temperature of 1,000 K. The pressures were determined from the measured unit cell parameters of Pt based on the Pt pressure scale of this study. We obtained the thermal equation of state of the NaCl-B2 phase by fitting the data to the Mie–Grüneisen relation. The optimized thermal parameters are listed in Table 1. A comparison of the isothermal compression curves at 300 K and 1,000 K indicates a rather small thermal expansivity at high pressure for the NaCl-B2 phase (Fig. 4). The result is consistent with the theoretical calculations that showed similar pressure dependence of the thermal expansivity (43). The thermal behavior of the NaCl-B2 phase is ideal for using the NaCl-B2 phase as a pressure calibrant at high temperature because the small thermal expansivity at high pressure will reduce the uncertainties in pressure determination under simultaneous high P-T conditions.
Fig. 4.
Calculated isothermal compression curves of the NaCl-B2 phase at 300, 1,000, and 2,000 K, compared with experimental data at 300 K (open circles) and 1,000 K (filled circles).
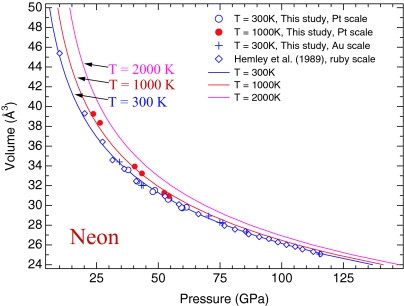
The compression behavior of solid Ne has been investigated up to 110 GPa at room temperature, using ruby and W as the internal pressure standards (45). The pressures determined from the reduced shock-wave equation of state of W are ≈5% higher than pressures from the ruby scale of Mao et al. (9). The W pressure scale is more consistent with the new ruby scale proposed by Dewaele et al. (11), as discussed by Hemley et al. (46). We obtained the compression data of solid Ne up to 61 and 115 GPa using Pt and Au, respectively, as the internal pressure standards. Both data sets are in a good agreement (Fig. 5), demonstrating again the consistency of our Au and Pt scales. Our room-temperature data are in a better agreement with the equation of state of solid Ne determined by Hemley et al. (45) based on the W scale or the new ruby pressure scale of Dewaele et al. (11) (Fig. 5), further demonstrating the consistency among our Au and Pt pressure scales, the W scale, and the ruby pressure scale of Dewaele et al. (11). A least-squares fit of the Vinet equation of state to all room-temperature compression data (refs. 45 and 47, and this study) yielded K0 of 1.16 (±0.14) GPa and K′0 of 8.23 (±0.31), with an initial volume (V0) of 88.967 Å3. A fit of the third-order Birch–Murnaghan equation of state to the same data yielded K0 of 1.43 (±0.14) GPa and K′0 of 8.02 (±0.31), with fixed V0. Combining the compression data at 1,000 K, we established the thermal equation of state of solid Ne with the optimized thermal parameters listed in Table 1.
Fig. 5.
Calculated isothermal compression curves of solid Ne at 300, 1,000, and 2,000 K, compared with experimental data. The 300-K experimental data of this study (open circles, the Pt scale; crosses, the Au scale) and Hemley et al. (45) (open diamonds, the ruby scale) are in a good agreement. The pressures of the Hemley data (45) are recalculated based on the new ruby scale (11), which are more consistent with the W pressure scale. The filled circles represent compression data at 1,000 K, based on the Pt scale of this study.
The thermal equations of state of the NaCl-B2 phase and solid neon established in this study were based on high-quality compression data up to 1,000 K over a wide compression range. There is a remarkable consistency among the room-temperature data collected with different internal pressure standards under conditions close to hydrostatic environment by He or Ne media and by laser-annealing in soft media such as NaCl and Ne. The high-temperature data were collected under a uniform, stable heating environment with accurate temperature measurements. The agreement reflects the self-consistency among the ruby scale (11), the refined Pt and Au pressure scales of this study, and the proposed NaCl-B2 and Ne scales. Because NaCl and Ne are widely used as pressure media in the high P-T experiments, the use of the NaCl-B2 and Ne scales will significantly enrich the high P-T database and provide a crosscheck on pressure determination.
The accuracy of the Mao et al. (9) ruby scale has been independently evaluated by direct pressure measurements using the Brillouin scattering and x-ray diffraction techniques (48). The result indicated that the quasihydrostatic ruby scale is accurate within 2% up to the maximum pressure (55 GPa) of the measurements. Recent studies (11–17) suggested that the quasihydrostatic ruby scale significantly underestimates pressures above 40 GPa. Our experimental data also indicate that the new ruby scale of Dewaele et al. (11) provides a better agreement on the 300-K compression data of Au, Pt, NaCl-B2 phase, and solid Ne, compared with multiple pressure scales including MgO, Au, and Pt. More importantly, we have established a set of internally consistent pressure scales that can be used to determine phase transition boundaries and equations of state of solids at high temperature, which provide a tractable baseline for comparing the high P-T experimental data with the seismic observations including the depths of seismic discontinuities and density profile in the earth's interior. This internally consistent approach is a first, necessary step toward a solution in dealing with the growing amount of published high P-T data. Ultimately this must rely on the establishment of an absolute pressure scale based on self-consistent equation of state measurements by simultaneous x-ray diffraction and acoustic measurements.
Methods
We conducted three static compression experiments at the GSECARS 13-ID-D beamline (Advanced Photon Source, Argonne National Laboratory), using either an externally heated diamond-anvil cell or a symmetric diamond-anvil cell. The first experiment was designed to check the equation of state of Au by using ruby as the pressure calibrant. High pressures were generated between two gem-quality single-crystal diamonds with a brilliant cut. We used Ne as the pressure medium and a small ruby sphere as the pressure calibrant. The second experiment was designed to determine the P-V-T equation of state of NaCl by using Pt as the internal standard. Beveled anvils with 200-μm culet were used to generate pressures over 100 GPa. The Pt powder mixed with an iron-free silicate perovskite sample was sandwiched between NaCl layers, loaded into a 100-μm-diameter sample chamber in a preindented Re gasket (22-μm thickness). The third experiment was aimed to obtain P-V-T data of solid Ne while Ne was used as a pressure medium, using Pt and Au as the internal standards, respectively. Both 300-μm flat and 100-μm beveled diamond anvils were used in the experiments. A mixture of Pt powder and iron-free silicate perovskite was loaded into a sample chamber (150 μm in diameter by 35 μm in thickness) drilled from a preindented Re gasket, whereas a mixture of Au powder and silicate perovskite was loaded into a 60-μm diameter sample chamber in a preindented Re gasket (23-μm thickness) by using the beveled anvils. Only one-third of the chamber volume was filled with the sample. The sample chamber was then filled with Ne gas at 200 MPa in a high-pressure gas-loading device (49) and subsequently sealed at pressures above 1 GPa.
To reduce the deviatoric stress in the sample chamber, we annealed the samples by laser-heating to ≈1,600 K. X-ray diffraction data of the samples were obtained after each laser-annealing. The diffraction peaks are sharpened with improved least-squares fit of cell parameters from different hkl diffraction peaks after the annealing. Although Ne serves as an excellent quasihydrostatic pressure medium, the sample was also laser-annealed at each pressure to further minimize the deviatoric stress. Stable high temperatures up to 1,000 K were achieved by an external resistance-heater system around the diamond anvils in a mildly reducing atmosphere (Ar with 1% H2) (44). The temperatures were measured with a Pt-Pt 10% Rh thermocouple.
Intense monochromatic synchrotron x-radiation, with a fixed wavelength of 0.3311 Å, was used for angle-dispersive x-ray diffraction measurements. A highly collimated x-ray beam (6 × 7 μm) was aligned with the center of the sample chamber in the diamond-anvil cell. The diffraction patterns of the samples were recorded with a high-resolution Mar (Evanston, IL) CCD area detector and then processed with FIT2D software (www.esrf.fr/computing/scientific/FIT2D). The detector tilting and the distance between the sample and detector were calibrated against the known lattice parameters of CeO2. The lattice parameters of the samples were determined by fitting the observed diffraction peaks.
Acknowledgments
We thank R. J. Hemley and the referees for suggestions that substantially improved the manuscript. The experimental work was performed at the GeoSoilEnviroCARS synchrotron beamline, which is supported by National Science Foundation Grant EAR-02177473, Department of Energy Grant DE-FG02-94ER14466, and the State of Illinois. This work was supported by National Science Foundation Geophysics Grant EAR-0510207 (to Y.F.) and the Carnegie Institution of Washington.
Footnotes
The authors declare no conflict of interest.
This article is a PNAS Direct Submission.
References
- 1.Dziewonski AM, Anderson DL. Phys Earth Planet Inter. 1981;25:297–356. [Google Scholar]
- 2.Fei Y, Bertka CM. In: Mantle Petrology: Field Observations and High-Pressure Experimentation; A Tribute to F. R. Boyd. Fei Y, Bertka CM, Mysen BO, editors. Vol. 6. Washington, DC: Geochem Soc; 1999. pp. 189–207. Spec Publ. [Google Scholar]
- 3.Helffrich GR. Rev Geophys. 2000;38:141–158. [Google Scholar]
- 4.Murakami M, Hirose K, Kawamura K, Sata N, Ohishi Y. Science. 2004;304:855–858. doi: 10.1126/science.1095932. [DOI] [PubMed] [Google Scholar]
- 5.Hirose K. Rev Geophys. 2006;44:RG3001. [Google Scholar]
- 6.Dewaele A, Loubeyre P, Occelli F, Mezouar M, Dorogokupets PI, Torrent M. Phys Rev Lett. 2006;97:215504. doi: 10.1103/PhysRevLett.97.215504. [DOI] [PubMed] [Google Scholar]
- 7.Dubrovinsky LS, Saxena SK, Tutti F, Rekhi S. Phys Rev Lett. 2000;84:1720–1723. doi: 10.1103/PhysRevLett.84.1720. [DOI] [PubMed] [Google Scholar]
- 8.Mao HK, Wu Y, Chen LC, Shu JF. J Geophys Res. 1990;95:21737–21742. [Google Scholar]
- 9.Mao HK, Xu J, Bell PM. J Geophys Res. 1986;91:4673–4676. [Google Scholar]
- 10.Carter WJ, Marsh SP, Fritz JN, McQueen RG. In: Accurate Characterization of the High-Pressure Environment. Lloyd EC, editor. Vol. 326. Washington, DC: National Bureau of Standards; 1971. pp. 147–158. Spec Publ. [Google Scholar]
- 11.Dewaele A, Loubeyre P, Mezouar M. Phys Rev B. 2004;70 094112. [Google Scholar]
- 12.Chijioke AD, Nellis WJ, Silvera IF. J Appl Phys. 2005;98 073526. [Google Scholar]
- 13.Aleksandrov IV, Goncharov AF, Zisman AN, Stishov SM. Sov Phys JETP. 1987;66:384. [Google Scholar]
- 14.Holzapfel WB. J Appl Phys. 2003;93:1813–1818. [Google Scholar]
- 15.Kunc K, Loa I, Syassen K. Phys Rev B. 2003;68 094107. [Google Scholar]
- 16.Kunc K, Loa I, Syassen K. High Press Res. 2004;24:101. [Google Scholar]
- 17.Dorogokupets PI, Oganov AR. Phys Rev B. 2007;75 024115. [Google Scholar]
- 18.Fei Y, Li J, Hirose K, Minarik W, Van Orman J, Sanloup C, van Westrenen W, Komabayashi T, Funakoshi K. Phys Earth Planet Inter. 2004;143/144:516–526. [Google Scholar]
- 19.Anderson OL, Isaak DG, Yamamoto S. J Appl Phys. 1989;65:1534–1543. [Google Scholar]
- 20.Heinz DL, Jeanloz R. J Appl Phys. 1984;55:885–893. [Google Scholar]
- 21.Wang Y, Chen D, Zhang X. Phys Rev Lett. 2000;84:3220–3223. doi: 10.1103/PhysRevLett.84.3220. [DOI] [PubMed] [Google Scholar]
- 22.Shim S, Duffy TS, Takemura K. Earth Planet Sci Lett. 2002;203:729–739. [Google Scholar]
- 23.Takemura K. J Appl Phys. 2001;89:662–668. [Google Scholar]
- 24.Irifune T, Nishiyama N, Kuroda K, Inoue T, Isshiki M, Utsumi W, Funakoshi K, Urakawa S, Uchida T, Katsura T, Ohtaka O. Science. 1998;279:1698–1700. doi: 10.1126/science.279.5357.1698. [DOI] [PubMed] [Google Scholar]
- 25.Katsura T, Yamada H, Shinmei T, Kubo A, Ono S, Kanzaki M, Yoneda A, Walter MJ, Ito E, Urakawa S, Funakoshi K, Utsumi W. Phys Earth Planet Inter. 2003;136:11–24. [Google Scholar]
- 26.Fei Y, Van Orman J, Li J, van Westrenen W, Sanloup C, Minarik W, Hirose K, Komabayashi T, Walter M, Funakoshi K. J Geophys Res. 2004;109:B2305. [Google Scholar]
- 27.Tsuchiya T. J Geophys Res. 2003;108:B2462. [Google Scholar]
- 28.Greeff CW, Graf MJ. Phys Rev B. 2004;69 054107. [Google Scholar]
- 29.Souvatzis P, Delin A, Eriksson O. Phys Rev B. 2006;73 054110. [Google Scholar]
- 30.Holzapfel WB. High Press Res. 2005;25:87–96. [Google Scholar]
- 31.Vinet P, Ferrante J, Ross JH, Smith JR. J Geophys Res. 1987;92:9319–9325. [Google Scholar]
- 32.Hirose K, Sinmyo R, Sata N, Ohishi Y. Geophys Res Lett. 2006;33:L01310. [Google Scholar]
- 33.Speziale S, Zha C, Duffy TS, Hemley RJ, Mao HK. J Geophys Res. 2001;106:515–528. [Google Scholar]
- 34.Fei Y, Mao HK, Shu J, Hu J. Phys Chem Miner. 1992;18:416–422. [Google Scholar]
- 35.Jamieson JC, Fritz JN, Manghnani MH. In: High Pressure Research in Geophysics. Akimoto S, Manghnani MH, editors. Tokyo: Center for Academic Publications; 1982. pp. 27–47. [Google Scholar]
- 36.Holmes NC, Moriarty JA, Gathers GR, Nellis WJ. J Appl Phys. 1989;66:2962–2967. [Google Scholar]
- 37.Sata N, Shen G, Rivers ML, Sutton SR. Phys Rev B. 2002;65:104114. [Google Scholar]
- 38.Ono S, Kikegawa T, Ohishi Y. Solid State Commun. 2006;137:517–521. [Google Scholar]
- 39.Sato-Sorensen Y. J Geophys Res. 1983;88:3543–3548. [Google Scholar]
- 40.Heinz DL, Jeanloz R. Phys Rev B. 1984;30:6045–6050. [Google Scholar]
- 41.Cohen RE, Gülseren O, Hemley RJ. Am Mineral. 2000;85:338–344. [Google Scholar]
- 42.Bukowinski MST, Aidun J. J Geophys Res. 1985;90:1794–1800. [Google Scholar]
- 43.Hemley RJ, Gordon RG. J Geophys Res. 1985;90:7803–7813. [Google Scholar]
- 44.Fei Y. In: Mineral Spectroscopy: A Tribute to Roger G. Burns. Dyar MD, McCammon C, Schaefer MW, editors. Vol. 5. Houston: Geochem Soc; 1996. pp. 243–254. Spec Publ. [Google Scholar]
- 45.Hemley RJ, Zha CS, Jephcoat AP, Mao HK, Finger LW, Cox DE. Phys Rev B. 1989;39:11820–11827. doi: 10.1103/physrevb.39.11820. [DOI] [PubMed] [Google Scholar]
- 46.Hemley RJ, Mao HK, Struzhkin VV. J Synchrotron Radiat. 2005;12:135–154. doi: 10.1107/S0909049504034417. [DOI] [PubMed] [Google Scholar]
- 47.Finger LW, Hazen RM, Zou G, Mao HK, Bell PM. Appl Phys Lett. 1981;39:892–894. [Google Scholar]
- 48.Zha C, Mao HK, Hemley RJ. Proc Natl Acad Sci USA. 2000;97:13494–13499. doi: 10.1073/pnas.240466697. [DOI] [PMC free article] [PubMed] [Google Scholar]
- 49.Jephcoat AP, Mao HK, Bell PM. In: Hydrothermal Experimental Techniques. Ulmer GC, Barnes HL, editors. New York: Wiley InterScience; 1987. pp. 469–506. [Google Scholar]


