

Abstract
Arising from either retrotransposition or genomic duplication of functional genes, pseudogenes are “genomic fossils” valuable for exploring the dynamics and evolution of genes and genomes. Pseudogene identification is an important problem in computational genomics, and is also critical for obtaining an accurate picture of a genome’s structure and function. However, no consensus computational scheme for defining and detecting pseudogenes has been developed thus far. As part of the ENCyclopedia Of DNA Elements (ENCODE) project, we have compared several distinct pseudogene annotation strategies and found that different approaches and parameters often resulted in rather distinct sets of pseudogenes. We subsequently developed a consensus approach for annotating pseudogenes (derived from protein coding genes) in the ENCODE regions, resulting in 201 pseudogenes, two-thirds of which originated from retrotransposition. A survey of orthologs for these pseudogenes in 28 vertebrate genomes showed that a significant fraction (∼80%) of the processed pseudogenes are primate-specific sequences, highlighting the increasing retrotransposition activity in primates. Analysis of sequence conservation and variation also demonstrated that most pseudogenes evolve neutrally, and processed pseudogenes appear to have lost their coding potential immediately or soon after their emergence. In order to explore the functional implication of pseudogene prevalence, we have extensively examined the transcriptional activity of the ENCODE pseudogenes. We performed systematic series of pseudogene-specific RACE analyses. These, together with complementary evidence derived from tiling microarrays and high throughput sequencing, demonstrated that at least a fifth of the 201 pseudogenes are transcribed in one or more cell lines or tissues.
The goal of the ENCyclopedia Of DNA Elements (ENCODE) project is to produce a comprehensive catalog of structural and functional components encoded in the human genome (The ENCODE Project Consortium 2004). In its pilot phase, ∼30 Mb (∼1%) of the human genome was chosen as representative targets. Most of the functional components (e.g., genes and regulatory elements) are essentially determined by high-throughput experimental technologies with the assistance of computational analyses (The ENCODE Project Consortium 2004); however, one component whose identification depends almost exclusively on computational analysis is pseudogenes.
Pseudogenes are usually defined as defunct copies of genes that have lost their potential as DNA templates for functional products (Vanin 1985; Mighell et al. 2000; Harrison et al. 2002; Balakirev and Ayala 2003; Zhang et al. 2003; Zhang and Gerstein 2004; Zheng et al. 2005). As only pseudogenes derived from protein coding genes are characterized here, the term pseudogene in this study applies to genomic sequences that cannot encode a functional protein product. Pseudogenes are often separated into two classes: processed pseudogenes, which have been retrotransposed back into a genome via an RNA intermediate; and nonprocessed pseudogenes, which are genomic remains of duplicated genes or residues of dead genes. These two classes of pseudogenes exhibit very distinct features: processed pseudogenes lack introns, possess relics of a poly(A) tail, and are often flanked by target-site duplications (Brosius 1991; Jurka 1997; Mighell et al. 2000; Balakirev and Ayala 2003; Long et al. 2003; Schmitz et al. 2004). It has to be mentioned that retrotransposition sometimes generates new genes that are often called retroposed genes (or processed genes) (Brosius 1991; Long et al. 2003).
The common assumption is that pseudogenes are nonfunctional and thus evolve neutrally. As such, they are frequently considered as “genomic fossils” and are often used for calibrating parameters of various models in molecular evolution, such as estimates of neutral mutation rates (Li et al. 1981, 1984; Gojobori et al. 1982; Gu and Li 1995; Ota and Nei 1995; Bustamante et al. 2002; Zhang and Gerstein 2003). However, a few pseudogenes have been indicated to have potential biological roles (Ota and Nei 1995; Korneev et al. 1999; Mighell et al. 2000; Balakirev and Ayala 2003). Whether these are anecdotal cases or pseudogenes do play cellular roles is still a matter of debate at this point, simply because not enough studies have been conducted with pseudogenes as the primary subjects. To be clear, in this study the nonfunctionality of a pseudogene is strictly interpreted as a sequence’s lacking protein coding potential, regardless of whether it can produce a (functional or nonfunctional) RNA transcript.
The prevalence of pseudogenes in mammalian genomes (Mighell et al. 2000; Balakirev and Ayala 2003; Zhang et al. 2003) has been problematic for gene annotation (van Baren and Brent 2006) and can introduce artifacts to molecular experiments targeted at functional genes (Kenmochi et al. 1998; Ruud et al. 1999; Smith et al. 2001; Hurteau and Spivack 2002). The correct identification of pseudogenes, therefore, is critical for obtaining a comprehensive and accurate catalog of structural and functional elements of the human genome. Several computational algorithms have been described previously for annotating human pseudogenes (Harrison et al. 2002; Ohshima et al. 2003; Torrents et al. 2003; Zhang et al. 2003, 2006; Coin and Durbin 2004; Khelifi et al. 2005; Bischof et al. 2006; van Baren and Brent 2006). Although these methods often present similar estimates for the number of pseudogenes in the human genome, they can produce rather distinct pseudogene sets (Zhang and Gerstein 2004; Khelifi et al. 2005; Zheng et al. 2005). In order to obtain an accurate list of pseudogenes in the ENCODE regions, we have compared several methods and subsequently developed a uniform computational framework for annotating pseudogenes, which can be applied to the human and other mammalian genomes. Furthermore, the final list of pseudogenes is good benchmark data for developing and improving methods of pseudogene annotation.
To characterize the ENCODE pseudogenes in detail, we have subsequently synthesized data from several ENCODE research groups (The ENCODE Project Consortium 2007). We examined the transcriptional activity of pseudogenes using data from the ENCODE genes and transcripts group, and the transcription regulation group. In addition, rapid amplification of cDNA ends (RACE) analyses coupled with tiling microarrays (Kapranov et al. 2005) was carried out in this study with pseudogene loci as the specific targets. These empirical transcriptional data from multiple techniques together revealed a complex picture of pseudogene transcription: low in abundance and specific in tissues or cells.
Using data generated by the ENCODE multispecies sequence analysis group and variation group, we have begun to explore several fundamental concepts concerning the evolution and preservation of pseudogenes. Specifically, with orthologous genomic sequences from 28 mammalian or vertebrate species, we have characterized in detail the sequence decay and preservation of pseudogenes, in comparison to both their surrounding genomic materials and protein coding genes.
Results
Strategies and results of pseudogene annotation in the ENCODE regions
As a subgroup within the ENCODE project, our first goal is to obtain an accurate list of pseudogenes in order to facilitate the creation of a comprehensive catalog of structural and functional elements in the ENCODE regions (The ENCODE Project Consortium 2004). This is realized in a consortium fashion and executed in two stages. We began with an examination of five methods for detecting pseudogenes. These methods, which have been developed independently, are: (1) The GIS-PET method, from the Genome Institute of Singapore; (2) the HAVANA method of manual pseudogene annotation, by the Human And Vertebrate Analysis aNd Annotation team (HAVANA) at the Wellcome Trust Sanger Institute as part of the GENCODE collaboration (Harrow et al. 2006); (3) PseudoPipe (Zhang et al. 2006; Zheng and Gerstein 2006), from the pseudogene research group at Yale University; (4) pseudoFinder, from the University of California Santa Cruz (UCSC); and retroFinder, also from UCSC but focused specifically on processed pseudogenes.
Details of these computational methods are described in Methods and the Supplemental Material. In summary, all five methods detected pseudogenes by their sequence similarity to at least one entry in a collection of query sequences representing known human genes (referred to as the parent genes). The major differences are in (1) queries (either proteins or nucleotides) used to search for pseudogenes and (2) strategies (including parameters) used to assess a sequence’s coding potential and to distinguish pseudogenes into types of processed or nonprocessed.
The initial sets of pseudogenes annotated by individual methods for the ENCODE regions contained similar numbers (except GIS) of pseudogenes: 56 by GIS, 165 by HAVANA, 167 by PseudoPipe, 172 by pseudoFinder, and 163 by retroFinder; but, the annotated pseudogene sets were rather different. A simple union of these five sets yielded 252 nonoverlapping pseudogenes, of which only 45 (17.9%) were identified by all methods, while 69 (27.3%) were method specific (Fig. 1). Setting aside the GIS data (for reasons, see Supplemental Material), we found that 87 (34.5%) pseudogenes were agreed on by the remaining four methods. Furthermore, pairwise comparisons showed that the overlaps between two lists ranged from 62.2% to 80%, with the two protein-based methods exhibiting the best agreement: 132 of 165 (80%) HAVANA pseudogenes were also discovered by the Yale method.
Figure 1.

Comparison of results from five methods of pseudogene identification. (A) Pseudogenes annotated by a method were binned into groups based on the number of methods that recognized them as pseudogenes. In this scheme, method-specific pseudogenes were labeled as (found by) “1” method. (B) A four-way comparison of pseudogenes identified by HAVANA, PseudoPipe, retroFinder, and pseudoFinder. Note: one pseudogene could overlap more than one pseudogene from other method(s).
The results above show clearly that none of the individual methods initially applied to the study provided a completely authoritative description of the pseudogenes in the ENCODE regions. After careful comparisons and investigations, it was determined that the most critical factor contributing to the discrepancies among the pseudogene sets was the nature of the queries (i.e., the parent genes/proteins used for detecting pseudogenes) rather than uncertainty of pseudogene assignment. In most cases, when a pseudogene was missed by one or more methods, careful manual inspection identified the same problem: the parent gene or the coding sequence (CDS) assigned to it was dubious or simply not used by other approaches (see Supplemental Material).
In order to minimize such consequences, as the second stage of our annotation we have developed a consensus procedure that involves intense manual curation to obtain an accurate and reliable list of pseudogenes. Such a procedure also provides a uniform definition and computational scheme for consolidating lists of pseudogenes from different sources. Our current approach is based on known proteins in the UniProt database (Bairoch et al. 2005), that is, we only considered pseudogenes with support from reliable parent protein coding sequences. Classification of processed and nonprocessed pseudogenes was based on retention of parent gene structure, evidence of a retrotransposition, and preservation of flanking genomic sequence. By this procedure and starting from the 252 nonredundant pseudogenes annotated in the first stage, we identified a consensus set of 201 pseudogenes, 77 of which were nonprocessed and 124 processed. This pseudogene annotation is available at http://www.pseudogene.org/ENCODE/ and http://genome.ucsc.edu/ENCODE/. (Under the UCSC browser, a special track named “ENCODE Pseudogene Predictions” was built to present both our final consensus annotation and the initial annotations from the individual methods.) It is important to point out that each of the five methods except for GIS-PET contributed new pseudogenes to the final consensus set. All subsequent analyses described below were done on these 201 consensus pseudogenes.
Characterization of the ENCODE pseudogenes
The genomic distribution of pseudogenes is similar overall to that of functional coding genes: that is, gene-rich ENCODE regions usually have more pseudogenes than gene-poor regions (Fig. 2). In addition, different gene families seem to have contributed very different numbers of pseudogenes. The two dominant families were ribosomal protein genes and olfactory receptor (OR) genes, which accounted for 37 (18.5%, all processed) and 29 (14.5%, all nonprocessed) of the 201 pseudogenes, respectively. Additionally, ∼10% of the pseudogenes were from genes involved in immune response. Contributions from other gene families were relatively small (less than five pseudogenes per family). Notably, the over-representation of OR pseudogenes simply reflects the inclusion of a single region (ENm009) in the ENCODE pilot project that contains a large cluster of coding OR genes and OR pseudogenes (Glusman et al. 2001) and does not, therefore, represent the statistics for the entire human genome.
Figure 2.

The distribution of genes and the final 201 consensus pseudogenes within 44 ENCODE regions. Both genes and pseudogenes were concentrated in the manually picked regions (001–014).
Most pseudogenes are decayed gene copies and have accumulated nonsense or frameshift mutations that would usually disrupt an open reading frame (ORF). The ENCODE processed and nonprocessed pseudogenes share mean sequence identities of 67.6% (±14%) and 61.8% (±18%) with their parent proteins in alignment coverage of 82.4% (±26%) and 69.4% (±33%), respectively. In addition, 83.2% of processed and 79% of nonprocessed pseudogenes display disablements (defined as nonsense or frameshift mutations) in their putative ORFs, with average disablements of 6.2 per processed pseudogene and 2.4 per nonprocessed pseudogene. Overall, such disablements were located uniformly across the hypothetical coding regions of pseudogenes. The differences in sequence identity and disablements between processed and nonprocessed pseudogenes are significant (P < 0.001, Wilcoxon rank-sum test), appearing to suggest that the sequences giving rise to processed pseudogenes lose coding potential more quickly than those for nonprocessed pseudogenes. It needs to be pointed out that disablements can sometimes escape detection because of the limitation of available sequence alignment tools (Zheng and Gerstein 2006). Therefore, they should not be used as the exclusive criterion for distinguishing pseudogenes from genes.
Pseudogene transcription
Using pre-existing data, several recent surveys have indicated that pseudogene transcription could contribute to the complexity of the human transcriptome (Strichman-Almashanu et al. 2003; Yano et al. 2004; Harrison et al. 2005; Zheng et al. 2005; Shemesh et al. 2006; Vinckenbosch et al. 2006). In order to obtain direct evidence of pseudogene transcription, we have systematically interrogated the transcription of 160 pseudogenes (49 nonprocessed and 111 processed) with locus-specific RACE/microarray analysis (Kapranov et al. 2005) using poly(A)+ RNA from 12 tissues. In 51 cases (26 nonprocessed and 25 processed pseudogenes), we were able to design pseudogene locus-specific 5′-RACE primers, which typically had five or more mismatched base pairs when compared to the parent genes while matching the pseudogenes perfectly. For the remainder, it was not possible to design such primers. To take this into account, a careful examination of the transcriptionally active regions (termed RACEfrags) (Denoeud et al. 2007) identified by hybridizing RACE products onto tiling microarrays was performed in the subsequent data analysis. Specifically, we assigned a RACEfrag to a pseudogene only if it was uniquely mapped to this pseudogene locus (see Methods). The resulting data supported transcription for 14 (eight processed and six nonprocessed) of the 160 pseudogenes loci, nine of which were from RACE experiments where pseudogene-specific primers were used. Interestingly, nine of these 14 pseudogenes were found to be transcriptionally active (and five exclusively) in testes. This unusual pseudogene expression in testes may have biological implications, and this observation is in accordance with previous reports (Kleene et al. 1998; Reymond et al. 2002; Marques et al. 2005) and especially a recent finding that transcription of human retrocopies mainly (and/or initially) occurs in testes (Vinckenbosch et al. 2006). The final number of 14 seems a conservative estimate since we decided not to assign an (ambiguous) RACEfrag to a pseudogene if it could be mapped to both the pseudogene and another locus.
In addition to this pseudogene-targeted RACE analysis, we have also intersected our pseudogenes with various empirical transcription data obtained by the ENCODE genes and transcripts group (The ENCODE Project Consortium 2007), including transfrags, 5′-specific Cap Analysis Gene Expression (CAGE) tags, and Paired-End 5′ and 3′ diTags (PET). These analyses suggested that a large number of pseudogenes were potentially transcribed (Table 1). A survey of known mRNA/ESTs in public databases also identified 21 transcribed ENCODE pseudogenes. Figure 3 shows one example of pseudogene transcription, and data for all our individual pseudogenes are available in the UCSC browser (which can be accessed through a table in the Supplemental Material).
Table 1.
Numbers of ENCODE consensus pseudogenes with transcriptional evidence
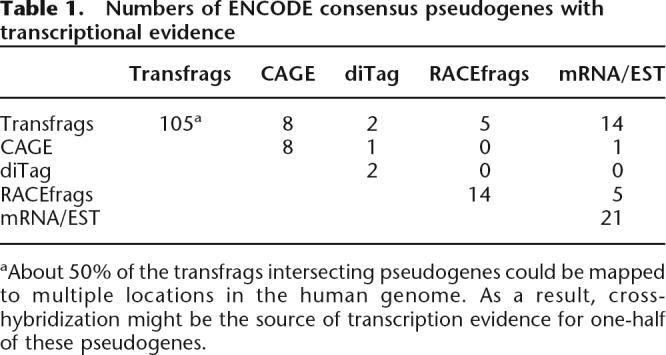
aAbout 50% of the transfrags intersecting pseudogenes could be mapped to multiple locations in the human genome. As a result, cross-hybridization might be the source of transcription evidence for one-half of these pseudogenes.
Figure 3.

A pseudogene with multiple evidence of transcription. This is a processed pseudogene identified by all five methods (in pink). The evidence of transcription includes RACEfrags, EST, GIS-PET, Riken CAGE, and transfrags (Affy RNA or Yale TARs). Near its 5′-end there is a putative promoter region (ENCODE_ChIP, top) derived from many ChIP-chip experiments targeted at DNA elements regulating transcription.
We believe that the data obtained by RACE experiments or by sequencing analyses (CAGE, PET, EST, and mRNA) provide unambiguous evidence for pseudogene transcription. Altogether, these data indicate that 38 (19% of 201, 20 nonprocessed and 18 processed) pseudogenes are the sources of novel RNA transcripts. This may well represent a low-bound estimate and does not include the ambiguous and possibly inconclusive cases supported only by transfrags. We should emphasize that most cases of pseudogene transcription were only detected in one or a few experiments (manifested by small overlaps between data from different evidence) (Table 1), and thus the example in Figure 3 is not typical. This indicates that pseudogene transcription is quite tissue-specific, as RACEfrags, CAGE, PET, and transfrags were obtained from different cell lines or tissues (see Methods). On the other hand, such a pattern of tissue- (or cell line)-specific transcription was a common characteristic of novel non-coding transcripts (Cheng et al. 2005).
We have subsequently examined the ENCODE pseudogenes for potential cryptic promoters. A comparison with high-quality regulatory elements discovered by integrative analyses of ∼130 chromatin immunoprecipitation (ChIP)-chip experiments (Trinklein et al. 2007) showed that 19 pseudogenes (three nonprocessed and 16 processed) likely contained transcriptional regulation sites in their “promoter” regions (−2 kb ∼ +200 bp). Five of these were among the 38 pseudogenes exhibiting transcription evidence, but the association of regulatory elements with transcription was not statistically significant (P = 0.58, χ2-test).
Pseudogene preservation
Pseudogenes are usually considered the evolutionary endpoint of genomic material whose ultimate fate is to be removed from a genome. Nevertheless, millions of years of evolution has left the human genome with thousands of pseudogenes (Torrents et al. 2003; Zhang et al. 2003). Within the ENCODE project, the MSA group has identified and sequenced the orthologous regions of the individual ENCODE target regions in 20–28 vertebrate (mostly mammalian) species (see Methods for the list). Several algorithms such as TBA (Threaded Blockset Aligner) (Blanchette et al. 2004) have also been applied to construct multispecies sequence alignments across the entire ENCODE regions (The ENCODE Project Consortium 2007; Margulies et al. 2007). With these data, it is possible to survey the preservation of sequences corresponding to the human pseudogenes in other species to get a glimpse of the evolutionary process leading to the human lineage.
For each of our 201 pseudogenes, the aligned block containing this pseudogene was extracted from the multispecies sequence alignments constructed by the MSA group, and this excerpt was defined as the orthologous region for this pseudogene. A sequence relative (i.e., ortholog) of a human pseudogene was considered to be present (i.e., “preserved”) in a species if at least 50 nucleotides from that species were found in the aligned block. The data in Figure 4 show that as a species’ divergence from humans increases, fewer orthologs of (current) human nonprocessed pseudogenes are preserved, suggesting that the majority of duplication events giving rise to these genomic materials occurred a long time ago. This pattern slightly deviates from that of protein coding genes, as expected. However, the trend for processed pseudogenes is dramatically different; preservation decreases very sharply before reaching a near plateau (Fig. 4). The turning point appears to be between the New World monkeys and strepsirrhines, about 40 to 63 million years ago (Mya) (Goodman et al. 1998; Goodman 1999) or later. There is no significant difference between the introns (i.e., pseudointrons) and exons (i.e., pseudoexons) of pseudogenes (see Supplemental Fig. S1). As the ortholog assignment for distantly related species can be tricky, we have used the MSA data from other alignment programs, MAVID (Bray and Pachter 2004) and MLAGAN (Brudno et al. 2003), and obtained similar results (shown in Fig. 4 for processed pseudogenes only). These results demonstrate that most (∼80%) human processed pseudogenes arise from sequences specific to the primate lineage and are in good agreement with previous data estimated with molecular clocks using pseudogenes and SINE (short interspersed elements) repeats (Ohshima et al. 2003).
Figure 4.

Preservation of human genomic components in other species. The number of human pseudogenes (or genes) with orthologous sequences in individual species was computed and then plotted (by normalization with the total number in human) against each species. Only exons (or pseudoexons) were used in these analyses; (NPS) nonprocessed and (PS) processed pseudogenes. Data were derived from sequence alignment constructed by the program TBA except PS-mavid, which was by MAVID. Note that species with sequences available for the ENm001 region only are omitted in this figure. A more comprehensive plot (of this figure and also Fig. 5A) with data for introns and other genomic data can be found in Supplemental Figures S1 and S2. The data for non-mammalian species (right of the vertical line) should be taken with more caution because ortholog assignments for these species are likely more difficult.
The overall sequence decay rate of pseudogenes is very similar to that of neutrally evolving DNA. The nucleotide sequence identity between human pseudogenes and their orthologs indicates apparently that the majority of pseudogenes experience no evolutionary constraints, as their sequence decay pattern is not much different from that derived from fourfold degenerative sites, at least within the lineage of mammals (Fig. 5A). We subsequently analyzed these 201 pseudogenes and the corresponding MSA data using the program phastOdds (Siepel et al. 2005), which computes the log odds ratio of the probability that a sequence fragment fits a model of “constrained” versus “neutral” evolution. The result supports that the evolution of pseudogenes as a group is better described by the neutral model, but it suggests that a few pseudogenes (mostly nonprocessed ones) may have experienced evolutionary constraints in certain periods of their evolution (most likely as genes) (Fig. 5B).
Figure 5.

ENCODE pseudogenes overall exhibit a characteristic pattern of neutral evolution. (A) The orthologous sequences of each human genomic component (e.g., pseudogene) were retrieved from MSA data, and pairwise nucleotide sequence identity was calculated. Shown here are the means for each type of components (data labeled as in Fig. 4). A line representing neutral evolution is also shown using data derived from fourfold degenerate sites. (B) A score based on the log-likelihood of observing a genomic fragment under a model of constrained versus neutral evolution was computed for individual exons of genes or pseudogenes using the phastOdds program (Siepel et al. 2005). These scores were then normalized by exon length and plotted here as a histogram. A value near zero or negative indicates that the evolution of a sequence can be described better by a neutral model.
The evolutionary constraint of a genomic sequence can also be evaluated in the context of its local genomic environment. As known and shown in Figure 6, the nucleotide sequence identity in CDS of genes is significantly higher than that in their adjacent 5′ and 3′ genomic sequences (human–mouse, human–dog; such a pattern is not obvious when very closely related species like human–chimp are considered). Pseudogenes, however, do not display such a clear profile of sequence constraints. In fact, constraints on processed pseudogenes are not much different from those on their surrounding genomic sequences. The profile for nonprocessed pseudogenes is rather intricate. On one hand, the data from the human–mouse comparison indicate that some of these pseudogenes may have evolved with constraints (Fig. 6). On the other hand, the data from human–chimp and human–macaque comparisons suggest that nonprocessed pseudogenes may have speeded up their evolution recently. This is probably due to an increasing mutation rate that can be attributed to the higher GC content (51.5%) in these nonprocessed pseudogenes versus their adjacent sequences (43.4%) and processed pseudogenes (46.1%), suggesting that such sequences only became pseudogenes recently and were genes for much of their histories. Notably, about one-half of our nonprocessed pseudogenes were derived from olfactory receptor genes and genes involved in immune response, which have been suggested to be under positive selection (Lander et al. 2001; Chimpanzee Sequencing and Analysis Consortium 2005; Gilad et al. 2005; Lindblad-Toh et al. 2005).
Figure 6.

Comparison of sequence conservation for genes and pseudogenes in the context of adjacent genomic sequences. The orthologous sequences in chimp, macaque, mouse, and dog were retrieved from the MSA data for protein “coding” regions (CDS) of genes and pseudogenes. Their regions were divided into 10 blocks, and pairwise nucleotide sequence identities were calculated for each block. The data shown here are the means for all genes or processed (PS) or nonprocessed (NPS) pseudogenes. For comparison, 500-bp upstream and downstream sequences of CDSs were also analyzed. The P-values of the t-test for the differences between genes and pseudogenes (for all four species) and between NPS and PS (in chimp and macaque) are <0.01.
In summary, as a group of genomic components, pseudogenes appear to evolve neutrally with few candidates exhibiting evolutionary constraints as measured by cross-species sequence preservation and phastOdds ratios. The “constraints” could be either a direct result of functional constraints or simply a consequence of recent pseudogenization. It has to be pointed out that our results may be complicated by the challenge in identifying orthologous sequences in species very divergent from human (King et al. 2007; Margulies et al. 2007) and thus reflect alignment artifacts. On the other hand, our conclusion is independently supported by analyses of SNP (single nucleotide polymorphism) density and nonsynonymous versus synonymous substitution (Ka/Ks) ratios (Fig. 7), which showed that the SNP density and Ka/Ks ratios of pseudogenes were overall significantly higher than those of genes (P < 0.01), but outliers nonetheless existed.
Figure 7.

Comparison of Ka/Ks ratio and SNP density for genes and pseudogenes. Only the CDS of a gene or pseudogene was used for analyses of Ka/Ks ratio and SNP density (number of SNP per 300 nucleotides). The Ka/Ks ratio was derived from the sequences between baboon and human. Data for transcribed pseudogenes are circled, and they are not statistically significant from the rest.
Pinpointing the timeline of pseudogenization
With the MSA data we have attempted to track the history of individual pseudogene sequence and discover when the sequence appeared and lost its protein coding ability (i.e., pseudogenized). In this analysis, the orthologous sequences of each ENCODE pseudogene were retrieved from MSA data and then compared to the pseudogene’s parent protein sequence using the alignment programs GeneWise (Birney et al. 2004) or FASTA (Pearson et al. 1997). The resulting alignments were then examined for nonsense or frameshift mutations. These analyses showed that disablements of a human processed pseudogene were often observed in their orthologous sequences as well (see Supplemental Table S1; Fig. 8), further supporting the hypothesis that these sequences were dead on arrival or became a pseudogene soon after emergence. However, the scenario for nonprocessed pseudogenes is more complicated. Even in species like chimp, baboon, and macaque that are very close to human, the pseudogenization of orthologous sequences is not always consistent with what one might expect from phylogeny (Fig. 8). For instance, a nonprocessed pseudogene (ID AC087380.14) located in region ENm009 appears to have originated from duplication of a functional gene with an olfactomedin-like domain. A disruption in its ORF is observed in the orthologous sequences of human, baboon, macaque, and many other species, but not chimp, marmoset, or galago. This suggests that pseudogenization is most likely a random process in which disablements accumulate gradually and randomly once evolutionary constraint on a sequence relaxes. As a result, for recently pseudogenized sequences, we see disablements occurring in various species randomly. It has to be emphasized again, however, that a precise interpretation of our data should account for the quality of sequencing for each species and the reliability of ortholog assignments, which can be problematic for species very distantly related to humans. Also, gene conversion would add further complication to the final species pattern of disablements.
Figure 8.

Detection and disabled pattern of pseudogene orthologs. For each pseudogene, its orthologous sequences were retrieved and compared to the parent protein sequence. Respectively, boxes and circles represent whether a pseudogene ortholog is detected or not in a species. A cross (×) means that the hypothetical CDS is disabled. Data for non-mammalian species are not shown. The five pseudogenes shown here are (from A to E) CTA-440B3.1-001 (ENm004, PS), RP11-374F3.2-001 (ENr111, PS), RP11-98F14.4-001 (ENr132, PS), AC087380.17-001 (ENm009, NPS), and AC087380.14-001 (ENm009, NPS).
Discussion
Comparison of different pseudogene annotation methods
In this study, five methods of pseudogene annotations were extensively examined and compared. All methods first defined a set of pseudogene candidates based on their sequence similarity to a parent gene or protein. Empirical evidence or heuristic algorithms were then used to distinguish pseudogenes from gene-like candidates that may have protein coding potential. We found that the quality of the data sets for annotated human genes (or their translated proteins) is the most critical factor leading to inconsistent (likely false) annotation of pseudogenes for two main reasons: firstly, it is vital to be able to distinguish a locus as being either coding or pseudogenic, and secondly, spurious translations have contributed a significant pollution effect to current protein databases (see Supplemental Material for further discussion). This clearly indicates that gene and pseudogene annotation are intertwined and dynamics processes that need to be improved coordinately. In addition, we found that processed pseudogenes are more easily identifiable than nonprocessed pseudogenes, as the former constituted a large part of the common pseudogenes identified by multiple methods.
Our final consensus approach is based on a collection of well-annotated protein sequences. It provides a relatively straightforward way of defining pseudogene boundaries. Although this approach is presented here as a way to integrate pseudogene annotation from different sources, it is by no means restricted to such a usage. It can be easily modified for de novo pseudogene identification and therefore is applicable to the entire human genome and other mammalian genomes. The strategy can be largely implemented through computational programs, but we believe that much manual intervention is necessary for achieving a high-quality annotation, as manual curation allows very detailed investigation, bringing numerous sources of evidence external to the initial prediction to bear—for example, literature reports, mRNA, and examination of parent genes. Manual curation is highly specific (i.e., very few manually curated pseudogenes were rejected from the final consensus set), capable of unraveling complex cases that proved problematic to all the automated methods (e.g., the mitochondrial pseudogenes AC006326.2, 0.3, 0.4, and 0.5 in ENm001) (Fig. 9), and is the most effective method of discriminating processed and nonprocessed pseudogenes. Furthermore, the HAVANA group also produced high-quality annotation for all coding and transcript loci in the ENCODE regions, in addition to pseudogenes (Harrow et al. 2006). The simultaneous annotation of genes and pseudogenes has the advantage of allowing accurate assignment of a locus as coding or not, which is essential in interpreting regional context, for example, identifying coding and pseudogene members of the KIR and LILR gene families in ENm007, a task that proved problematic for all computational methods (Guigó et al. 2006; Harrow et al. 2006).
Figure 9.

Complexity in pseudogene annotation—insertion of one pseudogene into another. A set of “nested” pseudogenes (in green) was found in the ENm001 region with protein homology (shown in blue) supporting the annotation. This arrangement appears to have been generated through the insertion of a heterogeneous nuclear ribonucleoprotein A1 (HNRPA1) processed pseudogene (1) into the genome on the negative strand. This was followed by a second insertion event in which a transcript originating from the mitochondrial genome was transposed into the HNRPA1 pseudogene sequence. Gene order and orientation suggest that this mitochondria-derived sequence has undergone further rearrangement, including deletions, to leave an NADH dehydrogenase 2 (MTND2) pseudogene (2a) and an NADH dehydrogenase 4 (MTND4) pseudogene (2b) on the positive strand and a cytochrome B (CYTB) pseudogene (2c) on the negative strand. A view of the protein alignment for the 5′-end of the HNRPA1 pseudogene (in yellow) is shown with an in-frame stop codon (indicated by *) and a shift from frame +2 to +3 (highlighted by the red box) clearly visible.
Pseudogene activity and functional implications
Using pre-existing transcriptional data, several studies have shown that a good fraction (>5%) of the human pseudogenes were potentially transcribed (Yano et al. 2004; Harrison et al. 2005; Zheng et al. 2005; Frith et al. 2006). Our RACE analysis, which was directly targeted at pseudogene loci, provided experimental evidence that up to 10% of the ENCODE pseudogenes are transcribed in at least one of the 12 human tissues. Moreover, a survey of additional transcription data generated by the ENCODE project increases the estimate of the proportion of pseudogenes that are transcribed to nearly 20%. Comparison of our pseudogenes with putative promoters discovered by ChIP-chip experiments suggested that some transcribed pseudogenes might possess their own promoters. On the other hand, careful examination found a few cases in which pseudogene transcription could have been initiated from the promoters of neighboring genes (e.g., a leukocyte immunoglobulin-like receptor pseudogene at ENm007: 476942–477651) or LINE elements (e.g., a RBPMS processed pseudogene at ENr223: 134009–134631). Such a “co-option” mechanism of pseudogene transcription has been suggested previously (Harrison et al. 2005) and has been experimentally demonstrated for retroposed genes (Bradley et al. 2004; Vinckenbosch et al. 2006). Certainly, recent nonprocessed pseudogenes can be transcriptionally active if the function of their promoters has not been lost entirely.
Although transcription of a pseudogene is not sufficient to indicate whether it has a meaningful biological function, our data showed that pseudogene transcription often occurred at a low level and with a pattern of tissue or cell line specificity. These are similar to the transcriptional characteristics that have been observed for antisense RNA (Dahary et al. 2005; Katayama et al. 2005) and many intronic and intergenic transcripts whose biochemical functions are yet to be unraveled (Bertone et al. 2004; Cheng et al. 2005; Johnson et al. 2005; Willingham and Gingeras 2006). It would not, therefore, be surprising if pseudogenes proved to be one source of novel, functional non-coding RNAs.
We have also investigated the possibility that the ENCODE pseudogenes harbored known ncRNA genes (such as miRNA), but we found no such evidence; however, some nonprocessed pseudogenes were found to contain pseudogenes of ncRNA genes (data not shown).
Pseudogene preservation
The prevalence of pseudogenes in mammalian genomes is itself of considerable interest. It is generally believed that this prevalence relates to increasing retrotransposition activity mediated by LINE (long interspersed elements) or other transposed elements (Brosius 1991; Maestre et al. 1995; Esnault et al. 2000; Long et al. 2003; Marques et al. 2005; Wheelan et al. 2005; Pavlicek et al. 2006). Our first multispecies survey of orthologous sequences for human pseudogenes supports this belief, showing that ∼80% of the human processed pseudogenes arise from retroposed sequences specific to primate lineage. This is in accordance with previous studies suggesting that a burst of retrotransposition events occurred in ancestral primates ∼40–50 Mya (Ohshima et al. 2003; Zhang et al. 2003). Many human retroposed genes also emerged from these events (Marques et al. 2005). Interestingly, the lack of mouse orthologs was used by two research groups as a criterion for assigning human processed pseudogenes (Torrents et al. 2003; van Baren and Brent 2006).
As either measured by sequence preservation or assessment of sequence constraints (either by phastOdds or Ka/Ks ratios), our study indicated that a small number of pseudogenes might have been under evolutionary constraints. Nonprocessed pseudogenes constitute the majority of such candidates. Subsequent detailed examination of evolutionary histories indicated that these are likely recent pseudogenes, deriving from sequences that have spent part of their histories as genes during evolution. In any case, our results strongly support the hypothesis that the sequences for processed pseudogenes are likely dead on arrival or at least lose their protein-coding ability much sooner than those leading to human nonprocessed pseudogenes after their appearances during genome evolution.
Our analyses were based on MSA alignment data, and the possibility exists that our conclusions could be limited by the difficulty in identifying orthologous sequences in species very divergent from human (King et al. 2007; Margulies et al. 2007). For example, the chicken or fish sequences aligned to a human nonprocessed pseudogene may not be orthologous but paralogous sequences from elsewhere in the genome. Therefore, our estimate of primate-specific sequences (for both processed and nonprocessed human pseudogenes) is probably in a lower bound. It is worth mentioning that our analyses with alignment data from a local aligner (TBA) and two global aligners (MAVID and MLAGAN) produced essentially the same results (data not shown), suggesting that our overall conclusions were not subject to the biases of the alignment algorithms. Furthermore, independent support of our results also came from the ENCODE variation group, whose analyses showed that the ENCODE pseudogenes had less nucleotide variation than ancient repeats.
Finally, our study found that the transcribed pseudogenes did not show significantly different evolutionary constraints compared to those not transcribed as measured by Ka/Ks, SNP density (Fig. 7), or sequence similarity with respect to their parental genes (see Supplemental Material). A simple and intuitive inference of these data will thus hypothesize that pseudogene transcription is biological “noise” resulting from stochastic cellular transcription. However, these results do not exclude the possibility that some transcribed pseudogenes play biological roles, since it has been found that many experimentally determined functional elements (e.g., promoters) are not significantly conserved either (The ENCODE Project Consortium 2007). On the other hand, in accordance with our finding, several recent studies have showed that conserved and transcribed pseudogenes are generally exceptional (tens out of thousands of human pseudogenes), but such pseudogenes could be good candidates with biochemical functions (Harrison et al. 2005; Zheng et al. 2005; Svensson et al. 2006).
Scaling pseudogene annotation to the entire human genome
Using semiautomated analyses, we have defined 201 pseudogenes for 1% of the human genome. Interestingly, even with all the caveats of automated computational pipeline, this number agrees remarkably well with the ∼20,000 pseudogenes identified for the whole genome using automated computational pipelines (Torrents et al. 2003; Zhang et al. 2003). However, the population of ENCODE pseudogenes is not necessarily a good representation for the entire genome simply because the regions were specially selected and included some unusually dense clusters of nonprocessed pseudogenes. If we only consider randomly picked targets in the ENCODE regions, there are 59 processed and 15 nonprocessed pseudogenes. This would extrapolate to ∼10,000 pseudogenes in the human genome and thus put us in disagreement with previous reports. One factor contributing to this discrepancy is pseudogene fragments, short pieces of DNA related to protein coding genes and excluded from current analysis. In the future, we will expand our annotation to accommodate such fragments and other pseudogene sequences that have escaped detection currently.
Methods
Pseudogene annotation
Five computational methods were used for identifying pseudogenes in the ENCODE regions. These methods use either protein or nucleotide sequences as queries (referred to as parents) to look for genomic sequences similar to human genes but unlikely to code for a protein product. Details of the computational algorithms and implementations have been presented previously (Harrow et al. 2006; Zheng and Gerstein 2006) or can be found in the Supplemental Material.
Consensus approach for unifying pseudogene annotation
We next developed a consensus approach accommodating the major feature in each of the individual methods. We first compared pseudogenes from the five methods with genes annotated by the GENCODE annotation group (Harrow et al. 2006) and removed pseudogenes that occupied the same genomic position as a coding gene (Note: this happened as the pseudogene annotations were carried out independently of GENCODE gene annotation). This is a quite reasonable step as gene annotation should supersede pseudogene annotation when ambiguity arises, because the former can be tested with biochemical assays, but the latter is more difficult to establish experimentally. The October 2005 release of GENCODE annotation was used. We then made a union of the remaining pseudogenes to eliminate redundancy. A protein from UniProt (Bairoch et al. 2005) was assigned as the parent protein for each pseudogene in the union, and pseudogenes without a recognizable parent protein were discarded. A sequence alignment was subsequently constructed between a pseudogene and its parent protein. This alignment was used to define the genomic boundary of a pseudogene and to distinguish processed from nonprocessed pseudogenes. In the end, all pseudogenes were examined manually by the VEGA/HAVANA annotation team to remove dubious pseudogenes and resolve ambiguous classification. Essentially, the final pseudogenes are genomic loci that cannot produce a protein coding transcript with the following features: (1) containing frameshifts or premature stop codons; (2) truncated fragments of the parent genes without such disablements and unlikely to be part of another gene structure (because they lack evidence of transcription); (3) significant disruption in structure due to rearrangement compared to the parent sequences; or (4) expert advice suggesting that even minor changes in the CDS would abolish function (e.g., in the cases of OR pseudogenes). The separation of processed and nonprocessed pseudogenes followed the general strategy of HAVANA Method (see Supplemental Material).
Pseudogene transcription
The degree of pseudogene transcription was assessed with evidence from multiple sources. Most of the data were obtained from the ENCODE gene and transcript group (The ENCODE Project Consortium 2007). These included transcribed regions (transfrags) identified by tiling microarray-covered nonrepetitive sequences within the ENCODE regions using RNA samples from 11 cell lines or conditions, 5′-specific Cap Analysis Gene Expression (CAGE) tags from 15 tissues (Shiraki et al. 2003), and Paired-End 5′ and 3′ diTags from HCT116 and MCF7 cells (Ng et al. 2005). We also used mRNA/ESTs in public databases as a source of expression evidence. When comparing pseudogenes with transfrags, we would only assign transcription evidence to a pseudogene if at least one of its “exons” overlapped >50 nt of a transfrag. In the analysis of expression tags, a pseudogene was considered to be transcriptionally active if there was a CAGE tag on the same strand near its 5′-end, or if a pair of ditags spanned this pseudogene. In both cases, we only considered tags (5′ or 5′/3′) that were <100 bp from the ends of a pseudogene. Spliced ESTs or mRNAs were assigned to a pseudogene locus only if they were mapped to this region much better (or uniquely) than any other genomic locations of the human genome.
We have also chosen 160 (49 nonprocessed and 111 processed) of our pseudogenes randomly to test for expression by the use of locus-specific RACE/microarray analysis (Kapranov et al. 2005). Poly(A)+ RNA from 12 tissues (brain, colon, heart, kidney, liver, lung, muscle, placenta, small intestine, spleen, stomach, and testis) were extracted and used as substrates for these studies. Primers specific to pseudogenes or with 0∼3 mismatches with their parent genes were used for the RACE experiments. The RACE products were pooled to four groups and then hybridized to ENCODE tiling microarrays. Genomic fragments corresponding to RACE products were identified and called RACEfrags, as described previously (Kapranov et al. 2005). Nonspecific RACEfrags (i.e., present in more than one of the four pools) were discarded. In the meantime, we also scanned all RACEfrags against the entire human genome and kept the “unique” ones, which contained at least one stretch (>25 nt) of nucleotide sequence that did not share >85% sequence identity with a sequence in other genomic locations. We considered a pseudogene to be transcribed if such a unique RACEfrag(s) was detected from the location of RACE primer up to −5 kb upstream of a pseudogene.
Pseudogene conservation and evolutionary history
The preservation of the ENCODE human pseudogenes was assessed using data derived from multispecies sequence alignment constructed by the ENCODE-MSA group (The ENCODE Project Consortium 2007; Margulies et al. 2007). The alignment data were obtained from this site, http://hgdownload.cse.ucsc.edu/goldenPath/hg17/encode/alignments/SEP-2005/, and the MSA alignments were used to infer ortholog assignment for each of our pseudogenes. The alignment block containing a pseudogene was designated as an orthologous region for this pseudogene. A pseudogene (or its exon) was considered as “preserved” in a species if >50 bp and 20% of this pseudogene was aligned to its orthologous sequence from that species. We then computed pairwise sequence identity from the alignment, excluding gaps. Data for other genomic features (e.g., exons, introns, and CDS) were calculated in a similar fashion and are available in the Supplemental Material. For assessing sequence disablements, we aligned a pseudogene or its orthologous sequences to the parent genes using the programs GeneWise (Birney et al. 2004) (for nonprocessed pseudogenes) or FASTA (Pearson et al. 1997) (for processed pseudogenes). In all analyses, disablements were defined as premature stop codons (i.e., nonsense) or frameshift mutations present in the alignment.
SNP data were obtained from the UCSC browser (http://www.genome.ucsc.edu), and Ka/Ks ratios were analyzed by the software package PAML (Yang 1997). Indels were not included in this study.
Acknowledgments
We thank the ENCODE Project Consortium for making their data publicly available; the MSA group for providing the multispecies sequence alignment data; and David Haussler, Elliott H. Margulies, Adam Siepel, and Zhaolei Zhang for valuable discussions and comments. This work has been funded by National Human Genome Research Institute (NHGRI)/National Institutes of Health (NIH) grants to the ENCODE project, especially to the following ENCODE subgroups: GENCODE (U01HG03150), Yale (U01HG03156), and Affymetrix, Inc. (U01HG03147). Portions of this study have also been funded in part with federal funds from the National Cancer Institute (NCI) and NIH under Contract No. N01-CO-12400 (T.R.G.), NCI (NO1-CO-12400/22XS013A) (R.B.), by the Swiss National Science Foundation and the Child Care Foundation (S.E.A and A.R.), and by the Spanish Ministry of Education and Science (R.G.).
Footnotes
[Supplemental material is available online at www.genome.org and http://www.pseudogene.org/ENCODE/supplement/.]
Article is online at http://www.genome.org/cgi/doi/10.1101/gr.5586307
References
- Bairoch A., Apweiler R., Wu C.H., Barker W.C., Boeckmann B., Ferro S., Gasteiger E., Huang H., Lopez R., Magrane M., Apweiler R., Wu C.H., Barker W.C., Boeckmann B., Ferro S., Gasteiger E., Huang H., Lopez R., Magrane M., Wu C.H., Barker W.C., Boeckmann B., Ferro S., Gasteiger E., Huang H., Lopez R., Magrane M., Barker W.C., Boeckmann B., Ferro S., Gasteiger E., Huang H., Lopez R., Magrane M., Boeckmann B., Ferro S., Gasteiger E., Huang H., Lopez R., Magrane M., Ferro S., Gasteiger E., Huang H., Lopez R., Magrane M., Gasteiger E., Huang H., Lopez R., Magrane M., Huang H., Lopez R., Magrane M., Lopez R., Magrane M., Magrane M., et al. The Universal Protein Resource (UniProt) Nucleic Acids Res. 2005;33:D154–D159. doi: 10.1093/nar/gki070. [DOI] [PMC free article] [PubMed] [Google Scholar]
- Balakirev E.S., Ayala F.J., Ayala F.J. Pseudogenes: Are they “junk” or functional DNA? Annu. Rev. Genet. 2003;37:123–151. doi: 10.1146/annurev.genet.37.040103.103949. [DOI] [PubMed] [Google Scholar]
- Bertone P., Stolc V., Royce T.E., Rozowsky J.S., Urban A.E., Zhu X., Rinn J.L., Tongprasit W., Samanta M., Weissman S., Stolc V., Royce T.E., Rozowsky J.S., Urban A.E., Zhu X., Rinn J.L., Tongprasit W., Samanta M., Weissman S., Royce T.E., Rozowsky J.S., Urban A.E., Zhu X., Rinn J.L., Tongprasit W., Samanta M., Weissman S., Rozowsky J.S., Urban A.E., Zhu X., Rinn J.L., Tongprasit W., Samanta M., Weissman S., Urban A.E., Zhu X., Rinn J.L., Tongprasit W., Samanta M., Weissman S., Zhu X., Rinn J.L., Tongprasit W., Samanta M., Weissman S., Rinn J.L., Tongprasit W., Samanta M., Weissman S., Tongprasit W., Samanta M., Weissman S., Samanta M., Weissman S., Weissman S., et al. Global identification of human transcribed sequences with genome tiling arrays. Science. 2004;306:2242–2246. doi: 10.1126/science.1103388. [DOI] [PubMed] [Google Scholar]
- Birney E., Clamp M., Durbin R., Clamp M., Durbin R., Durbin R. GeneWise and Genomewise. Genome Res. 2004;14:988–995. doi: 10.1101/gr.1865504. [DOI] [PMC free article] [PubMed] [Google Scholar]
- Bischof J.M., Chiang A.P., Scheetz T.E., Stone E.M., Casavant T.L., Sheffield V.C., Braun T.A., Chiang A.P., Scheetz T.E., Stone E.M., Casavant T.L., Sheffield V.C., Braun T.A., Scheetz T.E., Stone E.M., Casavant T.L., Sheffield V.C., Braun T.A., Stone E.M., Casavant T.L., Sheffield V.C., Braun T.A., Casavant T.L., Sheffield V.C., Braun T.A., Sheffield V.C., Braun T.A., Braun T.A. Genome-wide identification of pseudogenes capable of disease-causing gene conversion. Hum. Mutat. 2006;27:545–552. doi: 10.1002/humu.20335. [DOI] [PubMed] [Google Scholar]
- Blanchette M., Kent W.J., Riemer C., Elnitski L., Smit A.F., Roskin K.M., Baertsch R., Rosenbloom K., Clawson H., Green E.D., Kent W.J., Riemer C., Elnitski L., Smit A.F., Roskin K.M., Baertsch R., Rosenbloom K., Clawson H., Green E.D., Riemer C., Elnitski L., Smit A.F., Roskin K.M., Baertsch R., Rosenbloom K., Clawson H., Green E.D., Elnitski L., Smit A.F., Roskin K.M., Baertsch R., Rosenbloom K., Clawson H., Green E.D., Smit A.F., Roskin K.M., Baertsch R., Rosenbloom K., Clawson H., Green E.D., Roskin K.M., Baertsch R., Rosenbloom K., Clawson H., Green E.D., Baertsch R., Rosenbloom K., Clawson H., Green E.D., Rosenbloom K., Clawson H., Green E.D., Clawson H., Green E.D., Green E.D., et al. Aligning multiple genomic sequences with the threaded blockset aligner. Genome Res. 2004;14:708–715. doi: 10.1101/gr.1933104. [DOI] [PMC free article] [PubMed] [Google Scholar]
- Bradley J., Baltus A., Skaletsky H., Royce-Tolland M., Dewar K., Page D.C., Baltus A., Skaletsky H., Royce-Tolland M., Dewar K., Page D.C., Skaletsky H., Royce-Tolland M., Dewar K., Page D.C., Royce-Tolland M., Dewar K., Page D.C., Dewar K., Page D.C., Page D.C. An X-to-autosome retrogene is required for spermatogenesis in mice. Nat. Genet. 2004;36:872–876. doi: 10.1038/ng1390. [DOI] [PubMed] [Google Scholar]
- Bray N., Pachter L., Pachter L. MAVID: Constrained ancestral alignment of multiple sequences. Genome Res. 2004;14:693–699. doi: 10.1101/gr.1960404. [DOI] [PMC free article] [PubMed] [Google Scholar]
- Brosius J. Retroposons—Seeds of evolution. Science. 1991;251:753. doi: 10.1126/science.1990437. [DOI] [PubMed] [Google Scholar]
- Brudno M., Do C.B., Cooper G.M., Kim M.F., Davydov E., Green E.D., Sidow A., Batzoglou S., Do C.B., Cooper G.M., Kim M.F., Davydov E., Green E.D., Sidow A., Batzoglou S., Cooper G.M., Kim M.F., Davydov E., Green E.D., Sidow A., Batzoglou S., Kim M.F., Davydov E., Green E.D., Sidow A., Batzoglou S., Davydov E., Green E.D., Sidow A., Batzoglou S., Green E.D., Sidow A., Batzoglou S., Sidow A., Batzoglou S., Batzoglou S. LAGAN and Multi-LAGAN: Efficient tools for large-scale multiple alignment of genomic DNA. Genome Res. 2003;13:721–731. doi: 10.1101/gr.926603. [DOI] [PMC free article] [PubMed] [Google Scholar]
- Bustamante C.D., Nielsen R., Hartl D.L., Nielsen R., Hartl D.L., Hartl D.L. A maximum likelihood method for analyzing pseudogene evolution: Implications for silent site evolution in humans and rodents. Mol. Biol. Evol. 2002;19:110–117. doi: 10.1093/oxfordjournals.molbev.a003975. [DOI] [PubMed] [Google Scholar]
- Cheng J., Kapranov P., Drenkow J., Dike S., Brubaker S., Patel S., Long J., Stern D., Tammana H., Helt G., Kapranov P., Drenkow J., Dike S., Brubaker S., Patel S., Long J., Stern D., Tammana H., Helt G., Drenkow J., Dike S., Brubaker S., Patel S., Long J., Stern D., Tammana H., Helt G., Dike S., Brubaker S., Patel S., Long J., Stern D., Tammana H., Helt G., Brubaker S., Patel S., Long J., Stern D., Tammana H., Helt G., Patel S., Long J., Stern D., Tammana H., Helt G., Long J., Stern D., Tammana H., Helt G., Stern D., Tammana H., Helt G., Tammana H., Helt G., Helt G., et al. Transcriptional maps of 10 human chromosomes at 5-nucleotide resolution. Science. 2005;308:1149–1154. doi: 10.1126/science.1108625. [DOI] [PubMed] [Google Scholar]
- Chimpanzee Sequencing and Analysis Consortium. Initial sequence of the chimpanzee genome and comparison with the human genome. Nature. 2005;437:69–87. doi: 10.1038/nature04072. [DOI] [PubMed] [Google Scholar]
- Coin L., Durbin R., Durbin R. Improved techniques for the identification of pseudogenes. Bioinformatics. 2004;20(Suppl 1):I94–I100. doi: 10.1093/bioinformatics/bth942. [DOI] [PubMed] [Google Scholar]
- Dahary D., Elroy-Stein O., Sorek R., Elroy-Stein O., Sorek R., Sorek R. Naturally occurring antisense: Transcriptional leakage or real overlap? Genome Res. 2005;15:364–368. doi: 10.1101/gr.3308405. [DOI] [PMC free article] [PubMed] [Google Scholar]
- Denoeud F., Kapranov P., Ucla C., Frankish A., Castelo R., Drenkow J., Lagarde J., Alioto T., Manzano C., Chrast J., Kapranov P., Ucla C., Frankish A., Castelo R., Drenkow J., Lagarde J., Alioto T., Manzano C., Chrast J., Ucla C., Frankish A., Castelo R., Drenkow J., Lagarde J., Alioto T., Manzano C., Chrast J., Frankish A., Castelo R., Drenkow J., Lagarde J., Alioto T., Manzano C., Chrast J., Castelo R., Drenkow J., Lagarde J., Alioto T., Manzano C., Chrast J., Drenkow J., Lagarde J., Alioto T., Manzano C., Chrast J., Lagarde J., Alioto T., Manzano C., Chrast J., Alioto T., Manzano C., Chrast J., Manzano C., Chrast J., Chrast J., et al. Prominent use of distal 5′ transcription start sites and discovery of a large number of additional exons in ENCODE regions. Genome Res. 2007 doi: 10.1101/gr5660607. (this issue) [DOI] [PMC free article] [PubMed] [Google Scholar]
- The ENCODE Project Consortium, The ENCODE (ENCyclopedia Of DNA Elements) Project. Science. 2004;306:636–640. doi: 10.1126/science.1105136. [DOI] [PubMed] [Google Scholar]
- The ENCODE Project Consortium, Identification and analysis of functional elements in 1% of the human genome by the ENCODE pilot project. Nature. 2007 doi: 10.1038/nature05874. (in press) [DOI] [PMC free article] [PubMed] [Google Scholar]
- Esnault C., Maestre J., Heidmann T., Maestre J., Heidmann T., Heidmann T. Human LINE retrotransposons generate processed pseudogenes. Nat. Genet. 2000;24:363–367. doi: 10.1038/74184. [DOI] [PubMed] [Google Scholar]
- Frith M.C., Wilming L.G., Forrest A., Kawaji H., Tan S.L., Wahlestedt C., Bajic V.B., Kai C., Kawai J., Carninci P., Wilming L.G., Forrest A., Kawaji H., Tan S.L., Wahlestedt C., Bajic V.B., Kai C., Kawai J., Carninci P., Forrest A., Kawaji H., Tan S.L., Wahlestedt C., Bajic V.B., Kai C., Kawai J., Carninci P., Kawaji H., Tan S.L., Wahlestedt C., Bajic V.B., Kai C., Kawai J., Carninci P., Tan S.L., Wahlestedt C., Bajic V.B., Kai C., Kawai J., Carninci P., Wahlestedt C., Bajic V.B., Kai C., Kawai J., Carninci P., Bajic V.B., Kai C., Kawai J., Carninci P., Kai C., Kawai J., Carninci P., Kawai J., Carninci P., Carninci P., et al. Pseudo-messenger RNA: Phantoms of the transcriptome. PLoS Genet. 2006;2:e23. doi: 10.1371/journal.pgen.0020023. [DOI] [PMC free article] [PubMed] [Google Scholar]
- Gilad Y., Man O., Glusman G., Man O., Glusman G., Glusman G. A comparison of the human and chimpanzee olfactory receptor gene repertoires. Genome Res. 2005;15:224–230. doi: 10.1101/gr.2846405. [DOI] [PMC free article] [PubMed] [Google Scholar]
- Glusman G., Yanai I., Rubin I., Lancet D., Yanai I., Rubin I., Lancet D., Rubin I., Lancet D., Lancet D. The complete human olfactory subgenome. Genome Res. 2001;11:685–702. doi: 10.1101/gr.171001. [DOI] [PubMed] [Google Scholar]
- Gojobori T., Ishii K., Nei M., Ishii K., Nei M., Nei M. Estimation of average number of nucleotide substitutions when the rate of substitution varies with nucleotide. J. Mol. Evol. 1982;18:414–423. doi: 10.1007/BF01840889. [DOI] [PubMed] [Google Scholar]
- Goodman M. The genomic record of humankind’s evolutionary roots. Am. J. Hum. Genet. 1999;64:31–39. doi: 10.1086/302218. [DOI] [PMC free article] [PubMed] [Google Scholar]
- Goodman M., Porter C.A., Czelusniak J., Page S.L., Schneider H., Shoshani J., Gunnell G., Groves C.P., Porter C.A., Czelusniak J., Page S.L., Schneider H., Shoshani J., Gunnell G., Groves C.P., Czelusniak J., Page S.L., Schneider H., Shoshani J., Gunnell G., Groves C.P., Page S.L., Schneider H., Shoshani J., Gunnell G., Groves C.P., Schneider H., Shoshani J., Gunnell G., Groves C.P., Shoshani J., Gunnell G., Groves C.P., Gunnell G., Groves C.P., Groves C.P. Toward a phylogenetic classification of primates based on DNA evidence complemented by fossil evidence. Mol. Phylogenet. Evol. 1998;9:585–598. doi: 10.1006/mpev.1998.0495. [DOI] [PubMed] [Google Scholar]
- Gu X., Li W.H., Li W.H. The size distribution of insertions and deletions in human and rodent pseudogenes suggests the logarithmic gap penalty for sequence alignment. J. Mol. Evol. 1995;40:464–473. doi: 10.1007/BF00164032. [DOI] [PubMed] [Google Scholar]
- Guigó R., Flicek P., Abril J.F., Reymond A., Lagarde J., Denoeud F., Antonarakis S.E., Ashburner M., Bajic V.B., Birney E., Flicek P., Abril J.F., Reymond A., Lagarde J., Denoeud F., Antonarakis S.E., Ashburner M., Bajic V.B., Birney E., Abril J.F., Reymond A., Lagarde J., Denoeud F., Antonarakis S.E., Ashburner M., Bajic V.B., Birney E., Reymond A., Lagarde J., Denoeud F., Antonarakis S.E., Ashburner M., Bajic V.B., Birney E., Lagarde J., Denoeud F., Antonarakis S.E., Ashburner M., Bajic V.B., Birney E., Denoeud F., Antonarakis S.E., Ashburner M., Bajic V.B., Birney E., Antonarakis S.E., Ashburner M., Bajic V.B., Birney E., Ashburner M., Bajic V.B., Birney E., Bajic V.B., Birney E., Birney E., et al. EGASP: The human ENCODE genome annotation assessment project. Genome Biol. 2006;7:S2. doi: 10.1186/gb-2006-7-s1-s2. [DOI] [PMC free article] [PubMed] [Google Scholar]
- Harrison P.M., Hegyi H., Balasubramanian S., Luscombe N.M., Bertone P., Echols N., Johnson T., Gerstein M., Hegyi H., Balasubramanian S., Luscombe N.M., Bertone P., Echols N., Johnson T., Gerstein M., Balasubramanian S., Luscombe N.M., Bertone P., Echols N., Johnson T., Gerstein M., Luscombe N.M., Bertone P., Echols N., Johnson T., Gerstein M., Bertone P., Echols N., Johnson T., Gerstein M., Echols N., Johnson T., Gerstein M., Johnson T., Gerstein M., Gerstein M. Molecular fossils in the human genome: Identification and analysis of the pseudogenes in chromosomes 21 and 22. Genome Res. 2002;12:272–280. doi: 10.1101/gr.207102. [DOI] [PMC free article] [PubMed] [Google Scholar]
- Harrison P.M., Zheng D., Zhang Z., Carriero N., Gerstein M., Zheng D., Zhang Z., Carriero N., Gerstein M., Zhang Z., Carriero N., Gerstein M., Carriero N., Gerstein M., Gerstein M. Transcribed processed pseudogenes in the human genome: An intermediate form of expressed retrosequence lacking protein-coding ability. Nucleic Acids Res. 2005;33:2374–2383. doi: 10.1093/nar/gki531. [DOI] [PMC free article] [PubMed] [Google Scholar]
- Harrow J., Denoeud F., Frankish A., Reymond A., Chen C.K., Chrast J., Lagarde J., Gilbert J.G., Storey R., Swarbreck D., Denoeud F., Frankish A., Reymond A., Chen C.K., Chrast J., Lagarde J., Gilbert J.G., Storey R., Swarbreck D., Frankish A., Reymond A., Chen C.K., Chrast J., Lagarde J., Gilbert J.G., Storey R., Swarbreck D., Reymond A., Chen C.K., Chrast J., Lagarde J., Gilbert J.G., Storey R., Swarbreck D., Chen C.K., Chrast J., Lagarde J., Gilbert J.G., Storey R., Swarbreck D., Chrast J., Lagarde J., Gilbert J.G., Storey R., Swarbreck D., Lagarde J., Gilbert J.G., Storey R., Swarbreck D., Gilbert J.G., Storey R., Swarbreck D., Storey R., Swarbreck D., Swarbreck D., et al. GENCODE: Producing a reference annotation for ENCODE. Genome Biol. 2006;7:S4.1–S9. doi: 10.1186/gb-2006-7-s1-s4. [DOI] [PMC free article] [PubMed] [Google Scholar]
- Hurteau G.J., Spivack S.D., Spivack S.D. mRNA-specific reverse transcription-polymerase chain reaction from human tissue extracts. Anal. Biochem. 2002;307:304–315. doi: 10.1016/s0003-2697(02)00058-1. [DOI] [PubMed] [Google Scholar]
- Johnson J.M., Edwards S., Shoemaker D., Schadt E.E., Edwards S., Shoemaker D., Schadt E.E., Shoemaker D., Schadt E.E., Schadt E.E. Dark matter in the genome: Evidence of widespread transcription detected by microarray tiling experiments. Trends Genet. 2005;21:93–102. doi: 10.1016/j.tig.2004.12.009. [DOI] [PubMed] [Google Scholar]
- Jurka J. Sequence patterns indicate an enzymatic involvement in integration of mammalian retroposons. Proc. Natl. Acad. Sci. 1997;94:1872–1877. doi: 10.1073/pnas.94.5.1872. [DOI] [PMC free article] [PubMed] [Google Scholar]
- Kapranov P., Drenkow J., Cheng J., Long J., Helt G., Dike S., Gingeras T.R., Drenkow J., Cheng J., Long J., Helt G., Dike S., Gingeras T.R., Cheng J., Long J., Helt G., Dike S., Gingeras T.R., Long J., Helt G., Dike S., Gingeras T.R., Helt G., Dike S., Gingeras T.R., Dike S., Gingeras T.R., Gingeras T.R. Examples of the complex architecture of the human transcriptome revealed by RACE and high-density tiling arrays. Genome Res. 2005;15:987–997. doi: 10.1101/gr.3455305. [DOI] [PMC free article] [PubMed] [Google Scholar]
- Katayama S., Tomaru Y., Kasukawa T., Waki K., Nakanishi M., Nakamura M., Nishida H., Yap C.C., Suzuki M., Kawai J., Tomaru Y., Kasukawa T., Waki K., Nakanishi M., Nakamura M., Nishida H., Yap C.C., Suzuki M., Kawai J., Kasukawa T., Waki K., Nakanishi M., Nakamura M., Nishida H., Yap C.C., Suzuki M., Kawai J., Waki K., Nakanishi M., Nakamura M., Nishida H., Yap C.C., Suzuki M., Kawai J., Nakanishi M., Nakamura M., Nishida H., Yap C.C., Suzuki M., Kawai J., Nakamura M., Nishida H., Yap C.C., Suzuki M., Kawai J., Nishida H., Yap C.C., Suzuki M., Kawai J., Yap C.C., Suzuki M., Kawai J., Suzuki M., Kawai J., Kawai J., et al. Antisense transcription in the mammalian transcriptome. Science. 2005;309:1564–1566. doi: 10.1126/science.1112009. [DOI] [PubMed] [Google Scholar]
- Kenmochi N., Kawaguchi T., Rozen S., Davis E., Goodman N., Hudson T.J., Tanaka T., Page D.C., Kawaguchi T., Rozen S., Davis E., Goodman N., Hudson T.J., Tanaka T., Page D.C., Rozen S., Davis E., Goodman N., Hudson T.J., Tanaka T., Page D.C., Davis E., Goodman N., Hudson T.J., Tanaka T., Page D.C., Goodman N., Hudson T.J., Tanaka T., Page D.C., Hudson T.J., Tanaka T., Page D.C., Tanaka T., Page D.C., Page D.C. A map of 75 human ribosomal protein genes. Genome Res. 1998;8:509–523. doi: 10.1101/gr.8.5.509. [DOI] [PubMed] [Google Scholar]
- Khelifi A., Duret L., Mouchiroud D., Duret L., Mouchiroud D., Mouchiroud D. HOPPSIGEN: A database of human and mouse processed pseudogenes. Nucleic Acids Res. 2005;33:D59–D66. doi: 10.1093/nar/gki084. [DOI] [PMC free article] [PubMed] [Google Scholar]
- King D.C., Taylor J., Zhang Y., Cheng Y., Lawson H.A., Martin J., Chiaromonte F., Miller W., Hardison R.C., Taylor J., Zhang Y., Cheng Y., Lawson H.A., Martin J., Chiaromonte F., Miller W., Hardison R.C., Zhang Y., Cheng Y., Lawson H.A., Martin J., Chiaromonte F., Miller W., Hardison R.C., Cheng Y., Lawson H.A., Martin J., Chiaromonte F., Miller W., Hardison R.C., Lawson H.A., Martin J., Chiaromonte F., Miller W., Hardison R.C., Martin J., Chiaromonte F., Miller W., Hardison R.C., and ENCODE groups for Transcriptional Regulation Multispecies Alignment, Chiaromonte F., Miller W., Hardison R.C., Miller W., Hardison R.C., Hardison R.C. Genome. Res. 2007. Finding cis-regulatory elements using comparative genomics: Some lessons from ENCODE data. (this issue) [DOI] [PMC free article] [PubMed] [Google Scholar]
- Kleene K.C., Mulligan E., Steiger D., Donohue K., Mastrangelo M.A., Mulligan E., Steiger D., Donohue K., Mastrangelo M.A., Steiger D., Donohue K., Mastrangelo M.A., Donohue K., Mastrangelo M.A., Mastrangelo M.A. The mouse gene encoding the testis-specific isoform of Poly(A) binding protein (Pabp2) is an expressed retroposon: Intimations that gene expression in spermatogenic cells facilitates the creation of new genes. J. Mol. Evol. 1998;47:275–281. doi: 10.1007/pl00006385. [DOI] [PubMed] [Google Scholar]
- Korneev S.A., Park J.H., O’Shea M., Park J.H., O’Shea M., O’Shea M. Neuronal expression of neural nitric oxide synthase (nNOS) protein is suppressed by an antisense RNA transcribed from an NOS pseudogene. J. Neurosci. 1999;19:7711–7720. doi: 10.1523/JNEUROSCI.19-18-07711.1999. [DOI] [PMC free article] [PubMed] [Google Scholar]
- Lander E.S., Linton L.M., Birren B., Nusbaum C., Zody M.C., Baldwin J., Devon K., Dewar K., Doyle M., Fitzhugh W., Linton L.M., Birren B., Nusbaum C., Zody M.C., Baldwin J., Devon K., Dewar K., Doyle M., Fitzhugh W., Birren B., Nusbaum C., Zody M.C., Baldwin J., Devon K., Dewar K., Doyle M., Fitzhugh W., Nusbaum C., Zody M.C., Baldwin J., Devon K., Dewar K., Doyle M., Fitzhugh W., Zody M.C., Baldwin J., Devon K., Dewar K., Doyle M., Fitzhugh W., Baldwin J., Devon K., Dewar K., Doyle M., Fitzhugh W., Devon K., Dewar K., Doyle M., Fitzhugh W., Dewar K., Doyle M., Fitzhugh W., Doyle M., Fitzhugh W., Fitzhugh W., et al. Initial sequencing and analysis of the human genome. Nature. 2001;409:860–921. doi: 10.1038/35057062. [DOI] [PubMed] [Google Scholar]
- Li W.H., Gojobori T., Nei M., Gojobori T., Nei M., Nei M. Pseudogenes as a paradigm of neutral evolution. Nature. 1981;292:237–239. doi: 10.1038/292237a0. [DOI] [PubMed] [Google Scholar]
- Li W.H., Wu C.I., Luo C.C., Wu C.I., Luo C.C., Luo C.C. Nonrandomness of point mutation as reflected in nucleotide substitutions in pseudogenes and its evolutionary implications. J. Mol. Evol. 1984;21:58–71. doi: 10.1007/BF02100628. [DOI] [PubMed] [Google Scholar]
- Lindblad-Toh K., Wade C.M., Mikkelsen T.S., Karlsson E.K., Jaffe D.B., Kamal M., Clamp M., Chang J.L., Kulbokas E.J., III, Zody M.C., Wade C.M., Mikkelsen T.S., Karlsson E.K., Jaffe D.B., Kamal M., Clamp M., Chang J.L., Kulbokas E.J., III, Zody M.C., Mikkelsen T.S., Karlsson E.K., Jaffe D.B., Kamal M., Clamp M., Chang J.L., Kulbokas E.J., III, Zody M.C., Karlsson E.K., Jaffe D.B., Kamal M., Clamp M., Chang J.L., Kulbokas E.J., III, Zody M.C., Jaffe D.B., Kamal M., Clamp M., Chang J.L., Kulbokas E.J., III, Zody M.C., Kamal M., Clamp M., Chang J.L., Kulbokas E.J., III, Zody M.C., Clamp M., Chang J.L., Kulbokas E.J., III, Zody M.C., Chang J.L., Kulbokas E.J., III, Zody M.C., Kulbokas E.J., III, Zody M.C., Zody M.C., et al. Genome sequence, comparative analysis and haplotype structure of the domestic dog. Nature. 2005;438:803–819. doi: 10.1038/nature04338. [DOI] [PubMed] [Google Scholar]
- Long M., Betran E., Thornton K., Wang W., Betran E., Thornton K., Wang W., Thornton K., Wang W., Wang W. The origin of new genes: Glimpses from the young and old. Nat. Rev. Genet. 2003;4:865–875. doi: 10.1038/nrg1204. [DOI] [PubMed] [Google Scholar]
- Maestre J., Tchenio T., Dhellin O., Heidmann T., Tchenio T., Dhellin O., Heidmann T., Dhellin O., Heidmann T., Heidmann T. mRNA retroposition in human cells: Processed pseudogene formation. EMBO J. 1995;14:6333–6338. doi: 10.1002/j.1460-2075.1995.tb00324.x. [DOI] [PMC free article] [PubMed] [Google Scholar]
- Margulies E.H., Cooper G.M., Asimenos G., Thomas D.J., Dewey C.N., Siepel A., Birney E., Keefe D., Schwartz A.S., Hou M., Cooper G.M., Asimenos G., Thomas D.J., Dewey C.N., Siepel A., Birney E., Keefe D., Schwartz A.S., Hou M., Asimenos G., Thomas D.J., Dewey C.N., Siepel A., Birney E., Keefe D., Schwartz A.S., Hou M., Thomas D.J., Dewey C.N., Siepel A., Birney E., Keefe D., Schwartz A.S., Hou M., Dewey C.N., Siepel A., Birney E., Keefe D., Schwartz A.S., Hou M., Siepel A., Birney E., Keefe D., Schwartz A.S., Hou M., Birney E., Keefe D., Schwartz A.S., Hou M., Keefe D., Schwartz A.S., Hou M., Schwartz A.S., Hou M., Hou M., et al. Analyses of deep mammalian sequence alignments and constraint predictions for 1% of the human genome. Genome Res. 2007 doi: 10.1101/gr.6034307. (this issue) [DOI] [PMC free article] [PubMed] [Google Scholar]
- Marques A.C., Dupanloup I., Vinckenbosch N., Reymond A., Kaessmann H., Dupanloup I., Vinckenbosch N., Reymond A., Kaessmann H., Vinckenbosch N., Reymond A., Kaessmann H., Reymond A., Kaessmann H., Kaessmann H. Emergence of young human genes after a burst of retroposition in primates. PLoS Biol. 2005;3:e357. doi: 10.1371/journal.pbio.0030357. [DOI] [PMC free article] [PubMed] [Google Scholar]
- Mighell A.J., Smith N.R., Robinson P.A., Markham A.F., Smith N.R., Robinson P.A., Markham A.F., Robinson P.A., Markham A.F., Markham A.F. Vertebrate pseudogenes. FEBS Lett. 2000;468:109–114. doi: 10.1016/s0014-5793(00)01199-6. [DOI] [PubMed] [Google Scholar]
- Ng P., Wei C.L., Sung W.K., Chiu K.P., Lipovich L., Ang C.C., Gupta S., Shahab A., Ridwan A., Wong C.H., Wei C.L., Sung W.K., Chiu K.P., Lipovich L., Ang C.C., Gupta S., Shahab A., Ridwan A., Wong C.H., Sung W.K., Chiu K.P., Lipovich L., Ang C.C., Gupta S., Shahab A., Ridwan A., Wong C.H., Chiu K.P., Lipovich L., Ang C.C., Gupta S., Shahab A., Ridwan A., Wong C.H., Lipovich L., Ang C.C., Gupta S., Shahab A., Ridwan A., Wong C.H., Ang C.C., Gupta S., Shahab A., Ridwan A., Wong C.H., Gupta S., Shahab A., Ridwan A., Wong C.H., Shahab A., Ridwan A., Wong C.H., Ridwan A., Wong C.H., Wong C.H., et al. Gene identification signature (GIS) analysis for transcriptome characterization and genome annotation. Nat. Methods. 2005;2:105–111. doi: 10.1038/nmeth733. [DOI] [PubMed] [Google Scholar]
- Ohshima K., Hattori M., Yada T., Gojobori T., Sakaki Y., Okada N., Hattori M., Yada T., Gojobori T., Sakaki Y., Okada N., Yada T., Gojobori T., Sakaki Y., Okada N., Gojobori T., Sakaki Y., Okada N., Sakaki Y., Okada N., Okada N. Whole-genome screening indicates a possible burst of formation of processed pseudogenes and Alu repeats by particular L1 subfamilies in ancestral primates. Genome Biol. 2003;4:R74. doi: 10.1186/gb-2003-4-11-r74. [DOI] [PMC free article] [PubMed] [Google Scholar]
- Ota T., Nei M., Nei M. Evolution of immunoglobulin VH pseudogenes in chickens. Mol. Biol. Evol. 1995;12:94–102. doi: 10.1093/oxfordjournals.molbev.a040194. [DOI] [PubMed] [Google Scholar]
- Pavlicek A., Gentles A.J., Paces J., Paces V., Jurka J., Gentles A.J., Paces J., Paces V., Jurka J., Paces J., Paces V., Jurka J., Paces V., Jurka J., Jurka J. Retroposition of processed pseudogenes: The impact of RNA stability and translational control. Trends Genet. 2006;22:69–73. doi: 10.1016/j.tig.2005.11.005. [DOI] [PMC free article] [PubMed] [Google Scholar]
- Pearson W.R., Wood T., Zhang Z., Miller W., Wood T., Zhang Z., Miller W., Zhang Z., Miller W., Miller W. Comparison of DNA sequences with protein sequences. Genomics. 1997;46:24–36. doi: 10.1006/geno.1997.4995. [DOI] [PubMed] [Google Scholar]
- Reymond A., Marigo V., Yaylaoglu M.B., Leoni A., Ucla C., Scamuffa N., Caccioppoli C., Dermitzakis E.T., Lyle R., Banfi S., Marigo V., Yaylaoglu M.B., Leoni A., Ucla C., Scamuffa N., Caccioppoli C., Dermitzakis E.T., Lyle R., Banfi S., Yaylaoglu M.B., Leoni A., Ucla C., Scamuffa N., Caccioppoli C., Dermitzakis E.T., Lyle R., Banfi S., Leoni A., Ucla C., Scamuffa N., Caccioppoli C., Dermitzakis E.T., Lyle R., Banfi S., Ucla C., Scamuffa N., Caccioppoli C., Dermitzakis E.T., Lyle R., Banfi S., Scamuffa N., Caccioppoli C., Dermitzakis E.T., Lyle R., Banfi S., Caccioppoli C., Dermitzakis E.T., Lyle R., Banfi S., Dermitzakis E.T., Lyle R., Banfi S., Lyle R., Banfi S., Banfi S., et al. Human chromosome 21 gene expression atlas in the mouse. Nature. 2002;420:582–586. doi: 10.1038/nature01178. [DOI] [PubMed] [Google Scholar]
- Ruud P., Fodstad O., Hovig E., Fodstad O., Hovig E., Hovig E. Identification of a novel cytokeratin 19 pseudogene that may interfere with reverse transcriptase-polymerase chain reaction assays used to detect micrometastatic tumor cells. Int. J. Cancer. 1999;80:119–125. doi: 10.1002/(sici)1097-0215(19990105)80:1<119::aid-ijc22>3.0.co;2-x. [DOI] [PubMed] [Google Scholar]
- Schmitz J., Churakov G., Zischler H., Brosius J., Churakov G., Zischler H., Brosius J., Zischler H., Brosius J., Brosius J. A novel class of mammalian-specific tailless retropseudogenes. Genome Res. 2004;14:1911–1915. doi: 10.1101/gr.2720104. [DOI] [PMC free article] [PubMed] [Google Scholar]
- Shemesh R., Novik A., Edelheit S., Sorek R., Novik A., Edelheit S., Sorek R., Edelheit S., Sorek R., Sorek R. Genomic fossils as a snapshot of the human transcriptome. Proc. Natl. Acad. Sci. 2006;103:1364–1369. doi: 10.1073/pnas.0509330103. [DOI] [PMC free article] [PubMed] [Google Scholar]
- Shiraki T., Kondo S., Katayama S., Waki K., Kasukawa T., Kawaji H., Kodzius R., Watahiki A., Nakamura M., Arakawa T., Kondo S., Katayama S., Waki K., Kasukawa T., Kawaji H., Kodzius R., Watahiki A., Nakamura M., Arakawa T., Katayama S., Waki K., Kasukawa T., Kawaji H., Kodzius R., Watahiki A., Nakamura M., Arakawa T., Waki K., Kasukawa T., Kawaji H., Kodzius R., Watahiki A., Nakamura M., Arakawa T., Kasukawa T., Kawaji H., Kodzius R., Watahiki A., Nakamura M., Arakawa T., Kawaji H., Kodzius R., Watahiki A., Nakamura M., Arakawa T., Kodzius R., Watahiki A., Nakamura M., Arakawa T., Watahiki A., Nakamura M., Arakawa T., Nakamura M., Arakawa T., Arakawa T., et al. Cap analysis gene expression for high-throughput analysis of transcriptional starting point and identification of promoter usage. Proc. Natl. Acad. Sci. 2003;100:15776–15781. doi: 10.1073/pnas.2136655100. [DOI] [PMC free article] [PubMed] [Google Scholar]
- Siepel A., Bejerano G., Pedersen J.S., Hinrichs A.S., Hou M., Rosenbloom K., Clawson H., Spieth J., Hillier L.W., Richards S., Bejerano G., Pedersen J.S., Hinrichs A.S., Hou M., Rosenbloom K., Clawson H., Spieth J., Hillier L.W., Richards S., Pedersen J.S., Hinrichs A.S., Hou M., Rosenbloom K., Clawson H., Spieth J., Hillier L.W., Richards S., Hinrichs A.S., Hou M., Rosenbloom K., Clawson H., Spieth J., Hillier L.W., Richards S., Hou M., Rosenbloom K., Clawson H., Spieth J., Hillier L.W., Richards S., Rosenbloom K., Clawson H., Spieth J., Hillier L.W., Richards S., Clawson H., Spieth J., Hillier L.W., Richards S., Spieth J., Hillier L.W., Richards S., Hillier L.W., Richards S., Richards S., et al. Evolutionarily conserved elements in vertebrate, insect, worm, and yeast genomes. Genome Res. 2005;15:1034–1050. doi: 10.1101/gr.3715005. [DOI] [PMC free article] [PubMed] [Google Scholar]
- Smith R.D., Ogden C.W., Penny M.A., Ogden C.W., Penny M.A., Penny M.A. Exclusive amplification of cDNA template (EXACT) RT-PCR to avoid amplifying contaminating genomic pseudogenes. Biotechniques. 2001;31:776–782. doi: 10.2144/01314st03. [DOI] [PubMed] [Google Scholar]
- Strichman-Almashanu L.Z., Bustin M., Landsman D., Bustin M., Landsman D., Landsman D. Retroposed copies of the HMG genes: A window to genome dynamics. Genome Res. 2003;13:800–812. doi: 10.1101/gr.893803. [DOI] [PMC free article] [PubMed] [Google Scholar]
- Svensson O., Arvestad L., Lagergren J., Arvestad L., Lagergren J., Lagergren J. Genome-wide survey for biologically functional pseudogenes. PLoS Comput. Biol. 2006;2:e46. doi: 10.1371/journal.pcbi.0020046. [DOI] [PMC free article] [PubMed] [Google Scholar]
- Torrents D., Suyama M., Zdobnov E., Bork P., Suyama M., Zdobnov E., Bork P., Zdobnov E., Bork P., Bork P. A genome-wide survey of human pseudogenes. Genome Res. 2003;13:2559–2567. doi: 10.1101/gr.1455503. [DOI] [PMC free article] [PubMed] [Google Scholar]
- Trinklein N.D., Karaöz U., Wu J., Halees A., Force Aldred S., Collins P.J., Zheng D., Zhang Z.D., Gerstein M., Snyder M., Karaöz U., Wu J., Halees A., Force Aldred S., Collins P.J., Zheng D., Zhang Z.D., Gerstein M., Snyder M., Wu J., Halees A., Force Aldred S., Collins P.J., Zheng D., Zhang Z.D., Gerstein M., Snyder M., Halees A., Force Aldred S., Collins P.J., Zheng D., Zhang Z.D., Gerstein M., Snyder M., Force Aldred S., Collins P.J., Zheng D., Zhang Z.D., Gerstein M., Snyder M., Collins P.J., Zheng D., Zhang Z.D., Gerstein M., Snyder M., Zheng D., Zhang Z.D., Gerstein M., Snyder M., Zhang Z.D., Gerstein M., Snyder M., Gerstein M., Snyder M., Snyder M., et al. Integrated analysis of experimental data sets reveals many novel promoters in 1% of the human genome. Genome Res. 2007 doi: 10.1101/gr5716607. (this issue) [DOI] [PMC free article] [PubMed] [Google Scholar]
- van Baren M.J., Brent M.R., Brent M.R. Iterative gene prediction and pseudogene removal improves genome annotation. Genome Res. 2006;16:678–685. doi: 10.1101/gr.4766206. [DOI] [PMC free article] [PubMed] [Google Scholar]
- Vanin E.F. Processed pseudogenes: Characteristics and evolution. Annu. Rev. Genet. 1985;19:253–272. doi: 10.1146/annurev.ge.19.120185.001345. [DOI] [PubMed] [Google Scholar]
- Vinckenbosch N., Dupanloup I., Kaessmann H., Dupanloup I., Kaessmann H., Kaessmann H. Evolutionary fate of retroposed gene copies in the human genome. Proc. Natl. Acad. Sci. 2006;103:3220–3225. doi: 10.1073/pnas.0511307103. [DOI] [PMC free article] [PubMed] [Google Scholar]
- Wheelan S.J., Aizawa Y., Han J.S., Boeke J.D., Aizawa Y., Han J.S., Boeke J.D., Han J.S., Boeke J.D., Boeke J.D. Gene-breaking: A new paradigm for human retrotransposon-mediated gene evolution. Genome Res. 2005;15:1073–1078. doi: 10.1101/gr.3688905. [DOI] [PMC free article] [PubMed] [Google Scholar]
- Willingham A.T., Gingeras T.R., Gingeras T.R. TUF love for “junk” DNA. Cell. 2006;125:1215–1220. doi: 10.1016/j.cell.2006.06.009. [DOI] [PubMed] [Google Scholar]
- Yang Z. PAML: A program package for phylogenetic analysis by maximum likelihood. Comput. Appl. Biosci. 1997;13:555–556. doi: 10.1093/bioinformatics/13.5.555. [DOI] [PubMed] [Google Scholar]
- Yano Y., Saito R., Yoshida N., Yoshiki A., Wynshaw-Boris A., Tomita M., Hirotsune S., Saito R., Yoshida N., Yoshiki A., Wynshaw-Boris A., Tomita M., Hirotsune S., Yoshida N., Yoshiki A., Wynshaw-Boris A., Tomita M., Hirotsune S., Yoshiki A., Wynshaw-Boris A., Tomita M., Hirotsune S., Wynshaw-Boris A., Tomita M., Hirotsune S., Tomita M., Hirotsune S., Hirotsune S. A new role for expressed pseudogenes as ncRNA: Regulation of mRNA stability of its homologous coding gene. J. Mol. Med. 2004;82:414–422. doi: 10.1007/s00109-004-0550-3. [DOI] [PubMed] [Google Scholar]
- Zhang Z., Gerstein M., Gerstein M. Patterns of nucleotide substitution, insertion and deletion in the human genome inferred from pseudogenes. Nucleic Acids Res. 2003;31:5338–5348. doi: 10.1093/nar/gkg745. [DOI] [PMC free article] [PubMed] [Google Scholar]
- Zhang Z., Gerstein M., Gerstein M. Large-scale analysis of pseudogenes in the human genome. Curr. Opin. Genet. Dev. 2004;14:328–335. doi: 10.1016/j.gde.2004.06.003. [DOI] [PubMed] [Google Scholar]
- Zhang Z., Harrison P.M., Liu Y., Gerstein M., Harrison P.M., Liu Y., Gerstein M., Liu Y., Gerstein M., Gerstein M. Millions of years of evolution preserved: A comprehensive catalog of the processed pseudogenes in the human genome. Genome Res. 2003;13:2541–2558. doi: 10.1101/gr.1429003. [DOI] [PMC free article] [PubMed] [Google Scholar]
- Zhang Z., Carriero N., Zheng D., Karro J., Harrison P.M., Gerstein M., Carriero N., Zheng D., Karro J., Harrison P.M., Gerstein M., Zheng D., Karro J., Harrison P.M., Gerstein M., Karro J., Harrison P.M., Gerstein M., Harrison P.M., Gerstein M., Gerstein M. PseudoPipe: An automated pseudogene identification pipeline. Bioinformatics. 2006;22:1437–1439. doi: 10.1093/bioinformatics/btl116. [DOI] [PubMed] [Google Scholar]
- Zheng D., Gerstein M., Gerstein M. A computational approach for identifying pseudogenes in the ENCODE regions. Genome Biol. 2006;7:S13. doi: 10.1186/gb-2006-7-s1-s13. [DOI] [PMC free article] [PubMed] [Google Scholar]
- Zheng D., Zhang Z., Harrison P.M., Karro J., Carriero N., Gerstein M., Zhang Z., Harrison P.M., Karro J., Carriero N., Gerstein M., Harrison P.M., Karro J., Carriero N., Gerstein M., Karro J., Carriero N., Gerstein M., Carriero N., Gerstein M., Gerstein M. Integrated pseudogene annotation for human chromosome 22: Evidence for transcription. J. Mol. Biol. 2005;349:27–45. doi: 10.1016/j.jmb.2005.02.072. [DOI] [PubMed] [Google Scholar]