Abstract
Few methods are available for mapping the local structure of DNA throughout a genome. The hydroxyl radical cleavage pattern is a measure of the local variation in solvent-accessible surface area of duplex DNA, and thus provides information on the local shape and structure of DNA. We report the construction of a relational database, ORChID (OH Radical Cleavage Intensity Database), that contains extensive hydroxyl radical cleavage data produced from two DNA libraries. We have used the ORChID database to develop a set of algorithms that are capable of predicting the hydroxyl radical cleavage pattern of a DNA sequence of essentially any length, to high accuracy. We have used the prediction algorithm to produce a structural map of the 30 Mb of the ENCODE regions of the human genome.
While the linear sequence of nucleotides is the level at which most interpretations of a genome are made, a new appreciation of the effect of local DNA structure on genome function is emerging. Much effort has gone into the derivation of general rules regarding the effect of the sequence of DNA on its structure. High-resolution X-ray and NMR structures have clearly revealed the variability of DNA structure (Dickerson and Drew 1981; Calladine 1982; Calladine and Drew 1986; Yanagi et al. 1991; Dickerson 1992, 1997; Grzeskowiak 1996; Olson et al. 1998; Ng and Dickerson 2001; Barbic et al. 2003; Hays et al. 2005), and have shown that the conformation of a nucleotide residue is dependent at least on its nearest neighbors, and possibly more (Dickerson and Drew 1981; Dickerson 1983; Calladine and Drew 1986; Nelson et al. 1987; Bhattacharyya and Bansal 1990; DiGabriele and Steitz 1993; El Hassan and Calladine 1997; Johansson et al. 2000; Packer et al. 2000a, b; Gardiner et al. 2003). Although much knowledge has been gained from the study of DNA crystal structures, high-resolution structure determinations are resource-intensive and are applicable only to moderate-sized DNA molecules. In order to comprehensively sample the structure of all possible DNA sequences in an unbiased manner, alternative methods are necessary.
We report here the construction of a library of hydroxyl radical cleavage patterns of DNA, as a means of compiling structural information for a wide variety of DNA sequences. Although the hydroxyl radical cleavage pattern (Price and Tullius 1992) does not yield a high-resolution three-dimensional structure of a DNA molecule, it is a reflection of an important structural parameter, the solvent-accessible surface area of the DNA backbone (Balasubramanian et al. 1998). The cleavage pattern thus provides an image of the shape of the DNA backbone and how it varies with respect to nucleotide sequence. We describe the use of a fluorescence-based sequencer to obtain cleavage patterns, and introduce methods for normalization and quantitation of cleavage data. We present the design considerations of a relational database, ORChID (OH Radical Cleavage Intensity Database), to hold hydroxyl radical cleavage data, as well as its population and user interface.
We take advantage of the ORChID database to investigate how the nucleotide sequence of a DNA molecule affects its pattern of hydroxyl radical cleavage. We show here that, as expected, similar sequences yield similar cleavage patterns. However, we also find instances of long segments of DNA with low nucleotide sequence identity that produce nearly identical cleavage patterns. That is, it is possible for different DNA sequences to yield similar cleavage profiles. As the cleavage profile is a reflection of the underlying DNA structure, this indicates that considerably different DNA sequences can share a common structure. This leads to the intriguing possibility that DNA structure might be evolutionarily conserved, irrespective of the sequence of nucleotides.
Finally, we use the ORChID database to construct an algorithm that allows the prediction of the hydroxyl radical cleavage pattern of any DNA sequence to high accuracy. The speed of this algorithm makes it feasible to produce a structural map of a large genome. Here we report the use of this algorithm to construct a structural map of the 30 Mb of the ENCODE regions of the human genome.
Results
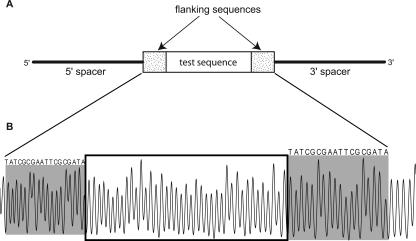
We began the construction of a database of hydroxyl radical cleavage patterns by obtaining two different libraries of single-stranded DNA molecules (Supplemental Table S1). One library, R40, was a collection of 158-nt-long DNA molecules synthesized with a segment of 40 random nucleotides (nt) in the center. The other library, pentamer, consisted of 14 members (123 or 118 nt in length), each of which contained a subset of all the 1024 possible pentanucleotides (Supplemental Fig. S1). In both libraries, the test sequence at the center was flanked by a common palindromic sequence on either side (Fig. 1A), to aid in data normalization.
Figure 1.
(A) Design of the DNA molecules used to construct the R40 library. The test sequence (an insert of 40 random nucleotides) is located near the center of the DNA strand, flanked by common sequences on both sides. The pentamer library was constructed in a similar manner, with individual pentamer sequences (see Supplemental Fig. S1) serving as the test sequence. (B) Typical electropherogram of a sample from the R40 library. The R40 test sequence is boxed, and the common flanking sequences are shaded. Each peak in the pattern represents cleavage by the hydroxyl radical at one nucleotide of the DNA molecule. The area of a peak is proportional to the extent of cleavage at that nucleotide (Shadle et al. 1997). Note that the cleavage patterns of the common palindromic flanking sequences at the 5′ (left) and 3′ (right) ends are similar for a particular member of the library. This also holds true for different library members (data not shown).
We used PCR to generate the complementary strands of the single-stranded DNA molecules in each library. The duplex libraries were inserted into a plasmid and used to transform Escherichia coli. Colonies were picked and grown up, plasmid DNA was isolated, and individual members of the library were sequenced. The insert region of a library plasmid was amplified by PCR, using a fluorescently labeled primer for one strand and an unlabeled primer for the other, to generate a singly end-labeled duplex DNA molecule. The labeled DNA molecule was then subjected to cleavage by the hydroxyl radical, denatured, and electrophoresed on an automated sequencer. An example of a typical cleavage pattern is shown in Figure 1B. The fluorescence trace of the cleavage pattern was analyzed with peak-fitting software to measure the integrated area of each peak (Shadle et al. 1997). The nucleotide sequence and cleavage pattern were stored in a database for further analysis. We present experimental details for each of these steps in the Methods section, and in the Supplemental Material.
Database layout and design
Careful consideration was taken to store the data in a meaningful, intuitive manner, while minimizing redundancy. To achieve this, one central table was established to which most other tables have a relationship (Supplemental Fig. S2). Within the central Sample Table, information, including the sequence, individual peak areas of the hydroxyl radical cleavage pattern, gel id, and gel lane, is stored. Both raw and normalized cleavage data are incorporated into the database.
To enhance the usability of the ORChID database, some of the more commonly queried data were combined into views, exemplified by trimers (Supplemental Table S2) and trimer summary (Supplemental Table S3). Corresponding views exist for N-mers ranging from monomers through septamers. An important use of these views involves the hydroxyl radical cleavage prediction algorithm that is discussed below. The algorithm is based on a sliding N-mer window model and thus requires the mean area for each peak of each N-mer for its calculations. Collection of these mean peak areas in the Summary views greatly reduces the complexity of the SQL statement that is used to access the relevant data.
Database usage
The ORChID database can be accessed directly through PostgreSQL’s psql interface or through a graphical Web interface at http://dna.bu.edu/orchid. From the Web interface, the user has the option to query the database by sequence ID, by nucleotide sequence, or by entering any properly formed SELECT statement. A separate page allows the user to make plots of cleavage intensity data for any sequence or pair of sequences that exist in the database. This functionality permits one to explore the database and investigate the properties of hydroxyl radical cleavage data.
The most widely useful feature of the Web interface is the ability to calculate a predicted hydroxyl radical cleavage pattern for any given sequence. From the Prediction Page, the user inputs a DNA sequence of nearly any length, and receives tabular and graphical output of the predicted hydroxyl radical cleavage pattern in a few seconds. Several options for prediction are provided, including the use of different prediction algorithms and output settings. Details of the prediction algorithm are discussed below.
Reproducibility of hydroxyl radical cleavage data
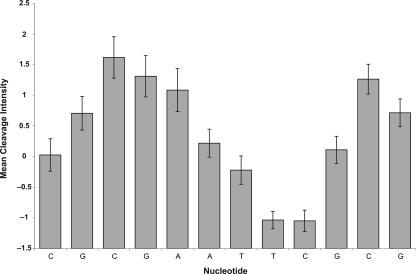
To quantitatively assess the quality of the hydroxyl radical cleavage data that we obtain by our experimental scheme, we took advantage of the pair of identical flanking sequences that are present in each member of the two DNA libraries (Fig. 1). We extracted from the ORChID database 112 examples of independently measured cleavage patterns for the common dodecanucleotide sequence d(CGCGAATTCGCG) and evaluated the reproducibility of the cleavage pattern. Figure 2 depicts the mean cleavage intensity for each position in the sequence, with the standard deviations indicated as error bars. The per-position standard deviations range from 0.14 to 0.35, which is between 5% and 13% of the complete range of values in the cleavage pattern, 2.67. The majority of the positions have a standard deviation of 0.26 or less, which translates to <10% of the range. The range of standard deviations we observe is consistent with previous work on quantitative analysis of hydroxyl radical cleavage patterns (Shadle et al. 1997).
Figure 2.
Reproducibility of the cleavage pattern of the common flanking sequence (see Fig. 1). The mean cleavage intensities, taken from 112 instances of the common flanking sequence cleavage pattern, are plotted as bars, with standard deviations shown as error bars.
Degeneracy of hydroxyl radical cleavage data patterns
After confirming that a particular DNA sequence produces a consistent hydroxyl radical cleavage pattern, we next asked whether two or more different DNA sequences can share a common cleavage pattern. If this were found to be true, it would indicate that divergent DNA sequences could share a similar local structure.
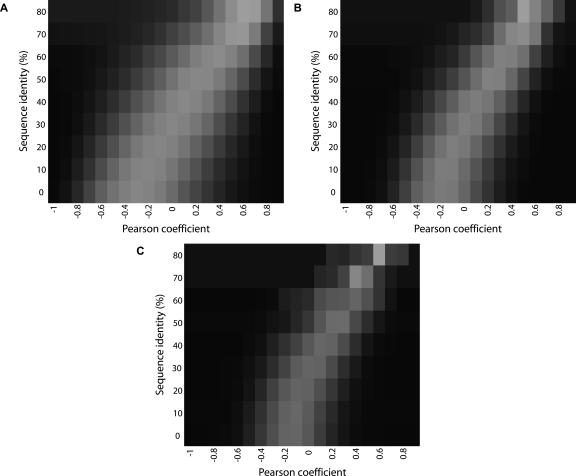
To investigate this question, we divided the sequences in the ORChID database into overlapping N-mers ranging from 8 to 34 nucleotides (nt) in length, and calculated Pearson correlations for all pairwise cleavage pattern comparisons. Similarly, for each pair of N-mers, we calculated the degree of nucleotide sequence identity. We then determined the relationship between sequence identity and cleavage pattern similarity (Supplemental Table S4). Given the notion that similar DNA sequences share a common structure, one would expect that sequences with a high degree of identity would also exhibit similar cleavage patterns. However, we found that overall, the Pearson correlation of sequence identity and cleavage similarity is rather low, ∼0.36 for the N-mer lengths we studied.
By dividing these data into subsets of similar sequence identity and then binning into discrete levels of cleavage similarity (Supplemental Tables S5–S7), we obtain a clearer sense of the relationship between cleavage pattern similarity and sequence identity. Despite the low Pearson correlation between these two parameters (Supplemental Table S4), the heatmaps shown in Figure 3 clearly illustrate that they are tightly linked.
Figure 3.
Cleavage/sequence correlation at various levels of sequence identity. Heat maps were created with Matrix2png (Pavlidis and Noble 2003), using the data from Supplemental Tables S5, S6, and S7 as input. (A) 10-mers; (B) 20-mers; (C) 30-mers. The intensity of each rectangle indicates the number of pairs of sequences in that cell, ranging from black (lowest) to white (highest).
The most interesting aspect of this analysis is the outliers. At low levels of sequence identity, there still are many examples of cleavage pattern pairs that have a highly significant correlation coefficient between them. This demonstrates that it is possible for sequences with low identity to produce similar cleavage patterns. Conversely, at higher levels of sequence identity, there are some pairs of sequences that exhibit relatively low correlation between their cleavage patterns. This observation indicates that the cleavage pattern of a particular sequence can be significantly affected by the substitution of only a few nucleotides. This last observation is consistent with previous work (Diekmann et al. 1987; Koo and Crothers 1987), which demonstrated that single nucleotides substituted for adenine in the center of an A-tract sequence could completely abolish the curvature of that DNA molecule, therefore drastically changing the overall shape and structure as the result of a modest change in sequence.
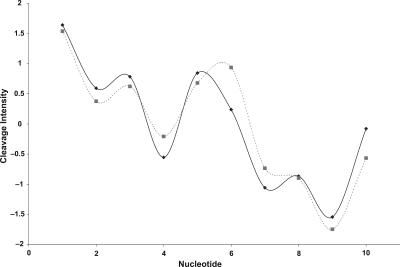
We next examined particular examples of cleavage patterns of some of the outlier sequences. Figure 4 depicts two 10-mers having completely different sequences (i.e., 0% identity), but with a Pearson coefficient of 0.94 between their cleavage patterns. Supplemental Figure S3 shows another example, two 20-mers with 10% sequence identity, yet a cleavage pattern correlation coefficient of 0.81. (The sequences of these four DNA molecules are listed in Supplemental Table S8.) These two examples illustrate the idea that two or more divergent sequences can share similar cleavage patterns over a relatively long stretch of DNA.
Figure 4.
High similarity in cleavage patterns for two sequences with low sequence identity. Plotted are the hydroxyl radical cleavage patterns of two 10-mer sequences that share no common nucleotides (sequence identity = 0%). Note the significant correlation (R = 0.94) of the two patterns. (See Supplemental Table S8 for sequences.)
Prediction of the hydroxyl radical cleavage pattern
Hydroxyl radical cleavage data have the potential to provide structural information on long segments of DNA, including genomic DNA. However, the experimental determination of hydroxyl radical cleavage patterns for the complete genomic sequence of an organism is a forbidding task. We used the ORChID database to develop algorithms to predict the hydroxyl radical cleavage pattern of a DNA sequence of arbitrary length. The output of these algorithms can be used for several purposes, including the construction of structural maps of genomes, and the identification of regions of conserved structure within and among them (Greenbaum et al. 2007).
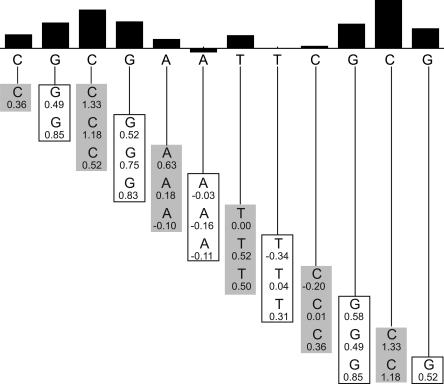
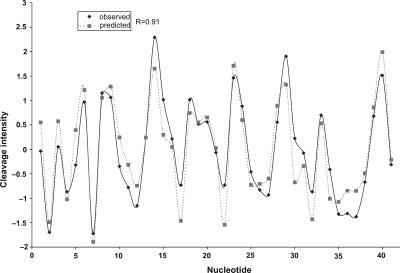
The prediction algorithms all involve treating a DNA sequence as being made up of overlapping N-mers. As an example, we discuss the Sliding Trimer Window algorithm. We also have implemented several related higher-order prediction algorithms. An overview of the Sliding Trimer Window algorithm is presented in Figure 5. This algorithm works by dividing the target sequence into overlapping trimers, and then retrieving the corresponding cleavage data from the ORChID database. We obtain the predicted hydroxyl radical cleavage intensity for each nucleotide in the sequence by taking the average of the three cleavage intensities at each position that are contributed by the three overlapping trinucleotides that are associated with that nucleotide. Figure 6 depicts the predicted and observed patterns for one sample from the ORChID database, for which the Pearson correlation between experimental and predicted pattern is 0.91. The correlation between the predicted and experimental datasets is striking, particularly given the simplicity of the model.
Figure 5.
Sliding trimer window algorithm. The sequence to be predicted is shown below the bar graph. It is divided into overlapping trinucleotides. The hydroxyl radical cleavage intensity data for each trimer are retrieved from the ORChID database and are listed below each nucleotide. The values in each column are averaged to produce a predicted hydroxyl radical cleavage intensity, which is represented as a bar at the top. Note that the two terminal nucleotides at each end rely on data from only one or two trinucleotides, rather than three.
Figure 6.
Predicted hydroxyl radical cleavage pattern. The hydroxyl radical cleavage pattern of sample ID 25201 from the ORChID database was predicted using the Sliding Trimer Window algorithm (see Fig. 5). The predicted pattern (broken line) is compared to the experimental pattern (solid line). The experimental and predicted patterns have a correlation coefficient of 0.91.
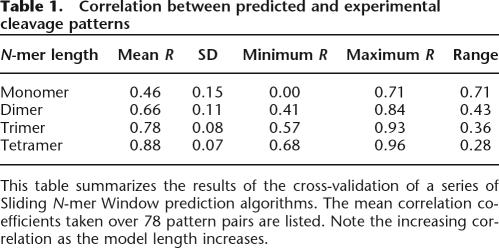
To estimate the accuracy of the prediction algorithm, the predicted cleavage patterns of 78 members of the ORChID database were compared to the corresponding experimentally determined patterns. Before the cleavage pattern of a given library member was predicted, its experimental cleavage pattern was removed from the database, and returned thereafter. This “leave-one-out” cross-validation ensured that the prediction algorithm had an unbiased data set with which to work. In addition to the Sliding Trimer Window algorithm, we evaluated similar algorithms using monomer through tetramer windows. The results of this validation are summarized in Table 1. As expected, when more sequence is taken into account, the algorithm’s predictive value increases (Supplemental Fig. S4).
Table 1.
Correlation between predicted and experimental cleavage patterns
This table summarizes the results of the cross-validation of a series of Sliding N-mer Window prediction algorithms. The mean correlation coefficients taken over 78 pattern pairs are listed. Note the increasing correlation as the model length increases.
A structural map of the ENCODE regions of the human genome
An important feature of our prediction algorithms for structural studies of genomes is their speed. As an example, on a 3.2 GHz Pentium 4 workstation, the Sliding Trimer Window algorithm predicts ∼320,000 cleavage intensities per second. This translates to ∼2.5 h to predict the cleavage intensities of the 3 billion base pairs that comprise a haploid human genome. As members of the ENCODE Consortium (The ENCODE Project Consortium 2004), we have used the algorithm to predict the cleavage patterns of each of the ENCODE regions, covering 30 Mb of the human genome. The ENCODE ORChID data are available for download (http://tinyurl.com/2g8vtz) and viewing (http://genome.ucsc.edu/encode/) via the UCSC Genome Browser (Karolchik et al. 2003). We have used the ENCODE ORChID cleavage pattern data to develop new methods to search for common structural features in functional regions of the genome (Greenbaum et al. 2007).
Discussion
While methods like X-ray crystallography and NMR produce detailed structural information for DNA, they are severely limited both by the time required and the length of the DNA molecule that can be studied. Although many crystal and NMR structures of DNA are currently available (Berman et al. 1992, 2000), most of these are no longer than 12 base pairs (bp) in length. Furthermore, it has been suggested that crystallization conditions enforce a static structure that may not be truly representative of DNA in solution (Dickerson et al. 1987; DiGabriele et al. 1989; Dlakic et al. 1996; Ganunis et al. 1996; Berman 1997; Ghosh and Bansal 2001). Despite recent advances in NMR (Zhou et al. 1999), the length of a DNA molecule that can be studied by this method is still rather limited.
Here we have described an alternative method for the acquisition of DNA structural information based on the collection of a library of hydroxyl radical cleavage patterns of DNA. Our approach can be made into a high-throughput method for determining structural features of DNA molecules. By organizing this information into a database, we have been able to study the effect of the sequence of a DNA molecule on its structure and make several key observations. We discovered that it is possible for highly divergent DNA sequences to produce closely related hydroxyl radical cleavage patterns; this is an indication that these stretches of DNA have a similar backbone shape. For example, there are 36 pairs of decamer sequences in the ORChID database that have only one nucleotide in common, yet have a Pearson coefficient of >0.9 when their cleavage patterns are compared (Supplemental Table S5). Lowering the Pearson coefficient threshold to 0.8 increases the number of structurally similar sequence pairs nearly 10-fold, to 355. These results indicate that the structural similarity of highly divergent sequences is common.
An intriguing implication of this finding is the role that DNA structural similarity may play in the binding of proteins to DNA. Most known transcription factor-binding sites (Matys et al. 2006; Vlieghe et al. 2006) are between 8 and 12 bp in length, and the vast majority of these sites are highly variable. Our work has shown the potential for divergent DNA sequences to adopt a similar backbone conformation over a stretch of 20 nt or so. It therefore is reasonable to propose that some DNA-binding proteins may be backbone conformation-specific (i.e., using indirect readout), rather than DNA sequence-specific. The development of algorithms to identify sequences with degenerate cleavage patterns may therefore prove useful in understanding how transcription factors locate their binding sites in genomic DNA. As well, since it has previously been shown that certain DNA sequences can act by virtue of their structure (Bracco et al. 1989; Kim et al. 1995; Angermayr et al. 2002), methods to identify such structures would benefit from incorporating hydroxyl radical cleavage data.
By studying the general features of hydroxyl radical cleavage data and organizing the data in meaningful ways, we have successfully developed algorithms for the prediction of hydroxyl radical cleavage patterns of DNA. Given the speed of our prediction algorithms, along with the addition of more sequences to the ORChID database and the concurrent development of higher-order predictive models, the experimental determination of hydroxyl radical cleavage patterns of DNA will become unnecessary. We look forward to the further use of ORChID data to help to understand functional regions of genomes in terms of their local DNA structural features.
Methods
Hydroxyl radical cleavage of DNA
Twenty microliters of fluorescently labeled DNA (see Supplemental Material) and 50 μL of buffer (20 mM Tris, 20 mM NaCl at pH 8) were pipetted into a 1.5-mL Eppendorf tube. Next, 10-μL drops of [Fe(EDTA)]2− (50 μM) and ascorbate (1 mM) were pipetted onto the wall of the tube, but not mixed. To initiate the reaction, 10 μL of H2O2 (0.03%) was combined with the other two reagents and mixed into the DNA sample in buffer by vigorous pipetting. The reaction was quenched after 2 min by the addition of 400 μL of ethanol (100%) and vortexing. The DNA was ethanol-precipitated. The dried DNA pellet was dissolved in 6 μL of formamide loading dye, and the sample was electrophoresed on a denaturing polyacrylamide gel using a Visible Genetics Long-Read Tower automated sequencer.
Data quantitation
The flanking common palindromic sequences (Fig. 1) were located by visual inspection of the data set, and their positions were recorded. Next, the text file containing the fluorescence intensity data was parsed and converted into a format readable by Origin (OriginLab Software). The fluorescence trace was plotted in Origin, and a value for the baseline was determined by noting the fluorescence intensity just before the first DNA fragment was observed. The raw data were then read into PeakFit (Systat Software), and the baseline was subtracted. The peaks in the data set were simultaneously fit using the EMG + GMG peak function. The area of a peak was taken to represent the amount of cleavage at that nucleotide. We then used the peak areas of the flanking common palindromic sequences to normalize the data for the test sequence. Further details are provided in the Supplemental Material.
Sliding N-mer window algorithms
The method illustrated in Figure 5 is applicable to all of our sliding N-mer algorithms. As an example, we describe here the Sliding Trimer Window algorithm. First, the sequence for which the cleavage pattern is to be predicted is divided into overlapping trinucleotide sequences. The corresponding cleavage intensities for each trinucleotide are retrieved from the ORChID database. The average cleavage intensity is calculated for each position in the sequence of interest, using Equation 1:
Here, Pi is the predicted cleavage intensity at position i, and Ti is the trinucleotide beginning at position i. The superscript on T indicates the nucleotide in the trimer (e.g., T1 is the first nucleotide of the trimer). The ends of the pattern are calculated similarly, except that cleavage data are retrieved from only one or two trimers, rather than three (see Fig. 5).
Correlation of predicted patterns with experimental patterns
Hydroxyl radical cleavage patterns were predicted for each of 78 sequences in the ORChID database: 56 pentamer library sequences (14 different DNA duplexes, both strands, two independent experimental examples of each), and 22 sequences from the R40 library. Before a particular cleavage pattern was predicted, its corresponding cleavage data were removed from the database; the data were replaced in the database upon completion of the prediction. The ends of the predicted and observed patterns were trimmed by several nucleotides in order to include only the most accurate predictions. Pearson correlation coefficients were calculated for the trimmed patterns versus the experimental patterns (see Table 1).
Acknowledgments
This work was funded by an ENCODE Technology Development grant from the National Human Genome Research Institute of the National Institutes of Health (R01 HG003541). J.A.G. was supported by an IGERT training grant from the National Science Foundation (DGE-9870710). We thank Steve Parker and Eric Bishop for helpful discussions.
Footnotes
[Supplemental material is available online at www.genome.org.]
Article is online at http://www.genome.org/cgi/doi/10.1101/gr.6073107
References
- Angermayr M., Oechsner U., Gregor K., Schroth G.P., Bandlow W., Oechsner U., Gregor K., Schroth G.P., Bandlow W., Gregor K., Schroth G.P., Bandlow W., Schroth G.P., Bandlow W., Bandlow W. Transcription initiation in vivo without classical transactivators: DNA kinks flanking the core promoter of the housekeeping yeast adenylate kinase gene, AKY2, position nucleosomes and constitutively activate transcription. Nucleic Acids Res. 2002;30:4199–4207. doi: 10.1093/nar/gkf551. [DOI] [PMC free article] [PubMed] [Google Scholar]
- Balasubramanian B., Pogozelski W.K., Tullius T.D., Pogozelski W.K., Tullius T.D., Tullius T.D. DNA strand breaking by the hydroxyl radical is governed by the accessible surface areas of the hydrogen atoms of the DNA backbone. Proc. Natl. Acad. Sci. 1998;95:9738–9743. doi: 10.1073/pnas.95.17.9738. [DOI] [PMC free article] [PubMed] [Google Scholar]
- Barbic A., Zimmer D.P., Crothers D.M., Zimmer D.P., Crothers D.M., Crothers D.M. Structural origins of adenine-tract bending. Proc. Natl. Acad. Sci. 2003;100:2369–2373. doi: 10.1073/pnas.0437877100. [DOI] [PMC free article] [PubMed] [Google Scholar]
- Berman H.M. Crystal studies of B-DNA: The answers and the questions. Biopolymers. 1997;44:23–44. doi: 10.1002/(SICI)1097-0282(1997)44:1<23::AID-BIP3>3.0.CO;2-1. [DOI] [PubMed] [Google Scholar]
- Berman H.M., Olson W.K., Beveridge D.L., Westbrook J., Gelbin A., Demeny T., Hsieh S.H., Srinivasan A.R., Schneider B., Olson W.K., Beveridge D.L., Westbrook J., Gelbin A., Demeny T., Hsieh S.H., Srinivasan A.R., Schneider B., Beveridge D.L., Westbrook J., Gelbin A., Demeny T., Hsieh S.H., Srinivasan A.R., Schneider B., Westbrook J., Gelbin A., Demeny T., Hsieh S.H., Srinivasan A.R., Schneider B., Gelbin A., Demeny T., Hsieh S.H., Srinivasan A.R., Schneider B., Demeny T., Hsieh S.H., Srinivasan A.R., Schneider B., Hsieh S.H., Srinivasan A.R., Schneider B., Srinivasan A.R., Schneider B., Schneider B. The nucleic acid database. A comprehensive relational database of three-dimensional structures of nucleic acids. Biophys. J. 1992;63:751–759. doi: 10.1016/S0006-3495(92)81649-1. [DOI] [PMC free article] [PubMed] [Google Scholar]
- Berman H.M., Westbrook J., Feng Z., Gilliland G., Bhat T.N., Weissig H., Shindyalov I.N., Bourne P.E., Westbrook J., Feng Z., Gilliland G., Bhat T.N., Weissig H., Shindyalov I.N., Bourne P.E., Feng Z., Gilliland G., Bhat T.N., Weissig H., Shindyalov I.N., Bourne P.E., Gilliland G., Bhat T.N., Weissig H., Shindyalov I.N., Bourne P.E., Bhat T.N., Weissig H., Shindyalov I.N., Bourne P.E., Weissig H., Shindyalov I.N., Bourne P.E., Shindyalov I.N., Bourne P.E., Bourne P.E. The Protein Data Bank. Nucleic Acids Res. 2000;28:235–242. doi: 10.1093/nar/28.1.235. [DOI] [PMC free article] [PubMed] [Google Scholar]
- Bhattacharyya D., Bansal M., Bansal M. Local variability and base sequence effects in DNA crystal structures. J. Biomol. Struct. Dyn. 1990;8:539–572. doi: 10.1080/07391102.1990.10507828. [DOI] [PubMed] [Google Scholar]
- Bracco L., Kotlarz D., Kolb A., Diekmann S., Buc H., Kotlarz D., Kolb A., Diekmann S., Buc H., Kolb A., Diekmann S., Buc H., Diekmann S., Buc H., Buc H. Synthetic curved DNA sequences can act as transcriptional activators in Escherichia coli. EMBO J. 1989;8:4289–4296. doi: 10.1002/j.1460-2075.1989.tb08615.x. [DOI] [PMC free article] [PubMed] [Google Scholar]
- Calladine C.R. Mechanics of sequence-dependent stacking of bases in B-DNA. J. Mol. Biol. 1982;161:343–352. doi: 10.1016/0022-2836(82)90157-7. [DOI] [PubMed] [Google Scholar]
- Calladine C.R., Drew H.R., Drew H.R. Principles of sequence-dependent flexure of DNA. J. Mol. Biol. 1986;192:907–918. doi: 10.1016/0022-2836(86)90036-7. [DOI] [PubMed] [Google Scholar]
- Dickerson R.E. Base sequence and helix structure variation in B and A DNA. J. Mol. Biol. 1983;166:419–441. doi: 10.1016/s0022-2836(83)80093-x. [DOI] [PubMed] [Google Scholar]
- Dickerson R.E. DNA structure from A to Z. Methods Enzymol. 1992;211:67–111. doi: 10.1016/0076-6879(92)11007-6. [DOI] [PubMed] [Google Scholar]
- Dickerson R.E. Sequence-dependent helix deformability in the recognition of B-DNA. Biopolymers. 1997;44:321. doi: 10.1002/(SICI)1097-0282(1997)44:4<321::AID-BIP1>3.0.CO;2-9. [DOI] [PubMed] [Google Scholar]
- Dickerson R.E., Drew H.R., Drew H.R. Structure of a B-DNA dodecamer. II. Influence of base sequence on helix structure. J. Mol. Biol. 1981;149:761–786. doi: 10.1016/0022-2836(81)90357-0. [DOI] [PubMed] [Google Scholar]
- Dickerson R.E., Goodsell D.S., Kopka M.L., Pjura P.E., Goodsell D.S., Kopka M.L., Pjura P.E., Kopka M.L., Pjura P.E., Pjura P.E. The effect of crystal packing on oligonucleotide double helix structure. J. Biomol. Struct. Dyn. 1987;5:557–579. doi: 10.1080/07391102.1987.10506413. [DOI] [PubMed] [Google Scholar]
- Diekmann S., von Kitzing E., McLaughlin L., Ott J., Eckstein F., von Kitzing E., McLaughlin L., Ott J., Eckstein F., McLaughlin L., Ott J., Eckstein F., Ott J., Eckstein F., Eckstein F. The influence of exocyclic substituents of purine bases on DNA curvature. Proc. Natl. Acad. Sci. 1987;84:8257–8261. doi: 10.1073/pnas.84.23.8257. [DOI] [PMC free article] [PubMed] [Google Scholar]
- DiGabriele A.D., Steitz T.A., Steitz T.A. A DNA dodecamer containing an adenine tract crystallizes in a unique lattice and exhibits a new bend. J. Mol. Biol. 1993;231:1024–1039. doi: 10.1006/jmbi.1993.1349. [DOI] [PubMed] [Google Scholar]
- DiGabriele A.D., Sanderson M.R., Steitz T.A., Sanderson M.R., Steitz T.A., Steitz T.A. Crystal lattice packing is important in determining the bend of a DNA dodecamer containing an adenine tract. Proc. Natl. Acad. Sci. 1989;86:1816–1820. doi: 10.1073/pnas.86.6.1816. [DOI] [PMC free article] [PubMed] [Google Scholar]
- Dlakic M., Park K., Griffith J.D., Harvey S.C., Harrington R.E., Park K., Griffith J.D., Harvey S.C., Harrington R.E., Griffith J.D., Harvey S.C., Harrington R.E., Harvey S.C., Harrington R.E., Harrington R.E. The organic crystallizing agent 2-methyl-2,4-pentanediol reduces DNA curvature by means of structural changes in A-tracts. J. Biol. Chem. 1996;271:17911–17919. doi: 10.1074/jbc.271.30.17911. [DOI] [PubMed] [Google Scholar]
- El Hassan M.A., Calladine C.R., Calladine C.R. Conformational characteristics of DNA: Empirical classifications and a hypothesis for the conformational behavior of dinucleotide steps. Philos. Trans. R. Soc. Lond. A. 1997;355:43–100. [Google Scholar]
- The ENCODE Project Consortium, The ENCODE (ENCyclopedia Of DNA Elements) Project. Science. 2004;306:636–640. doi: 10.1126/science.1105136. [DOI] [PubMed] [Google Scholar]
- Ganunis R.M., Guo H., Tullius T.D., Guo H., Tullius T.D., Tullius T.D. Effect of the crystallizing agent 2-methyl-2,4-pentanediol on the structure of adenine tract DNA in solution. Biochemistry. 1996;35:13729–13732. doi: 10.1021/bi961880q. [DOI] [PubMed] [Google Scholar]
- Gardiner E.J., Hunter C.A., Packer M.J., Palmer D.S., Willett P., Hunter C.A., Packer M.J., Palmer D.S., Willett P., Packer M.J., Palmer D.S., Willett P., Palmer D.S., Willett P., Willett P. Sequence-dependent DNA structure: A database of octamer structural parameters. J. Mol. Biol. 2003;332:1025–1035. doi: 10.1016/j.jmb.2003.08.006. [DOI] [PubMed] [Google Scholar]
- Ghosh A., Bansal M., Bansal M. Structural features of B-DNA dodecamer crystal structures: Influence of crystal packing versus base sequence. Indian J. Biochem. Biophys. 2001;38:7–15. [PubMed] [Google Scholar]
- Greenbaum J.A., Parker S.C.J., Tullius T.D., Parker S.C.J., Tullius T.D., Tullius T.D. Detection of DNA structural motifs in functional genomic elements. Genome Res. 2007 doi: 10.1101/gr.5602807. (this issue) [DOI] [PMC free article] [PubMed] [Google Scholar]
- Grzeskowiak K. Sequence-dependent structural variation in B-DNA. Chem. Biol. 1996;3:785–790. doi: 10.1016/s1074-5521(96)90062-9. [DOI] [PubMed] [Google Scholar]
- Hays F.A., Teegarden A., Jones Z.J., Harms M., Raup D., Watson J., Cavaliere E., Ho P.S., Teegarden A., Jones Z.J., Harms M., Raup D., Watson J., Cavaliere E., Ho P.S., Jones Z.J., Harms M., Raup D., Watson J., Cavaliere E., Ho P.S., Harms M., Raup D., Watson J., Cavaliere E., Ho P.S., Raup D., Watson J., Cavaliere E., Ho P.S., Watson J., Cavaliere E., Ho P.S., Cavaliere E., Ho P.S., Ho P.S. How sequence defines structure: A crystallographic map of DNA structure and conformation. Proc. Natl. Acad. Sci. 2005;102:7157–7162. doi: 10.1073/pnas.0409455102. [DOI] [PMC free article] [PubMed] [Google Scholar]
- Johansson E., Parkinson G., Neidle S., Parkinson G., Neidle S., Neidle S. A new crystal form for the dodecamer C-G-C-G-A-A-T-T-C-G-C-G: Symmetry effects on sequence-dependent DNA structure. J. Mol. Biol. 2000;300:551–561. doi: 10.1006/jmbi.2000.3907. [DOI] [PubMed] [Google Scholar]
- Karolchik D., Baertsch R., Diekhans M., Furey T.S., Hinrichs A., Lu Y.T., Roskin K.M., Schwartz M., Sugnet C.W., Thomas D.J., Baertsch R., Diekhans M., Furey T.S., Hinrichs A., Lu Y.T., Roskin K.M., Schwartz M., Sugnet C.W., Thomas D.J., Diekhans M., Furey T.S., Hinrichs A., Lu Y.T., Roskin K.M., Schwartz M., Sugnet C.W., Thomas D.J., Furey T.S., Hinrichs A., Lu Y.T., Roskin K.M., Schwartz M., Sugnet C.W., Thomas D.J., Hinrichs A., Lu Y.T., Roskin K.M., Schwartz M., Sugnet C.W., Thomas D.J., Lu Y.T., Roskin K.M., Schwartz M., Sugnet C.W., Thomas D.J., Roskin K.M., Schwartz M., Sugnet C.W., Thomas D.J., Schwartz M., Sugnet C.W., Thomas D.J., Sugnet C.W., Thomas D.J., Thomas D.J., et al. The UCSC Genome Browser Database. Nucleic Acids Res. 2003;31:51–54. doi: 10.1093/nar/gkg129. [DOI] [PMC free article] [PubMed] [Google Scholar]
- Kim J., Klooster S., Shapiro D.J., Klooster S., Shapiro D.J., Shapiro D.J. Intrinsically bent DNA in a eukaryotic transcription factor recognition sequence potentiates transcription activation. J. Biol. Chem. 1995;270:1282–1288. doi: 10.1074/jbc.270.3.1282. [DOI] [PubMed] [Google Scholar]
- Koo H.S., Crothers D.M., Crothers D.M. Chemical determinants of DNA bending at adenine-thymine tracts. Biochemistry. 1987;26:3745–3748. doi: 10.1021/bi00386a070. [DOI] [PubMed] [Google Scholar]
- Matys V., Kel-Margoulis O.V., Fricke E., Liebich I., Land S., Barre-Dirrie A., Reuter I., Chekmenev D., Krull M., Hornischer K., Kel-Margoulis O.V., Fricke E., Liebich I., Land S., Barre-Dirrie A., Reuter I., Chekmenev D., Krull M., Hornischer K., Fricke E., Liebich I., Land S., Barre-Dirrie A., Reuter I., Chekmenev D., Krull M., Hornischer K., Liebich I., Land S., Barre-Dirrie A., Reuter I., Chekmenev D., Krull M., Hornischer K., Land S., Barre-Dirrie A., Reuter I., Chekmenev D., Krull M., Hornischer K., Barre-Dirrie A., Reuter I., Chekmenev D., Krull M., Hornischer K., Reuter I., Chekmenev D., Krull M., Hornischer K., Chekmenev D., Krull M., Hornischer K., Krull M., Hornischer K., Hornischer K., et al. TRANSFAC and its module TRANSCompel: Transcriptional gene regulation in eukaryotes. Nucleic Acids Res. 2006;34:D108–D110. doi: 10.1093/nar/gkj143. [DOI] [PMC free article] [PubMed] [Google Scholar]
- Nelson H.C., Finch J.T., Luisi B.F., Klug A., Finch J.T., Luisi B.F., Klug A., Luisi B.F., Klug A., Klug A. The structure of an oligo(dA) ⋅ oligo(dT) tract and its biological implications. Nature. 1987;330:221–226. doi: 10.1038/330221a0. [DOI] [PubMed] [Google Scholar]
- Ng H., Dickerson R.E., Dickerson R.E. Mildly eccentric ‘E-DNA.’. Nat. Struct. Biol. 2001;8:107–108. doi: 10.1038/84078. [DOI] [PubMed] [Google Scholar]
- Olson W.K., Gorin A.A., Lu X.J., Hock L.M., Zhurkin V.B., Gorin A.A., Lu X.J., Hock L.M., Zhurkin V.B., Lu X.J., Hock L.M., Zhurkin V.B., Hock L.M., Zhurkin V.B., Zhurkin V.B. DNA sequence-dependent deformability deduced from protein–DNA crystal complexes. Proc. Natl. Acad. Sci. 1998;95:11163–11168. doi: 10.1073/pnas.95.19.11163. [DOI] [PMC free article] [PubMed] [Google Scholar]
- Packer M.J., Dauncey M.P., Hunter C.A., Dauncey M.P., Hunter C.A., Hunter C.A. Sequence-dependent DNA structure: Dinucleotide conformational maps. J. Mol. Biol. 2000a;295:71–83. doi: 10.1006/jmbi.1999.3236. [DOI] [PubMed] [Google Scholar]
- Packer M.J., Dauncey M.P., Hunter C.A., Dauncey M.P., Hunter C.A., Hunter C.A. Sequence-dependent DNA structure: Tetranucleotide conformational maps. J. Mol. Biol. 2000b;295:85–103. doi: 10.1006/jmbi.1999.3237. [DOI] [PubMed] [Google Scholar]
- Pavlidis P., Noble W.S., Noble W.S. Matrix2png: A utility for visualizing matrix data. Bioinformatics. 2003;19:295–296. doi: 10.1093/bioinformatics/19.2.295. [DOI] [PubMed] [Google Scholar]
- Price M.A., Tullius T.D., Tullius T.D. Using hydroxyl radical to probe DNA structure. Methods Enzymol. 1992;212:194–219. doi: 10.1016/0076-6879(92)12013-g. [DOI] [PubMed] [Google Scholar]
- Shadle S.E., Allen D.F., Guo H., Pogozelski W.K., Bashkin J.S., Tullius T.D., Allen D.F., Guo H., Pogozelski W.K., Bashkin J.S., Tullius T.D., Guo H., Pogozelski W.K., Bashkin J.S., Tullius T.D., Pogozelski W.K., Bashkin J.S., Tullius T.D., Bashkin J.S., Tullius T.D., Tullius T.D. Quantitative analysis of electrophoresis data: Novel curve fitting methodology and its application to the determination of a protein–DNA binding constant. Nucleic Acids Res. 1997;25:850–860. doi: 10.1093/nar/25.4.850. [DOI] [PMC free article] [PubMed] [Google Scholar]
- Vlieghe D., Sandelin A., De Bleser P.J., Vleminckx K., Wasserman W.W., van Roy F., Lenhard B., Sandelin A., De Bleser P.J., Vleminckx K., Wasserman W.W., van Roy F., Lenhard B., De Bleser P.J., Vleminckx K., Wasserman W.W., van Roy F., Lenhard B., Vleminckx K., Wasserman W.W., van Roy F., Lenhard B., Wasserman W.W., van Roy F., Lenhard B., van Roy F., Lenhard B., Lenhard B. A new generation of JASPAR, the open-access repository for transcription factor binding site profiles. Nucleic Acids Res. 2006;34:D95–D97. doi: 10.1093/nar/gkj115. [DOI] [PMC free article] [PubMed] [Google Scholar]
- Yanagi K., Prive G.G., Dickerson R.E., Prive G.G., Dickerson R.E., Dickerson R.E. Analysis of local helix geometry in three B-DNA decamers and eight dodecamers. J. Mol. Biol. 1991;217:201–214. doi: 10.1016/0022-2836(91)90620-l. [DOI] [PubMed] [Google Scholar]
- Zhou H., Vermeulen A., Jucker F.M., Pardi A., Vermeulen A., Jucker F.M., Pardi A., Jucker F.M., Pardi A., Pardi A. Incorporating residual dipolar couplings into the NMR solution structure determination of nucleic acids. Biopolymers. 1999;52:168–180. doi: 10.1002/1097-0282(1999)52:4<168::AID-BIP1002>3.0.CO;2-7. [DOI] [PubMed] [Google Scholar]


