Abstract
The standardization and sharing of data and tools are the biggest challenges of large collaborative projects such as the Encyclopedia of DNA Elements (ENCODE). Here we describe a compact Web application, Galaxy2ENCODE, that effectively addresses these issues. It provides an intuitive interface for the deposition and access of data, and features a vast number of analysis tools including operations on genomic intervals, utilities for manipulation of multiple sequence alignments, and molecular evolution algorithms. By providing a direct link between data and analysis tools, Galaxy2ENCODE allows addressing biological questions that are beyond the reach of existing software. We use Galaxy2ENCODE to show that the ENCODE regions contain >2000 unannotated transcripts under strong purifying selection that are likely functional. We also show that the ENCODE regions are representative of the entire genome by estimating the rate of nucleotide substitution and comparing it to published data. Although each of these analyses is complex, none takes more than 15 min from beginning to end. Finally, we demonstrate how new tools can be added to Galaxy2ENCODE with almost no effort. Every section of the manuscript is supplemented with QuickTime screencasts. Galaxy2ENCODE and the screencasts can be accessed at http://g2.bx.psu.edu.
Analysis of data generated by The ENCODE Project Consortium (2004) for the Encyclopedia of DNA Elements (ENCODE) is proving to be one of the most exciting collaborative events of the post-genomic era. The interpretation of enormous amounts of data generated by the ENCODE Consortium requires new methodologies for the sharing and standardization of data and new analysis tools. The system we describe here, Galaxy2ENCODE (http://g2.bx.psu.edu), is the first attempt to solve data and tool integration challenges for ENCODE-like projects and make data easily accessible for biomedical researchers. Galaxy2ENCODE attempts to serve both sides of the user distribution: experimental biologists and bioinformaticians. For experimental biologists, it provides an intuitive interface for data deposition and access, features a large number of tools, and makes analyses transparent by documenting every step in the history system. Most importantly, it streamlines the path from data to analyses, as even complex tools such as HyPhy (Pond et al. 2005) can be applied to genomic data directly without parsing or preprocessing. For computational biologists, Galaxy2ENCODE provides a framework that can integrate command-line tools with almost no effort. For each tool, Galaxy2ENCODE generates the interface and provides all housekeeping.
In this study, we demonstrate the utility of our system with examples using ENCODE data (the utility of our system is not limited to ENCODE). We show two complex analyses that can be conducted by using our system in <15 min. In the first example, we define and analyze all unannotated expressed sequence tags (ESTs) in ENCODE regions. We show that over 2000 ESTs do not correspond to any annotated genes, yet show strong signature of purifying selection, indicating possible function. In the second example, we estimate the rate of nucleotide substitutions in ENCODE regions and demonstrate that it is consistent with genome-wide estimates. The two analyses are designed as “cookbook” examples for two distinct audiences. The first analysis is geared toward researchers studying the structure and function of the human genome. The second example is for researchers working in the area of evolutionary genomics. Finally, we show how easy it is to add new functionality to the Galaxy2ENCODE toolbox and to use Galaxy2ENCODE as a resource for sharing different analysis tools. This paper is supplemented with screencasts, short QuickTime movie clips. Each section of Results and Discussion features a screencast. The screencasts can be viewed directly from the main Galaxy2ENCODE Web site (http://g2.bx.psu.edu) under the heading “Screencasts.”
Results and Discussion
Galaxy2ENCODE interface and ENCODE data portal (Screencasts 1 and 2)
Galaxy2ENCODE allows experimental biologists to retrieve and analyze data within a single unified interface. For this purpose, Galaxy2ENCODE features a history system that stores data uploaded by the user as well as the results of all analyses. The concept of history was previously successfully deployed by our group (Giardine et al. 2005). The Galaxy2ENCODE interface is shown in Supplemental Figure S1. The current version of Galaxy2ENCODE allows users to create accounts and to have multiple histories (can be viewed at http://main.g2.bx.psu.edu).
To facilitate data exchange among different ENCODE groups during the analysis process, we implemented a local data repository at http://encode-upload.g2.bx.psu.edu. The repository is a Web application designed to (1) provide a user-friendly interface for data upload, (2) standardize naming of data files according to ENCODE guidelines, (3) automatically fragment the data into ENCODE analysis partitions, and (4) store the data for direct access through Galaxy2ENCODE (http://encode.g2.bx.psu.edu) and ftp (ftp://encode:encode@g2.bx.psu.edu). See Methods for a description of the naming conventions and partition process.
Galaxy2ENCODE tools (Screencasts 4–14)
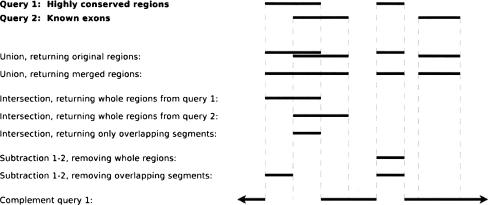
The current version of Galaxy2ENCODE provides access to >100 analysis tools. The functionality of each category is detailed in tool screencasts (Screencasts 4–14). The most popular set of tools routinely used in genome analyses are operations on genomic intervals (Fig. 1). These include the basic set operations of union, intersection, subtraction, and complement, as well as filters based on region size, proximity to regions from another query, and clustering by distance of regions within a single query. Many of these operations have options that allow the user to define what, for instance, “intersection” should mean when dealing with positional regions rather than atomic objects. The result is a new set of regions on which further processing can be performed. The Galaxy2ENCODE toolset can be easily expanded. Developers can easily integrate any command-line tool as described below (see Screencast 19).
Figure 1.
Galaxy2ENCODE supports several variations of the basic set operations designed specifically for manipulation of genomic intervals.
Analysis of intronic, intergenic, and intertwined ESTs (Screencasts 15–17)
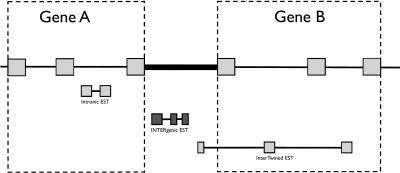
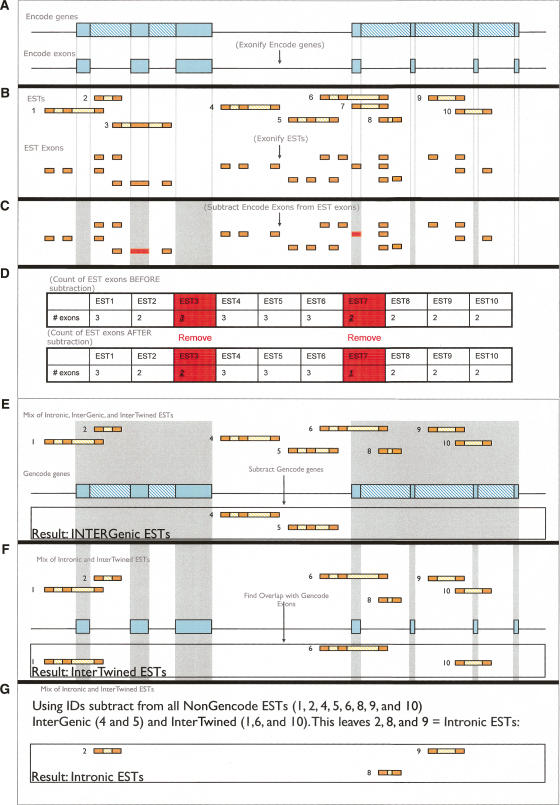
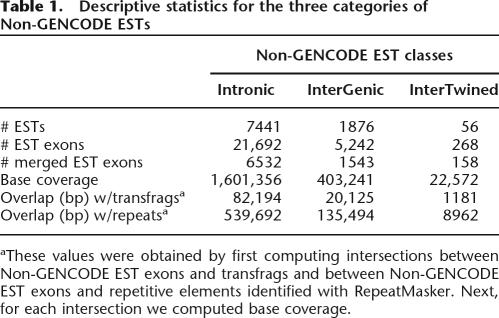
Here we define and characterize the 9191 transcripts that lie outside annotated genes within ENCODE regions. These are of considerable interest, as some may represent genes missed during the annotation process. We used GENCODE annotation as the source of gene data (http://genome.imim.es/gencode/). Genes are first predicted computationally and then experimentally verified using techniques such as RT-PCR, RACE, and direct sequencing of the products. As such, the gene predictions of GENCODE are the most reliable. In the following analysis, we define “genes” as the union of GENCODE Known Genes, GENCODE Putative Genes, and GENCODE pseudogenes annotations frozen during the Second ENCODE Workshop (University of California Santa Cruz, November 2005). Using genomic coordinates, we identified all ESTs that map outside GENCODE genes. We call such ESTs Non-GENCODE ESTs. Non-GENCODE ESTs belong to three categories (Fig. 2): intronic, intergenic, and intertwined (or interleaved as suggested by Chen and Stein 2006). Figure 3 summarizes the steps of our analysis, which takes ∼15 min to complete. See Screencast 15 and the Methods section for a step-by-step explanation of the procedure. Briefly, we first defined a set that includes all Non-GENCODE ESTs (Fig. 3A–D). Then, we classified Non-GENCODE ESTs into intronic, intergenic, and intertwined (Fig. 3E,F). Finally, we computed descriptive statistics as shown in Table 1.
Figure 2.
Types of Non-GENCODE ESTs.
Figure 3.
Steps (A–G) in identification of Non-GENCODE ESTs. Galaxy2 makes such analyses transparent. See Methods and Screencast 15 for explanations of each step.
Table 1.
Descriptive statistics for the three categories of Non-GENCODE ESTs
aThese values were obtained by first computing intersections between Non-GENCODE EST exons and transfrags and between Non-GENCODE EST exons and repetitive elements identified with RepeatMasker. Next, for each intersection we computed base coverage.
Having defined Non-GENCODE ESTs in ENCODE regions, we can now use Galaxy2ENCODE to look into the biology of these transcripts. How many Non-GENCODE ESTs correspond to missing protein-coding genes? What fraction of the Non-GENCODE ESTs are under purifying selection? Is there a significant overlap between Non-GENCODE ESTs and transcriptional evidence produced by alternative methods? These are just some of the questions that can be easily answered with versatile Galaxy2ENCODE tools.
Screencast 15
To find out how many Non-GENCODE ESTs may represent missing or misannotated protein-coding genes, we computed the overlap between the EST exons and protein-coding regions predicted by Exoniphy. Exoniphy is an ab initio exon predictor that uses nucleotide substitution patterns and phylogenetic information to predict protein-coding regions with a high degree of accuracy (Siepel and Haussler 2004). First, we computed the overlap between exons of Non-GENCODE ESTs and exons predicted by Exoniphy using the Overlap tool. We then used the Base coverage tool to identify those Non-GENCODE EST exons that are covered by Exoniphy predictions for at least 75% of their length. Only one EST (accession no. DR731323) was found to overlap with three consecutive Exoniphy exons and represents a 3′-end extension of an Ensembl gene ENST00000355799 (Supplemental Fig. S2).
Screencast 16
While only one of the Non-GENCODE ESTs appears to be protein-coding, others may be functional but non-coding. One of the ways to pinpoint functional non-coding regions is to measure the strength of purifying selection acting on the genomic region of interest. In Galaxy2ENCODE, the strength of purifying selecting may be assessed using phastCons scores (Siepel et al. 2005). The phastCons score is one of the best measures of the strength of purifying selection acting on a DNA sequence. A high phastCons score (≥0.2) may be taken as strong evidence of the functional importance of a genomic region (Siepel and Haussler 2004; King et al. 2005). To perform these analyses, we “aggregated” phastCons scores for exons of Non-GENCODE ESTs using the Aggregate-datapoints tool (The aggregation is performed because phastCons scores are base-pair-specific; thus to obtain a phastCons score for an exon, phastCons values of individual nucleotides must be averaged for all nucleotides within that exon using the Aggregate tool.) After aggregation is complete, we filter out regions with average phastCons scores below 0.2. This leaves 3705 (14%) Non-GENCODE EST exons from the total of 27,202. At this point of the analyses, we operate with individual exons. However, in this case, it interesting to know which of the Non-GENCODE ESTs have all exons with the average phastCons score above 0.2. Using a combination of filtering and relational database operations implemented in Galaxy2ENCODE, we identified 2180 such ESTs (942 intronic, 221 intergenic, and nine intertwined, respectively). An example of an intergenic EST from this set (accession no. DB275065) is shown in Supplemental Figure S3. Note the conservation peaks surrounding exons of this EST. Transcripts identified using this approach are strong candidates for further experimental validation.
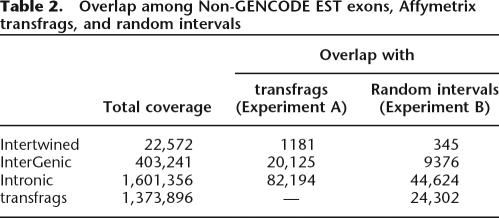
If Non-GENCODE ESTs represent biologically relevant transcripts, there should be a significant overlap between them and transcribed regions of the genome confirmed with other methods, such as transcribed fragments (transfrags) produced by the Affymetrix group (Kampa et al. 2004; Cheng et al. 2005). Galaxy2ENCODE allows one to test the significance of the overlap between two sets of genomic features such as, for example, Non-GENCODE EST exons and transfrags. To perform this test, we designed a Random Intervals tool that generates a set of simulated regions that mimic a given set of intervals. In this example, we first (Experiment A) computed the intersection between exons of Non-GENCODE EST (including all three categories: Intertwined, Intergenic, and Intronic) and transfrags within ENCODE regions. Next (Experiment B), we used the Random Interval tool to generate a set of genomic intervals that mimic the length distribution of Non-GENCODE EST exons but lie outside transfrags. We then computed the intersection between exons of Non-GENCODE ESTs and the set of Random intervals. Comparing results of experiments A and B shows that the overlap between Non-GENCODE ESTs and transfrags is likely nonrandom (Table 2). The base-pair coverage in Experiment A is consistently higher than that in Experiment B. To obtain the empirical p-value, one can repeat Experiment B multiple times.
Table 2.
Overlap among Non-GENCODE EST exons, Affymetrix transfrags, and random intervals
Estimating mammalian substitution rates
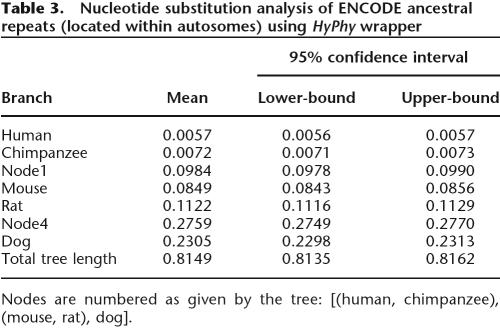
Since ENCODE regions have the highest depth of annotation, it is tempting to extrapolate their properties to the entire genome. However, is this legitimate? In other words, do ENCODE regions represent an unbiased sample of the genome? One way to answer this question is to compare evolutionary parameters of the ENCODE region with genome-wide estimates published elsewhere. We used ancestral repeats (ARs) (Hardison et al. 2003) to show that ENCODE regions are, indeed, representative of the remaining euchromatic portion of the genome. The AR coordinates were retrieved by using the ENCODE Multi-Species Sequence Analysis tool, and then the Filter tool was used to limit the results to ENCODE’s autosomal regions. Next, multiple alignments between mammalian genomes were extracted for the intervals and converted to FASTA-formatted sequences with the Maf-to-FASTA converter, where we also narrowed our species range to human, chimpanzee, mouse, rat, and dog. The total alignment length was 364 kb. We then applied a HyPhy wrapper (Pond et al. 2005) to this set using the general reversible model of nucleotide substitutions (REV) (Rodriguez et al. 1990; Yang et al. 1994) and obtained the following branch lengths: [(human: 0.006, chimp:0.007):0.098, (mouse:0.084, rat:0.112):0.276, dog:0.231] (Table 3). The analysis took 7 min to complete. These results are consistent with recent genomic studies (Gibbs et al. 2004; The Chimpanzee Sequencing and Analysis Consortium 2005; Lindblad-Toh et al. 2005). The 95% confidence intervals were derived with the profile likelihood approach implemented in the HyPhy package (Pond et al. 2005).
Table 3.
Nucleotide substitution analysis of ENCODE ancestral repeats (located within autosomes) using HyPhy wrapper
Nodes are numbered as given by the tree: [(human, chimpanzee), (mouse, rat), dog].
Galaxy2ENCODE as a community resource for distributing tools (Screencasts 18 and 19)
ENCODE analysis groups have designed several innovative software tools that can be of great use to the rest of the genomic community. Galaxy2ENCODE can be used to provide unified, simple, and user-friendly interfaces for these tools. Adding tools does not require any knowledge about the internal operation of Galaxy2ENCODE. The entire tool deployment process consists of downloading a software distribution from http://g2.bx.psu.edu, installing it (see the 3-min Screencast 18 that explains all steps of the installation process), and performing the two steps described in Supplemental Materials (also see Screencast 19).
Conclusions
We demonstrated that Galaxy2ENCODE serves as a new, critically needed environment that can foster interactions between experimental and computational biologists by providing a simple interface (important to the former) and a robust software integration environment (important for the latter). Galaxy allows data producers to deposit data and make them immediately available to the biological community. It features over 100 unique tools that allow the user to manipulate sequences, coordinates, and alignments on the genome-wide scale. The simplicity of Galaxy2ENCODE’s tool integration protocol allows developers and occasional scripters alike easily to integrate their programs and make them available to biologists.
Methods
Galaxy2ENCODE is a completely new compact implementation that combines the latest open-source technologies with ideas previously developed by our group (Giardine et al. 2005). A detailed description of (1) uploading and processing of ENCODE data, (2) finding Non-GENCODE ESTs, and (3) implementation details can be found in the Supplemental Material. In addition, our wiki page at http://g2.bx.psu.edu contains source code, written instructions, and screencasts on using, downloading, and developing Galaxy2. Usage-related questions should be directed to galaxy-bugs@bx.psu.edu.
Acknowledgments
We thank David Haussler and Jim Kent for their continuing support of the project and the members of the Center for Comparative Genomics and Bioinformatics at Penn State for their input. Roderic Guigo, France Denoeud, Julien Lagarde, and Robert Castelo provided critical comments during software testing. Special thanks to Michael O’Connor for editing the wiki page content. This work is supported by funds provided by the Eberly College of Science, Huck Institutes of the Life Sciences, at Penn State University; NSF DBI grant 0543285 to A.N.; NIH R01 HG002238 to W.M.; and NIH R01 GM072264 to K.M.
Footnotes
[Supplemental material is available online at www.genome.org and http://g2.bx.psu.edu.]
Article is online at http://www.genome.org/cgi/doi/10.1101/gr.5578007
References
- Axelsson E., Smith N.G., Sundstrom H., Berlin S., Ellegren H., Smith N.G., Sundstrom H., Berlin S., Ellegren H., Sundstrom H., Berlin S., Ellegren H., Berlin S., Ellegren H., Ellegren H. Male-biased mutation rate and divergence in autosomal, z-linked and w-linked introns of chicken and turkey. Mol. Biol. Evol. 2004;21:1538–1547. doi: 10.1093/molbev/msh157. [DOI] [PubMed] [Google Scholar]
- Chen N., Stein L.D., Stein L.D. Conservation and functional significance of gene topology in the genome of Caenorhabditis elegans. Genome Res. 2006;16:606–617. doi: 10.1101/gr.4515306. [DOI] [PMC free article] [PubMed] [Google Scholar]
- Cheng J., Kapranov P., Drenkow J., Dike S., Brubaker S., Patel S., Long J., Stern D., Tammana H., Helt G., Kapranov P., Drenkow J., Dike S., Brubaker S., Patel S., Long J., Stern D., Tammana H., Helt G., Drenkow J., Dike S., Brubaker S., Patel S., Long J., Stern D., Tammana H., Helt G., Dike S., Brubaker S., Patel S., Long J., Stern D., Tammana H., Helt G., Brubaker S., Patel S., Long J., Stern D., Tammana H., Helt G., Patel S., Long J., Stern D., Tammana H., Helt G., Long J., Stern D., Tammana H., Helt G., Stern D., Tammana H., Helt G., Tammana H., Helt G., Helt G., et al. Transriptional maps of 10 human chromosomes at 5-nucleotide resolution. Science. 2005;308:1149–1154. doi: 10.1126/science.1108625. [DOI] [PubMed] [Google Scholar]
- The Chimpanzee Sequencing and Analysis Consortium, Initial sequence of the chimpanzee genome and comparison with the human genome. Nature. 2005;437:69–87. doi: 10.1038/nature04072. [DOI] [PubMed] [Google Scholar]
- The ENCODE Project Consortium, The ENCODE (ENCyclopedia Of DNA Elements) Project. Science. 2004;306:636–640. doi: 10.1126/science.1105136. [DOI] [PubMed] [Google Scholar]
- Giardine B., Riemer C., Hardison R.C., Burhans R., Elnitski L., Shah P., Zhang Y., Blankenberg D., Albert I., Miller W., Riemer C., Hardison R.C., Burhans R., Elnitski L., Shah P., Zhang Y., Blankenberg D., Albert I., Miller W., Hardison R.C., Burhans R., Elnitski L., Shah P., Zhang Y., Blankenberg D., Albert I., Miller W., Burhans R., Elnitski L., Shah P., Zhang Y., Blankenberg D., Albert I., Miller W., Elnitski L., Shah P., Zhang Y., Blankenberg D., Albert I., Miller W., Shah P., Zhang Y., Blankenberg D., Albert I., Miller W., Zhang Y., Blankenberg D., Albert I., Miller W., Blankenberg D., Albert I., Miller W., Albert I., Miller W., Miller W., et al. Galaxy: A platform for interactive large-scale genome analysis. Genome Res. 2005;15:1451–1455. doi: 10.1101/gr.4086505. [DOI] [PMC free article] [PubMed] [Google Scholar]
- Gibbs R.A., Weinstock G.M., Metzker M.L., Muzny D.M., Sodergren E.J., Scherer S., Scott G., Steffen D., Worley K.C., Burch P.E., Weinstock G.M., Metzker M.L., Muzny D.M., Sodergren E.J., Scherer S., Scott G., Steffen D., Worley K.C., Burch P.E., Metzker M.L., Muzny D.M., Sodergren E.J., Scherer S., Scott G., Steffen D., Worley K.C., Burch P.E., Muzny D.M., Sodergren E.J., Scherer S., Scott G., Steffen D., Worley K.C., Burch P.E., Sodergren E.J., Scherer S., Scott G., Steffen D., Worley K.C., Burch P.E., Scherer S., Scott G., Steffen D., Worley K.C., Burch P.E., Scott G., Steffen D., Worley K.C., Burch P.E., Steffen D., Worley K.C., Burch P.E., Worley K.C., Burch P.E., Burch P.E., et al. Genome sequence of the Brown Norway rat yields insights into mammalian evolution. Nature. 2004;428:493–521. doi: 10.1038/nature02426. [DOI] [PubMed] [Google Scholar]
- Hardison R.C., Roskin K.M., Yang S., Diekhans M., Kent W.J., Weber R., Elnitski L., Li J., O’Connor M., Kolbe D., Roskin K.M., Yang S., Diekhans M., Kent W.J., Weber R., Elnitski L., Li J., O’Connor M., Kolbe D., Yang S., Diekhans M., Kent W.J., Weber R., Elnitski L., Li J., O’Connor M., Kolbe D., Diekhans M., Kent W.J., Weber R., Elnitski L., Li J., O’Connor M., Kolbe D., Kent W.J., Weber R., Elnitski L., Li J., O’Connor M., Kolbe D., Weber R., Elnitski L., Li J., O’Connor M., Kolbe D., Elnitski L., Li J., O’Connor M., Kolbe D., Li J., O’Connor M., Kolbe D., O’Connor M., Kolbe D., Kolbe D., et al. Covariation in frequencies of substitution, deletion, transposition, and recombination during eutherian evolution. Genome Res. 2003;13:13–26. doi: 10.1101/gr.844103. [DOI] [PMC free article] [PubMed] [Google Scholar]
- Kampa D., Cheng J., Kapranov P., Yamanaka M., Brubaker S., Cawley S., Drenkow J., Piccolboni A., Bekiranov S., Helt G., Cheng J., Kapranov P., Yamanaka M., Brubaker S., Cawley S., Drenkow J., Piccolboni A., Bekiranov S., Helt G., Kapranov P., Yamanaka M., Brubaker S., Cawley S., Drenkow J., Piccolboni A., Bekiranov S., Helt G., Yamanaka M., Brubaker S., Cawley S., Drenkow J., Piccolboni A., Bekiranov S., Helt G., Brubaker S., Cawley S., Drenkow J., Piccolboni A., Bekiranov S., Helt G., Cawley S., Drenkow J., Piccolboni A., Bekiranov S., Helt G., Drenkow J., Piccolboni A., Bekiranov S., Helt G., Piccolboni A., Bekiranov S., Helt G., Bekiranov S., Helt G., Helt G., et al. Novel RNAs identified from an in-depth analysis of the transcriptome of human chromosomes 21 and 22. Genome Res. 2004;14:331–342. doi: 10.1101/gr.2094104. [DOI] [PMC free article] [PubMed] [Google Scholar]
- King D.C., Taylor J., Elnitski L., Chiaromonte F., Miller W., Hardison R.C., Taylor J., Elnitski L., Chiaromonte F., Miller W., Hardison R.C., Elnitski L., Chiaromonte F., Miller W., Hardison R.C., Chiaromonte F., Miller W., Hardison R.C., Miller W., Hardison R.C., Hardison R.C. Evaluation of regulatory potential and conservation scores for detecting cis-regulatory modules in aligned mammalian genome sequences. Genome Res. 2005;15:1051–1060. doi: 10.1101/gr.3642605. [DOI] [PMC free article] [PubMed] [Google Scholar]
- Lindblad-Toh K., Wade C.M., Mikkelsen T.S., Karlsson E.K., Jaffe D.B., Kamal M., Clamp M., Chang J.L., Kulbokas E.J., III, Zody M.C., Wade C.M., Mikkelsen T.S., Karlsson E.K., Jaffe D.B., Kamal M., Clamp M., Chang J.L., Kulbokas E.J., III, Zody M.C., Mikkelsen T.S., Karlsson E.K., Jaffe D.B., Kamal M., Clamp M., Chang J.L., Kulbokas E.J., III, Zody M.C., Karlsson E.K., Jaffe D.B., Kamal M., Clamp M., Chang J.L., Kulbokas E.J., III, Zody M.C., Jaffe D.B., Kamal M., Clamp M., Chang J.L., Kulbokas E.J., III, Zody M.C., Kamal M., Clamp M., Chang J.L., Kulbokas E.J., III, Zody M.C., Clamp M., Chang J.L., Kulbokas E.J., III, Zody M.C., Chang J.L., Kulbokas E.J., III, Zody M.C., Kulbokas E.J., III, Zody M.C., Zody M.C., et al. Genome sequence, comparative analysis and haplotype structure of the domestic dog. Nature. 2005;438:803–819. doi: 10.1038/nature04338. [DOI] [PubMed] [Google Scholar]
- Pond S.L., Frost S.D., Muse S.V., Frost S.D., Muse S.V., Muse S.V. HyPhy: Hypothesis testing using phylogenies. Bioinformatics. 2005;21:676–679. doi: 10.1093/bioinformatics/bti079. [DOI] [PubMed] [Google Scholar]
- Rodriguez F., Oliver J.L., Marin A., Medina J.R., Oliver J.L., Marin A., Medina J.R., Marin A., Medina J.R., Medina J.R. The general stochastic model of nucleotide substitution. J. Theor. Biol. 1990;142:485–501. doi: 10.1016/s0022-5193(05)80104-3. [DOI] [PubMed] [Google Scholar]
- Siepel A., Haussler D., Haussler D. Combining phylogenetic and hidden Markov models in biosequence analysis. J. Comput. Biol. 2004;11:413–428. doi: 10.1089/1066527041410472. [DOI] [PubMed] [Google Scholar]
- Siepel A., Bejerano G., Pedersen J.S., Hinrichs A.S., Hou M., Rosenbloom K., Clawson H., Spieth J., Hillier L.W., Richards S., Bejerano G., Pedersen J.S., Hinrichs A.S., Hou M., Rosenbloom K., Clawson H., Spieth J., Hillier L.W., Richards S., Pedersen J.S., Hinrichs A.S., Hou M., Rosenbloom K., Clawson H., Spieth J., Hillier L.W., Richards S., Hinrichs A.S., Hou M., Rosenbloom K., Clawson H., Spieth J., Hillier L.W., Richards S., Hou M., Rosenbloom K., Clawson H., Spieth J., Hillier L.W., Richards S., Rosenbloom K., Clawson H., Spieth J., Hillier L.W., Richards S., Clawson H., Spieth J., Hillier L.W., Richards S., Spieth J., Hillier L.W., Richards S., Hillier L.W., Richards S., Richards S., et al. Evolutionarily conserved elements in vertebrate, insect, worm, and yeast genomes. Genome Res. 2005;15:1034–1050. doi: 10.1101/gr.3715005. [DOI] [PMC free article] [PubMed] [Google Scholar]
- Yang Z., Goldman N., Friday A., Goldman N., Friday A., Friday A. Comparison of models for nucleotide substitution used in maximum-likelihood phylogenetic estimation. Mol. Biol. Evol. 1994;11:316–324. doi: 10.1093/oxfordjournals.molbev.a040112. [DOI] [PubMed] [Google Scholar]


