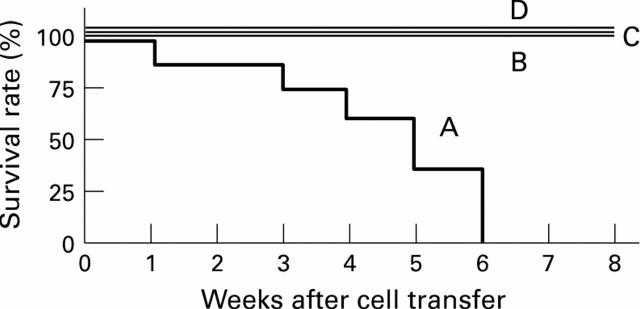
Figure 2 .
: Survival rate of B6 nu/nu mice inoculated with MAIDS spleen cells and control groups of mice. A: B6 nu/nu mice inoculated with MAIDS spleen cells; B: B6 nu/nu mice inoculated with untreated B6 spleen cells; C: B6 nu/nu mice infected with LP-BM5; D: untreated B6 nu/nu mice. Seven mice were used in each group and data were collected from two or three repeated experiments.

