Abstract
Z-curve features are one of the popular features used in exon/intron classification. We showed that although both Z-curve and Fourier approaches are based on detecting 3-periodicity in coding regions, there are significant differences in their spectral formulation. From the spectral formulation of the Z-curve, we obtained three modified sequences that characterize different biological properties. Spectral analysis on the modified sequences showed a much more prominent 3-periodicity peak in coding regions than the Fourier approach. For long sequences, prominent peaks at 2Π/3 are observed at coding regions, whereas for short sequences, clearly discernible peaks are still visible. Better classification can be obtained using spectral features derived from the modified sequences.
Keywords: Z-Curve approach, FT analysis, DNA Sequence, coding region, spectral analysis
Background
A DNA sequence is a long sequence consisting of four types of nucleotides: Adenine (A), Guanine (G), Thymine (T) and Cytosine (C). An important problem for sequence analysis is to distinguish coding (exons) and non-coding (introns and intergenic spaces) regions in a sequence. Sequence features exploiting properties such as codon usage bias, base compositional bias between codon positions, periodicity in base occurrence in coding regions [1, 2] have been proposed for characterizing coding/non-coding regions. The 3-periodicity property of coding regions is particularly interesting and has been studied intensely. A natural choice for detecting such periodicity is the Fourier Transform (FT).
The Z-curve features [3 ] and the FT approach [4 – 6] are both concerned with detecting the 3-periodicity property of coding sequences and are implicitly related. However, there is no theoretical study of the relationship between the two approaches. In this paper, we give a theoretical analysis that reveals the relationships between the two and show that there are significant differences among them. In particular: (1) we provide a theoretical study of the relationship between the two approaches; (2) we provide a justification for the empirical observation that Z-curve approach generally have better performance than FT approach, especially for shorter sequences; and finally, (3) we propose a modification of the basic FT approach based on a new numerical sequence representation derived from Z-curve that preserves biological significance.
Methodology
Results and Discussion
Conclusion
Z-curve features are one of the popular features used for DNA sequence classification and they are closely related to a FT spectral analysis of the sequence for 3-periodicity. In this paper we gave a theoretical study of the relationship between the Z-curve and the FT approach. Our analysis showed that there are significant differences in the spectral interpretation between the two. We discussed the implications of these differences for shorter sequences. Moreover, we showed that the three modified sequences obtained from the spectral reformulation of the Z-curve approach characterize different biological properties and are useful for coding region prediction. In particular, the 3-periodicity is much more prominent in the modified sequences. As a result of our analysis, we proposed to apply spectral analysis to the three modified sequences to better capture the 3-periodicity property embedded in the coding region of a DNA sequence and verified this experimentally.
Supplementary Material
Table 1. Classification results of coding and non-coding sequences.
| Yeast | Human | |
|---|---|---|
| FFT approach | ||
| Sensitivity | 0.8580 | 0.8627 |
| Specificity | 0.8922 | 0.2873 |
| Average | 0.8751 | 0.5750 |
| Proposed approach | ||
| Sensitivity | 0.8607 | 0.7607 |
| Specificity | 0.9558 | 0.8413 |
| Average | 0.9083 | 0.8010 |
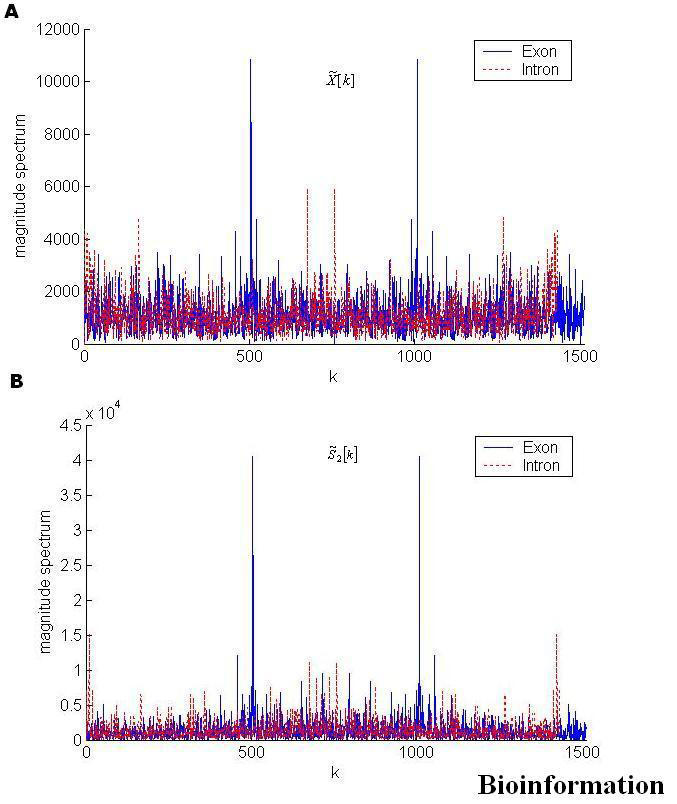
Figure 1.

Magnitude Spectrum in both coding (exons) and non-coding (introns) regions
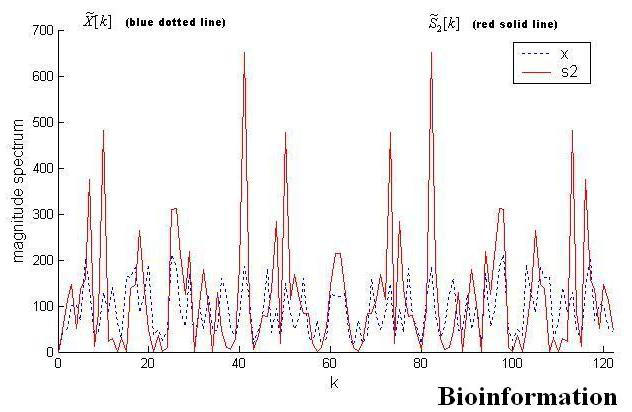
Figure 2.
Magnitude Spectrum for ‘AX136319’
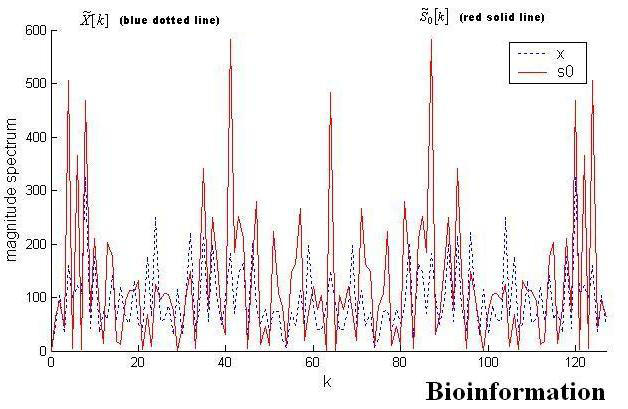
Figure 3.

Magnitude spectrum for ‘AB061839’. No discernible peaks can be observed for blue dotted line at 2Π/3 (k=41)
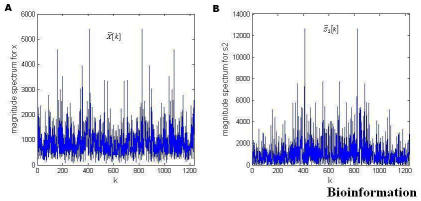
Figure 4.

Magnitude spectrum for ‘AB050050’. No discernible peaks can be observed for blue dotted line at 2Π/3 (k=43).
Acknowledgments
This work is supported by RGC Grant PolyU 5210/04E, the project A-PA2P and the Centre for Multimedia Signal Processing (A452), the Hong Kong Polytechnic University. The authors have no conflict of interest in this work.
Footnotes
Citation:Law et al., Bioinformation 1(7): 242-246 (2006)
References
- 1.Staden R, McLachlan AD. Nucleic Acids Res. 1982;10:141. doi: 10.1093/nar/10.1.141. [DOI] [PMC free article] [PubMed] [Google Scholar]
- 2.Fickett JW. Nucleic Acids Res. 1982;10:5303. doi: 10.1093/nar/10.17.5303. [DOI] [PMC free article] [PubMed] [Google Scholar]
- 3.Zhang CT, Wang J. Nucleic Acids Res. 2000;28:2804. doi: 10.1093/nar/28.14.2804. [DOI] [PMC free article] [PubMed] [Google Scholar]
- 4.Tiwari S, et al. Comput Appl Biosci. 1997;13:263. doi: 10.1093/bioinformatics/13.3.263. [DOI] [PubMed] [Google Scholar]
- 5.Anastassiou D, et al. Bioinformatics. 2000;16:1073. doi: 10.1093/bioinformatics/16.12.1073. [DOI] [PubMed] [Google Scholar]
- 6.Isaac B, et al. Bioinformatics. 2002;18:196. [Google Scholar]
- 7.Liew AWC, et al. Int J of Bioinformatics Res and Applications. 2005;1:181. doi: 10.1504/IJBRA.2005.007577. [DOI] [PubMed] [Google Scholar]
- 8.Wu Y, et al. Phys Rev E. 2003;67:061916. doi: 10.1103/PhysRevE.67.061916. [DOI] [PubMed] [Google Scholar]
Associated Data
This section collects any data citations, data availability statements, or supplementary materials included in this article.


