Abstract
Obtaining structural information about Vif is of interest for several reasons that include the study of the interaction of Vif with APOBEC3G, a resistance factor. Vif is a potential drug target and its function is essential for the HIV-1 infectivity process. To study Vif mechanism of action, we need to decipher its structure. Pivotal in this approach is the painstaking prediction of its protein structure. The three-dimensional (3D) crystal structure for Vif has not been established. In order to understand its mechanism of action, information on the structure of Vif is very much needed. Therefore we undertook this study based on the hypothesis that information from structurally homologous proteins can be used to predict the 3D structure of Vif by computer modeling and threading. As a result the structure of HIV-1 Vif has been modeled and deposited in the theoretical models section and accepted with the PDB code 1VZF. Here, we present the results of the comparative modeling strategy we used to predict the 3D structure of Vif.
Keywords: Vif, HIV-1, 3D structure, computer modeling, threading
Background
Human immunodeficiency virus type 1 (HIV-1) and related lentivirus/retroviruses express six auxiliary genes in addition to the canonical retroviral genes, core proteins (gag), polymerase (pol), and envelope (env). Viruses must overcome diverse intracellular defense mechanisms to establish infection. Virion infectivity factor (Vif) is essential for productive HIV-1 infection of peripheral blood lymphocytes and macrophages, the two major HIV-1 target cells in vivo. However, Vif is not required for production of infectious particles in cell lines. In spite of the prominent phenotype of Vif mutations, the mechanism of its action remains unclear. [1] Vif is a 190-240 amino acid protein that is encoded by all the lentiviruses except for equine infectious anemia virus (EIAV). The amino acid sequence of vif is relatively well conserved among HIV-1 strains, but is only 30% identical to Vif from rhesus macaque SIV. [2] HIV-1 Vif has evolved to suppress at least two distinct but related human antiretroviral DNA-editing enzymes viz. APOBEC3G and APOBEC3F. [3] In contrast, a tandem arrayed gene cluster encoding seven cytidine deaminase genes are present on human chromosome 22 (22q13.1-q13.2). These are APOBEC3A, APOBEC3B, APOBEC3C, APOBEC3DE, APOBEC3F, APOBEC3G, and APOBEC3H. Three of them, APOBEC3G, APOBEC3F, and APOBEC3B, block replication of the human immunodeficiency virus type 1 (HIV-1) and many other retroviruses. [4]
Vif interacts with APOBEC3G (A3G) and APOBEC3F (A3F), cytidine deaminases related to the RNA-editing enzymes. These enzymes are deoxycytidine deaminases and are powerful host antiretroviral factors that can restrict HIV-1 infection. This restriction is counteracted by the HIV-1 Vif protein, whose activity culminates in depletion of A3G and A3F from infected cells. Identification of these key host proteins have allowed for dramatic progress in our understanding of how Vif functions. Vif overcomes A3G, A3F-mediated restriction but by an unknown mechanism. [5] Vif also prevents the encapsidation of A3G into HIV-1 virions during virus assembly. If not for Vif, the encapsidated A3G would damage the virus reverse transcripts in subsequent cell infection, causing their degradation. [6]
Human A3G and the HIV-1 Vif are antagonistic molecules. In the absence of Vif, A3G induces a high rate of dC to dU modifications in the nascent reverse transcripts of HIV that lead to the degradation of the HIV genome. HIV Vif, on the other hand, can suppress the translation and trigger the degradation of human A3G. [7] The Vif acts by overcoming the antiviral activity of A3G, by targeting it for destruction by the ubiquitin-proteasome pathway and thus preventing virion incorporation. [8,9] In the absence of Vif, viruses encapsidate A3G, which acts in part to mutate viral DNA formed during reverse transcription upon subsequent infection in a new cell. [10] Wiegand et al., [3] showed that a second human protein, APOBEC3F (A3F), is also specifically packaged into HIV-1 virions and inhibits their infectivity as well. A3F binds the HIV-1 Vif protein specifically and Vif suppresses both the inhibition of virus infectivity caused by A3F and virion incorporation of A3F. Human A3F and A3G are specifically incorporated into HIV-1 progeny virions in the absence of Vif, where they deaminate deoxycytidine to deoxyuridine on the minus strand of nascent reverse transcripts. [11] To the virus' advantage, HIV-1 Vif protein protects the virus from A3Gmediated inactivation by preventing incorporation of A3G into progeny virions and allowing the subsequent round of infection to proceed without DNA deamination. [12] Moreover, vif targets A3F and A3G for polyubiquitylation and proteasomal degradation [4] via the ubiquitinproteasome pathway and implicates the proteasome as a site of dynamic interplay between microbial and cellular defenses. [8] Vif achieves this effect by depleting the intracellular stores of A3G, thus making this antiviral enzyme unavailable for incorporation into budding virions. A3G depletion involves the recruitment of a specific E3 ligase complex by Vif leading to the polyubiquitylation and proteasome-mediated degradation of this enzyme. [13] The formation of an SCF-like E3 ubiquitin ligase complex composed of Cullin5, Elongin B, and Elongin C (Vif-BCCul5) through a novel SOCS-box motif, suggested that the E3 ubiquitin ligase activity of the Vif-BC-Cul5 complex is essential for Vif function against A3G. [14]
A mutation of highly conserved cysteines or the deletion of a conserved SLQ(Y/F)LA motif in Vif results in mutants that fail to induce A3G degradation and produce noninfectious HIV-1; however, mutations of conserved phosphorylation sites in Vif that impair viral replication do not affect A3G degradation, suggesting that Vif may be important for other functions in addition to inducing proteasomal degradation of A3G. [8]
The potent activity of A3G has led to considerable interest in the identification of small molecules that interrupt the Vif-induced degradative process. [13] Inhibitors of this interaction might therefore prove therapeutically useful in blocking Vif-mediated A3G destruction. [5] The findings of Sheehy et al., [12] indicated that pharmacologic strategies aimed at stabilizing A3G in HIV-1 infected cells should be explored as potential HIV/AIDS therapeutics.
In this paper, as a first step we present a theoretical structure of Vif to explore its function further. This model also provides specific geometric details about mutation sites. The computational model presented in this work provides a paradigm approach to obtain information on inter-helix interactions that could prove valuable in obtaining an improved crystal structure of Vif and will also be useful in phase determination of x-ray diffraction data.
Methodology
Identification of structurally homologous proteins
To search for structural homologues of Vif, the complete amino acid sequence of Vif (NCBI Protein: CAC05363) was submitted to the Basic Local Alignment Tool (BLAST) http://www.ncbi.nlm.nih.gov/BLAST/. [15] However, it does not yield any significant templates from Protein Data Bank (PDB) http://www.rcsb.org/pdb/home/home.do. Therefore it was re-submitted to the PredictProtein server http://www.predictprotein.org/. [16] This server returns a multiple sequence alignment and predictions of secondary structure, residue solvent accessibility, and the location of transmembrane helices. [17–20] The secondary structure of Vif was then threaded, using this information against proteins in the PDB. Threading is a method by which one takes the sequence and “threads” it through each template in the library (PDB). The word threading implies that one drags the sequence step by step through each location on each template. This search-method results in the best arrangement of the sequence as measured by a score or quasi-energy function. The PredictProtein program detects remote homologues (0–25% sequence identity) by a novel prediction-based threading method. [21,22] To recognize folds by threading, the PredictProtein program evaluates the amino acid sequence of a protein and determines how well it fits into the 3D configuration of proteins whose structures are known. The goal is to detect similar motifs of secondary structure and accessibility between a sequence of unknown structure and a known fold. Proteins with known 3D structure and the highest degree of structural homology to Vif were identified by Predict-Protein, which also provided summary information on these proteins from the server via e-mail.
Identification and alignment of structurally conserved regions
The multiple sequence alignment function in PredictProtein is automatically returned in the report from PredictProtein and is built up in two steps. [23] In step 1, sequences are aligned consecutively to the search sequence by a standard dynamic programming method. After each sequence is added, a profile is compiled and used to align the next sequence. In step 2, after all sequences with significant structural homology have been selected from SWISSPROT, the profile is recompiled and the dynamic programming algorithm commences once again to align the sequences consecutively, this time using the conservation profile as derived after completion of sweep 1. The output consists of structurally homologous proteins with regions automatically aligned to Vif. In addition, the known and the predicted secondary structures of the PDB proteins and Vif are shown. With this information, we manually highlighted areas of predicted secondary structure in Vif that were identical to the known structural homologue proteins.
Assignment of coordinates
DeepView (Swiss-PdbViewer) is tightly linked to SWISSMODEL [24] an automated homology modeling server that was used in combination with the downloaded Vif sequence. With these two programs it is possible to thread a protein primary sequence onto a 3D template and obtain an immediate feedback of how well the threaded protein will be accepted by the reference structure prior to submitting a request to build missing loops and refine side chain packing. The PDB files of the three best-fitting structural homologues of Vif identified by PredictProtein were downloaded and individually manually aligned to Vif, according to the alignment suggested by PredictProtein. Secondary structures were predicted around the Vif sequences by using nnPredict [25] that was found to be structurally homologous to the other PredictProtein listed proteins. With Swiss-PdbViewer, manually and carefully adjusted the alignment and transmitted the project file to SWISS-MODEL through SwissModel optimize mode. Coordinates were then assigned based on the known reference protein structure (1BK0). All coordinates were transferred if the side chains of the reference and model proteins were at the same corresponding locations along the sequence of the structurally conserved region. However, if these locations differed, only the backbone coordinates were transferred and the side chain atoms were automatically replaced to preserve the Vif model's residue types. These replaced residues were first aligned to the backbone of the original residue; the dihedral angles in common with the residue being replaced were also aligned. This allowed the conformation of the reference side chain to be preserved as much as possible.
Loop generation
Since only fragments of the Vif protein had structural homology to any known proteins, and gaps existed in between the alignment, loops had to be generated. This was done using the method described by Shenkin et al.,. [26] Briefly, a conformational search with random settings of Phi and Chi angles was made in order to build a peptide backbone chain connecting two conserved peptide segments. A set of six distances was defined using two atoms in the start residue at the amino-terminus of the loop and two atoms at the carboxyl-terminus stop residue of the loop. These distances were required to meet specific criteria for the loop to be acceptably closed. The loops were generated by using the “Build Loop” option of DeepView, which uses energy information computed with a partial implementation of the GROMOS Force-Field [27] and a mean force potential value (PP) computed from a “Sippllike” mean force potential. [28] This process also used the “Scan Loop” option that gave the name of PDB files that contain a suitable loop, the chain identifier, the starting residue, the sequence of the possible fragment, and the resolution (in Å) at which the structure has been solved. The similarity score for the fragment was also computed from the PAM200 matrix. In addition to those calculations, a clash score, and the number of residues from the source loop that have inappropriate phi/psi angles were also obtained to sort the loops by energies (or clashes) to ease the process of identifying the best loop. Finally, an energy minimization was performed and the geometry of the loop was checked for proper chirality and steric overlap violations. Those conformations were accepted that close the loop.
Structure check
To assess the geometric correctness of the theoretical structure, the following programs were used; VERIFY 3D [29] for assessment of the Vif model with threedimensional profiles, WHATIF [30] to validate the Vif structure, PROCHECK [31] to check the stereochemical quality of Vif and plots its overall and residue-by-residue geometry, and WHATCHECK [32] to find out errors in Vif protein structure. These programs checked the proteinspecific bond lengths, angles, and torsions of the theoretical Vif protein model. The parameters checked included phipsi angles, chi1 dihedral angles, chi2 dihedral angles, mainchain (back-bone) parameters, side-chain parameters, residue properties, main-chain bond length and bond angle distributions, RMS distance from planarity and distorted geometry plots etc. This process not only assessed the geometric validity of the proposed structures, but also focused attention on problem areas in the structure.
Helix-Helix interactions in Vif
We have used two methods employed by Anne et al., [33] to delineate atom–atom contacts between two helices: (1) a distance-based constraint and (2) a method based on considerations of atomic packing.
For the distance-based constraint, atoms from two helices were determined to interact if the distance between them was less than the sum of their van der Waals radii plus a threshold value of 0.6 Å. Two helices were assumed to interact if at least three van der Waals contacts were found.
The second method that we used to determine contacts between two helices considers the partitioning of space between them using the Voronoi method. [34–37] Along with a set of standard radii that have been optimized for calculations of packing in proteins. [38] Briefly, the Voronoi method partitions space around the atoms in a molecule, constructing a polyhedron around each atom. The number of atom–atom contacts between helices determined by this method is closely correlated to the number of contacts found by the distance-constraint method, but is not identical.
When determining atom–atom contacts based on packing, we considered not only the atoms comprising two interacting helices, but also neighboring atoms that do not belong and are external to one of the interacting helices (the ‘environment’). The environment surrounding each atom is important to determining the Voronoi polyhedra. For the packing calculations, Anne et al., [33] included atoms within 6.0 Å of the atoms associated with the pair of interacting helices. We chose this cutoff value of 6.0 s by performing calculations using a series of different cutoff values; this value constitutes the threshold above which adding more atoms from the environment does not change the packing results. The report for atom–atom contacts determined using this method is accessed on the website http://helix.gersteinlab.org
Results
Vif protein sequence from HIV1 [NCBI Protein: CAC05363] of length 194 amino acid residues were submitted to BLAST search against PDB, and only 42 residues were matched with some crystal structures like horseradish peroxidases, barley grain, Arabidopsis thaliana etc., with E-values 2.3, 3.0 and more. Because of the higher E-value and only because of a fragment match, we neglected these templates as they are insignificant. Hence, we used TOPITS [22,39] and prediction-based threading was performed.
The Predict Protein program identifies the 20 closest structural homologues from threading-based prediction TOPITS (Threading One-dimensional Predictions In to Three-Dimensional Structures) and provides a z score for each. The z score is derived from the final alignment score minus the alignment score averaged over a background distribution of alignments, divided by the standard deviation for that distribution. This score is highly dependent on the similarity of characteristics including alignment length, compositions of secondary structure, and accessibility of amino acids between the protein of known 3D structure and the protein of interest. The higher the z score, the higher the probability that the first hit is correct. In general, an alignment z score (ZALI) with z > 3 is more reliable. Threading one-dimensional predictions in to three-dimensional structures (TOPITS) yielded twenty different templates. Nevertheless, based on the ZALI score first three templates were chosen. The first three ranks of protein templates to model Vif are Isopenicillin N synthase from Aspergillus nidulans [PDB: 1bk0], Telomere-Binding Protein of Oxytricha nova [PDB: 1otc_A], and Uvrb Protein of Thermus thermophilus [PDB: 1d2m_A]. Only the first template was considered as a better template based on the statistical significance. By using PIR pairwise alignment the template was found to have a Smith-Waterman score of 75 and have 24.667 % identity with HIV-1 Vif. The reliability was compared by ZALI score of the templates, and in addition a better template with higher ZALI score (2.20) among the scored templates was selected and used for this modeling procedure. In the absence of the best template, we have selected the first scored template [PDB: 1BK0]. Homology models were constructed using a combination of the Swiss-PDB viewer (Deep View) and the Swiss-Model online modeling server (project-optimize mode) for assigning atomic coordinates.
A sequence alignment of Vif and the template [PDB: 1BK0] is presented in Figure 1. Prediction of the secondary structure for Vif is based on the sequence and structure comparison taken into account. In order to validate our method to predict the secondary structure, we have first used the 1BK0 (template) as a test sequence. Using the software SOPMA [40] we obtain correctly predicted structural elements. Such prediction results provide confidence with respect to the reliability of the Vif structure prediction paradigm.
Figure 1.
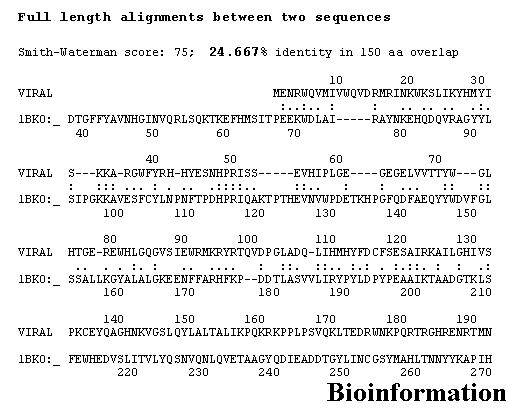
Sequence alignment between target (Vif) and template (PDB: 1BK0) shows 24.667% sequence identity
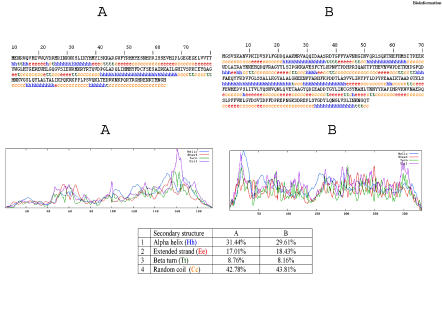
The secondary structure elements of the template and the structural prediction of the Vif are shown in Figure 2. The comparison between the secondary structure elements observed in the template crystal structure and the prediction made for Vif (Figure 3) shows that beta strands and alpha helices are almost perfectly superimposed, though some residues of the template are not aligned because of the large sequence length. The alignment shows 24.667 % sequence identity, with insertions and deletions (Indels) primarily localized in loops.
Figure 2.
Secondary structure profile of Vif shown in A and for the template (1BK0) in B
Figure 3.
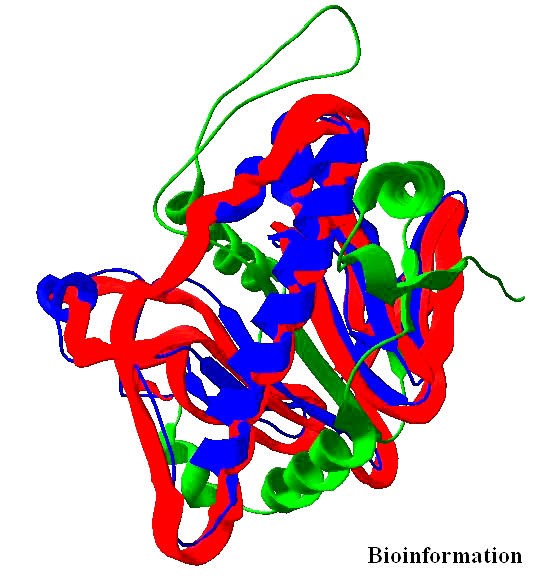
Structural alignment of template [PDB ID: 1BK0] and target (HIV- 1Vif). Aligned regions are shown in blue whereas unaligned regions are shown in green color. Target is superimposed and shown in red color
The alignment of the better template [PDB: 1BK0] with Vif (target) was done and the positions of the experimentally observed secondary structure elements of the template and of the predicted secondary structure of Vif were superimposed on the aligned sequences. The structures are depicted in the Figures 3 & 4. The aligned template [1BK0] with target [Vif] was used to build and refine the Vif model. The model was iteratively minimized for energy and subjected to structure verification and evaluation. The Sasisekaran-Ramakrishnan-Ramachandran diagram (or simply “Ramachandran plot”) of PROCHECK [31] showed 82.2% residues in most favored regions with 1.2% residues in disallowed regions.
Figure 4.
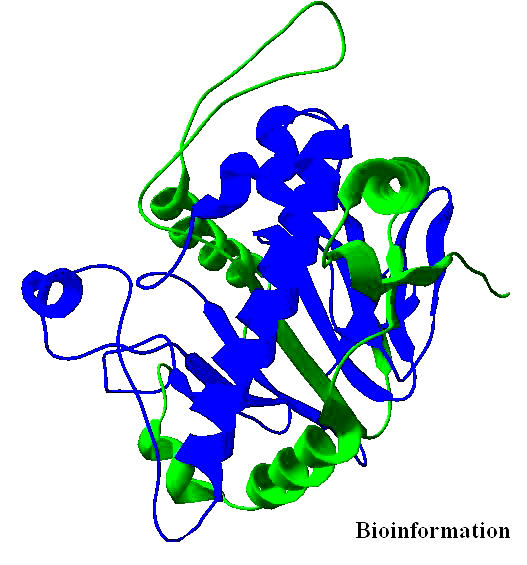
Structure of the template [PDB ID: 1BK0].Regions of the templates used for modeling is shown in blue and those regions not used for modeling is shown in green color
The Ramachandran plot (Figures 5) shows the phi-psi torsion angles for all residues in the Structure (except those in the chain termini). Glycine residues are separately identified by triangles. The shading on the plot represents the different regions described in Morris et al., [41] The darkest areas correspond to the “core” regions representing the most favorable combinations of phi-psi values.
Figure 5.
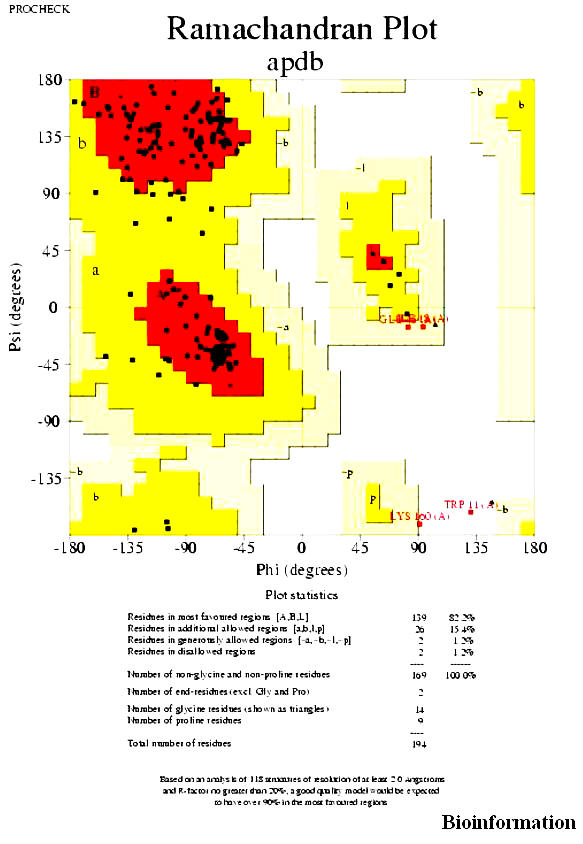
The Ramachandran plot of the protein Vif (for details refer text)
Ramachandran plots for all residue types
Separate Ramachandran plots (Figures 6a, b, & c) are shown for each of the 20 different amino acid types. The darker the shaded area on each plot, the more favorable is the region. The lightly shaded residues are in favorable regions and the darkly shaded are external to the favorable region. The numbers in brackets, following each residue name, show the total number of data points on that graph. The numbers above the data points refer to the residues lying in unfavorable regions of the plot. Ten residues of Vif are in unfavorable regions.
Figure 6.

(a), (b) & (c) Ramachandran plots for individual amino acids in the protein Vif (for details refer text)
Chi1-Chi2 plots
The Chi1-Chi-2 plots (Figures 7a & b) show the chi1-chi2 side chain torsion angle combinations for all residue types whose side chains are sufficiently long to have these angles. The darker shading indicates the most favorable regions. The number in brackets, following each residue name, shows the total number of data points on the graph. The numbers above the data points refer to the residues lying in unfavorable regions of the plot.
Figure 7.
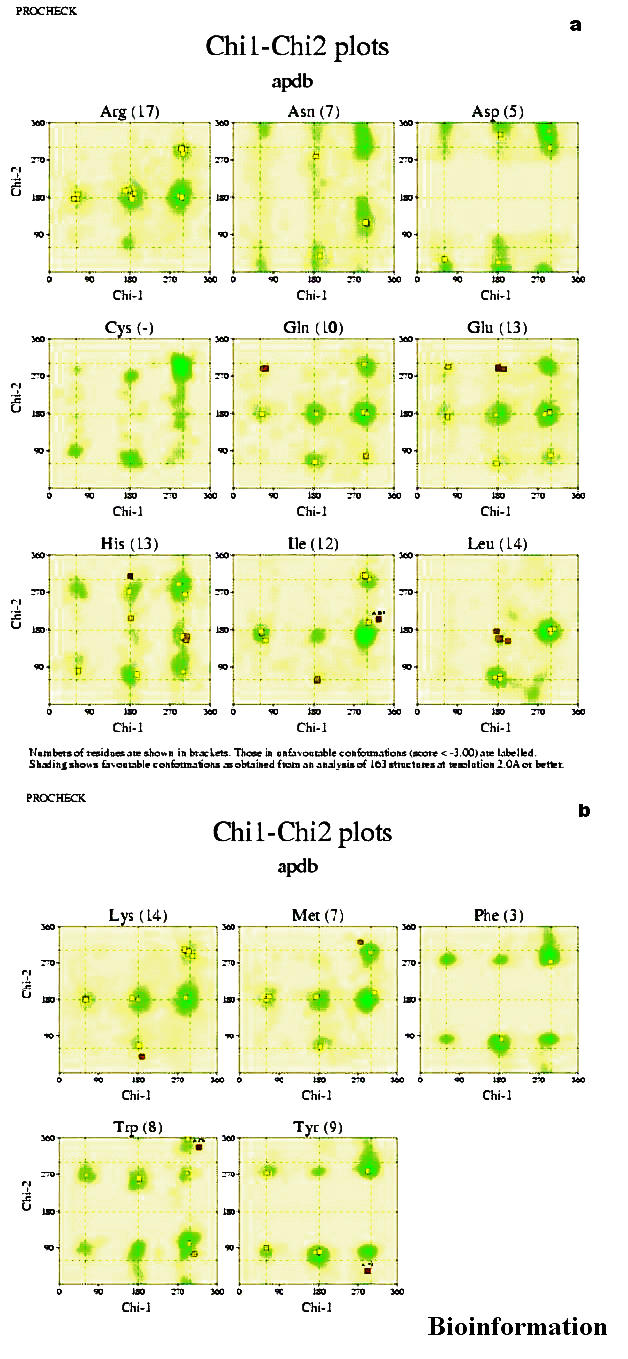
(a) & (b) Side-chain torsion angle plots (chi1 & chi2) for the modeled protein
Main-chain parameters
The six graphs on the main chain parameters (Figure 8a) plot show how the structure (represented by solid square) compares with well-refined structures at a similar resolution. The dark band in each graph represents the results from well-refined structures; the central line is a least squares fit to mean trend as a function of resolution, while the width of the band on the either side of it corresponds to a variation of one standard deviation about this mean.
Figure 8.

(a) Main-chain parameters for Vif; (b) Side-chain parameters for Vif (for details refer text)
a) Ramachandran plot quality
This property is measured by the percentage of the protein residues that are in the most favored or core regions of the Ramachandran plot. For a good model structure, obtained at high resolution the percentage would be over 90%. The solid square reflects that it tends towards the central line (least square fit).
b) Peptide bond planarity
This property is measured by calculating the standard deviation of the protein structure's omega torsion angles. The solid square is exactly on the central line (least square fit).
c) Inappropriate non-bonded interactions
This property is measured by the number of inappropriate contacts per 100 residues. Inappropriate contacts are selected from the list of non-bonded interactions found by program NB. They are defined as contacts where the distance of closest approach is less than or equal to 2.6A.The solid square (Vif) tends towards 2A. So the model is good.
d) C alpha tetrahedral distortion
This property is measured by calculating the standard deviation of the zeta torsion angle. The solid square (Vif) is touching on the band and it is at 2.0 A resolution.
e) Main-chain hydrogen bond energy
This property is measured by the standard deviation of the hydrogen bond energies for main-chain hydrogen bonds. The solid squares the central line (least square fit) and are within the band and have resolution 2.0A.
f) Overall G-factor
This overall G-factor is a measure of the overall normality of the structure. The solid square is on the outer band and has resolution 2.0A.
Side-chain parameters
The five graphs on the side-chain parameters plot (Figure 8b) show how the structure (represented by the solid square) compares with well-refined structures at a similar resolution. The dark band in each graph represents the results from the well-refined structures; the central line is a least square fit to mean trend as a function of resolution, while the width of the line corresponds to a variation of one standard deviation about the mean. In all cases the trend is dependent on the resolution.
Standard deviation of the chi-1 gauche minus torsion angles.
Standard deviation of the chi-1 trans torsion angles.
Standard deviation of the chi-1 gauche plus torsion angles.
Pooled standard of all chi-1 torsion angles.
Standard deviation of the chi-2 trans torsion angles.
In all the five graphs the solid square has 2.0A resolution, indicating an improved model.
Residue properties
The various graphs and diagrams (Figures 9 a & b) on this plot show how the protein's geometrical properties vary along its sequence. This gives a visualization of which regions appear to have consistently poor or unusual geometry and which have more normal geometry. The unusual values are highlighted in red. The properties plotted are as follows:
Absolute deviation from mean chi-1 value (excluding proline)
Absolute deviation from mean of omega torsion
C-alpha chirality:absolute deviation of zeta torsion
Secondary structure and average estimated accessibility. The secondary structure plot shows a schematic representation of the Kabsch and Sander [42] secondary structure assignments. The key just below the picture shows which structure is which. Beta strands are taken to include all residues with a Kabsch and Sander assignment of E, helices corresponds to both H and G assignments, while the other things are random coils. The shading behind the schematic picture gives an approximation to the residue accessibilities.
Sequence & Ramachandran regions This shows the sequence of the structure (using 20 standard single letter amino acid codes) and sets of markers that identify the region of the Ramachandran plot in which each residue is located. There are four marker types, one for each of the four different types of region: core, allowed, generous and disallowed. The residues lie in the most favored and allowed region.
Maximum deviation: The small histogram of asterisks and plus signs shows each residue's maximum deviation.
G-factors:
The shaded squares give a schematic representation of each residue's G-factor values. Regions with many dark squares correspond to regions where the properties are unusual, as defined by a low (or negative) G-factor. These may correspond to highly mobile or poorly defined regions such as loops, or may need further investigation. Some dark squares are represented in the figure.
Figure 9.
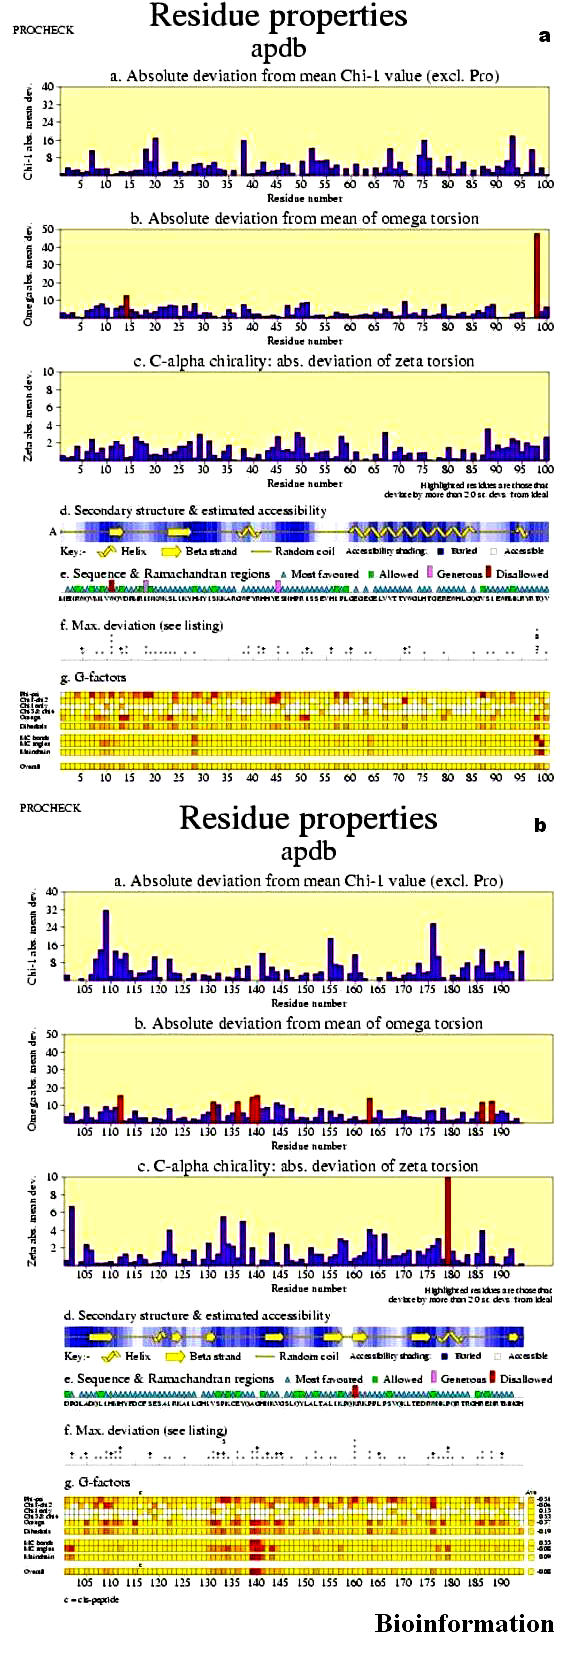
(a) & (b): Residue properties for Vif (for details refer text)
Main-chain bond lengths
The histograms on this plot (Figure 10a) show the distributions of each of the different main-chain bond lengths in the structure. The solid line in the centre of each plot corresponds to the small-molecule mean value, while the dashed lines either side show the small-molecule standard deviation, the data from Engh and Huber. [43] The histograms fit in to the dotted lines with some deviations.
Figure 10.

(a) Main-chain bond lengths of the protein Vif (for details refer text); (b), (c): Main-chain bond angles of the protein Vif (for details refer text)
Main-chain bond angles
The histograms on this plot (Figures 10b & c) show the distributions of each of the main chain bond angles in the structure. The solid line in the centre of each plot corresponds to the small molecule mean value, while the dashed lines either side show the small molecule standard deviation, the data, from Engh and Huber. [43] The histograms exactly fit in to the dotted lines show the perfect ness in the bond length, except a C-O bond length which is off the graph.
Root Mean Square (RMS) distances from planarity
The histograms show the RMS distances (Figure11a) from planarity for the different planar groups in the structure. The dashed lines indicate different ideal values for aromatic rings (Phe, Tyr, Trp, His) and for planar end-groups (Arg, Asn, Asp, Gln, Glu). The default values are 0.03A and 0.02A.Histogram beyond the dashed lines are shown as highlighted in red color.
Figure 11.
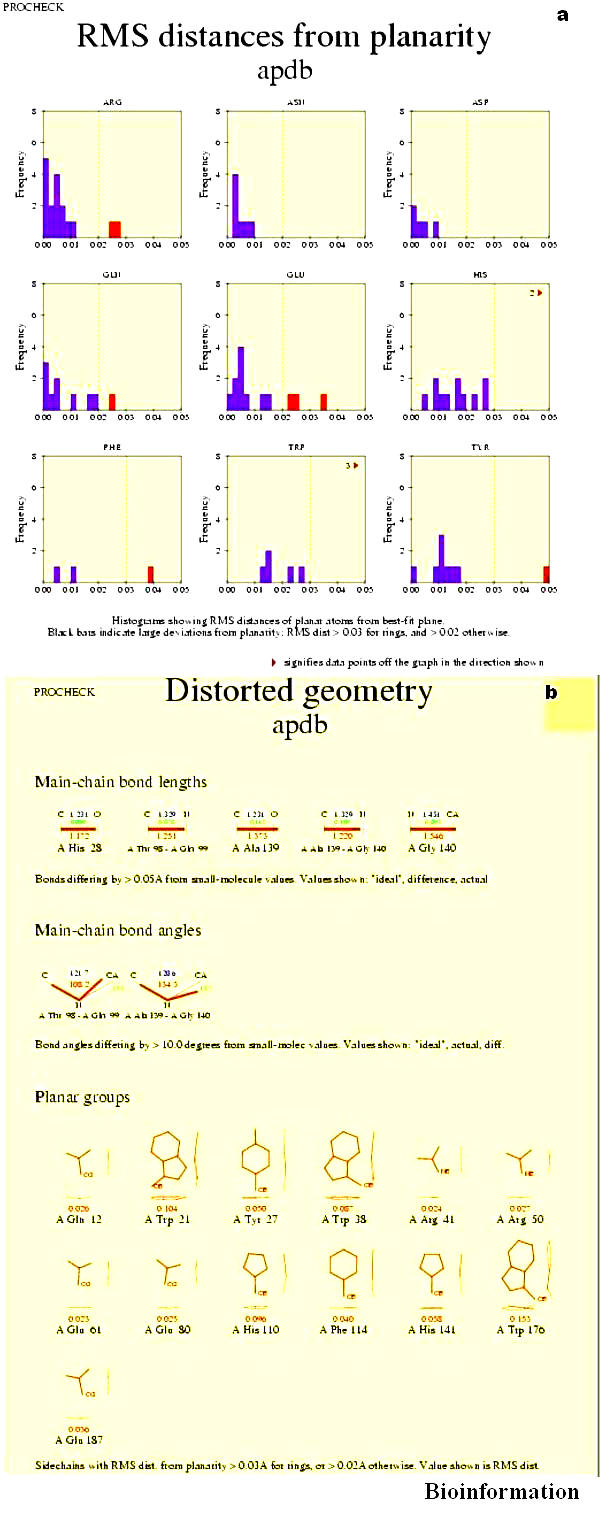
(a) RMS distances from planarity for different planar groups in Vif (for details refer text); (b) Distorted geometry in Vif (for details refer text)
Distorted geometry
The main chain bond lengths and planar groups (Figure 11b) are shown. Bonds differing by >0.05A from small molecule values. Ideal, difference and actual values are shown. Ramachandran plot statistics shows 82.2 % residues are in the most favorable region (core region) and 15.4% residues are in the additionally allowed region and only four residues are in disallowed region. The score corresponding to the chi-1/ chi-2 angles of all residues is within expected ranges with slight deviations. The model has a normal distribution of residue types over the inside and the outside of the protein. Again, the backbone conformation analysis gives a score that is normal with slight deviations. In the Vif model, bond angles and lengths can be considered to deviate normally from the mean standard bond angles. Further verification with VERIFY 3D [44] for Vif (Figure 12) shows the model is good, although some differences exist in flexible loops, residues ranging from 85-105 and 115-130 have impaired structure. Using the averaged data points produced for each amino acid in the sequence, the number of times the value is greater than 0.2 is converted into the percentage of the sequence that has positions with values > 0.2. If this percentage is < 20% then the model is satisfactory, but our model has 29.74% of the residues had an averaged 3D-1D score > 0.2, therefore the results suggested further refinement. WhatCheck [32] was also used to evaluate the final structure, showed some side chain planarity problems, connections to rings out of plane, abnormally short interatomic distances, abnormal structural average packing Zscore, backbone Z-score conformation very low, His, Asp, Gln side chain flips. Also showed some warnings like chirality deviations, high improper dihedral angle deviations, unusual bond lengths, unusual bond angles, unusual Proline puckering phases, unusual conformations in the backbone torsion angle, unusual inside/outside residue distribution, low packing Z-score for some residues, abnormal Z-score packing for sequential residues, unusual rotamers, unusual backbone conformations, buried unsatisfied hydrogen bond donors, buried unsatisfied hydrogen bond acceptors. Manual refinement was made before using the final structure as the starting point for some analysis of Vif. GROMOS '96 [27] was used to refine the obtained model further by energy minimization. Because initial PROCHECK validation resulted only 78% of residues in most favored region of Ramachandran plot. Iterative energy minimization and loop building were performed until the molecules attain a stable conformation, which gives rise to 82.2% of residues in most favored region of Ramachandran plot. Finally the stereochemical quality of the final model (Shown in Figure 13) is once again subjected to validation analysis with Auto Deposition Input Tool (ADIT) validation service at Research Collaboratory for Structural Bioinformatics (RCSB). The coordinates of modeled HIV-1 Vif were deposited at the Protein Data Bank (PDB) [45] and has been accepted with the PDB code 1VZF.
Figure 12.
VERIFY3D plot for the modeled protein Vif
Figure 13.
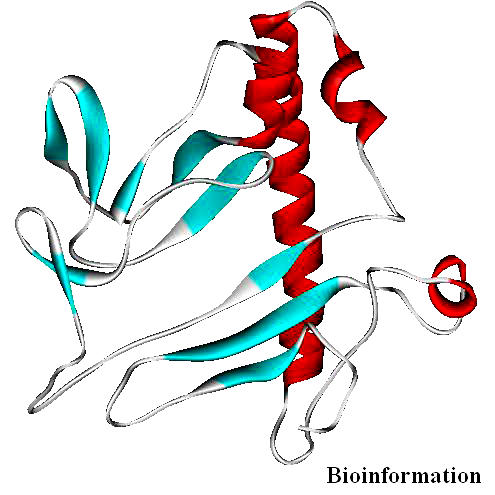
Structure of the final model of VIF (PDB code 1VZF) showing its secondary structural elements
Discussion
The modeling of Vif presents a unique challenge for several reasons. Vif is an important protein in the HIV life cycle and increased understanding of HIV replication and molecular biology will greatly enhance the defeat of this world-wide epidemic infection. The availability of the template provides access for our analysis. Our choice of template [PDB 1BK0] showed 24.667 % (~25%) sequence identity with Vif. Secondary structure was also predicted for the Vif sequence that was found to be structurally homologous to the template. For protein sequences Doolittle's rule of thumb [46] is that greater than 25% identity will suggest homology, less than 15% is doubtful and for those cases between 15-25% identity a strong statistical argument is required. The extent of similarity between two sequences is based on the percent of sequence identity and/or conservation. In production of an atomic model based on medium resolution experimental data, a balance must be found between stereochemical quality and fidelity to the experimental data. In several places, fidelity to the medium resolution crystal structure led to non-ideal backbone geometries.
Yang et al., [47] experimentally identified three phosphorylation sites in Vif, all within the C-terminus, Ser144, Thr155, and Thr188. In our model (NCBI Protein: CAC05363), the phosphorylation sites observed are Ser146, it is in the highly conserved SLQXLA motif at positions 144–149 (Figure 14), which is conserved among Vif sequences from all lentiviruses. [48,49] Thr188, which is contained in the motif R/KXXXS/T recognized by cGMPdependent protein kinase (PKG), is highly conserved among HIV-1 Vif sequences, but is not conserved in HIV-2 or SIV. [49] But in the data we use, a slight shift is observed in Threonine too, which is in the position 190 (Thr 190). Thr155 is contained in the motif S/TXR/K, another protein kinase C (PKC) consensus phosphorylation site. This Threonine residue is not conserved among different HIV-1 sequences as rightly mentioned by Yang et al, [47] therefore in our model it is observed in Thr 153.
Figure 14.
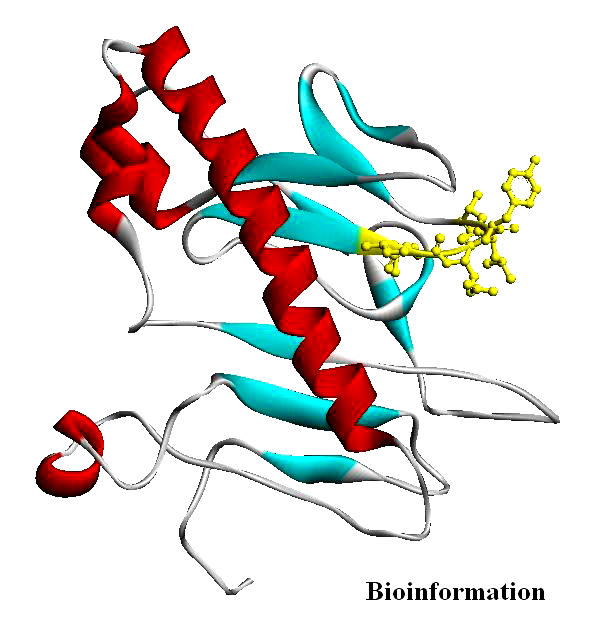
Ser146 is in the highly conserved SLQXLA motif at positions 144–149, highlighted as yellow ‘ball and stick’ representation
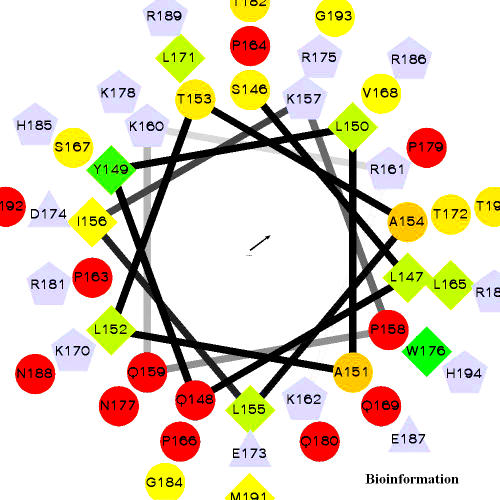
Since Ser144 is a major phosphorylation site in Vif and moreover it is the most highly conserved amino acid among the three phosphorylation sites identified by Yang et al [47], we are tempted to check the structural location of Ser144. As Yang et al replaced Ser144 with alanine by sitedirected mutagenesis to determine whether it is important for Vif activity and HIV-1 replication, we have also mutated Ser146 with Ala146 by DeepView and identified the positional impact (Figures 15a & b). The extra hydroxyl group of Serine forms a hook/clamp like structure in front of the cavity, whereas Alanine has only CH3 side-chain loose its hook like structure which is essential for phosphorylation. The structural change might be also a factor for the loss of Vif activity. Phosphorylation at Ser144 is important for Vif function and HIV-1 replication. [47] All three Vif phosphorylation sites observed in the structure are localized within the C-terminal region. The hydrophilicity and hydrophobicity of the C-terminal residues (residues from 146-194, which includes Ser146, Thr153, and Thr190) are plotted in the form of an Helical Wheel (Figure 16). This also includes C-terminal lysines, since it is essential because Goncalves et al., [50] demonstrated that mutation of these lysines within the Vif C-terminus disrupts membrane targeting of Vif and virus infectivity.
Figure 15.
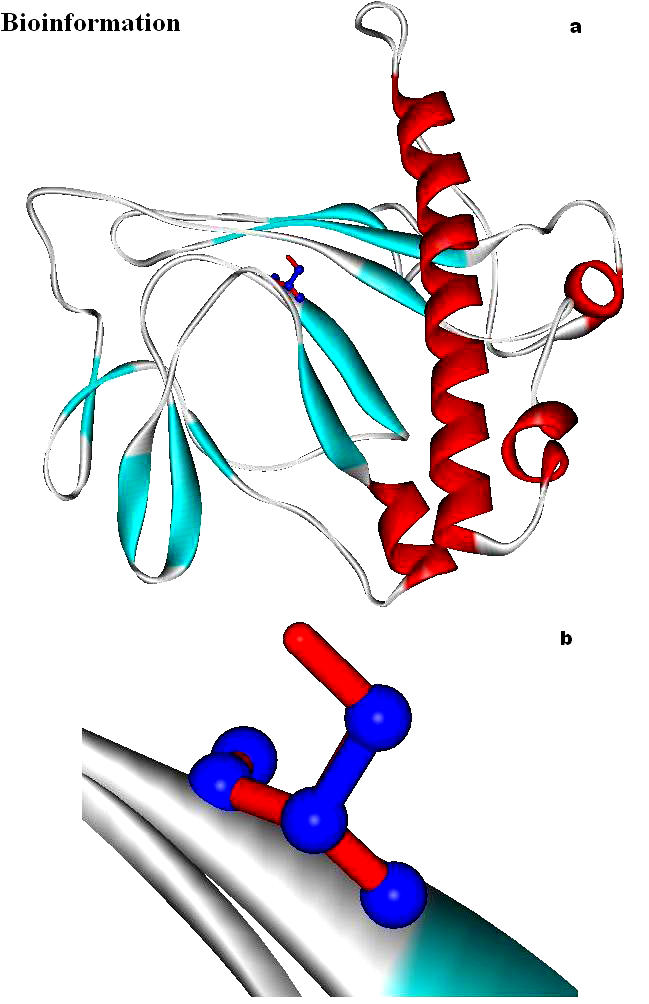
(a) Mutation of Ser146 (red) with Ala 146 (blue), represented as stick model; (b) Magnified mutated area shows the hook like Serine 146 (red) and Alanine 146 (blue) shows the loss of the hydroxyl hook
Figure 16.
Helical Wheel presents the nature of the C-terminal residues from 146-195, which has the highly conserved SLQXLA motif. Hydrophilic residues are represented as circles, hydrophobic residues as diamonds, potentially negatively charged as triangles, and potentially positively charged as pentagons. Hydrophobicity is color coded as well: the most hydrophobic residue is green, and the amount of green is decreasing proportionally to the hydrophobicity, with zero hydrophobicity coded as yellow. Hydrophilic residues are coded red with pure red being the most hydrophilic (uncharged) residue, and the amount of red decreasing proportionally to the hydrophilicity. The potentially charged residues are light blue
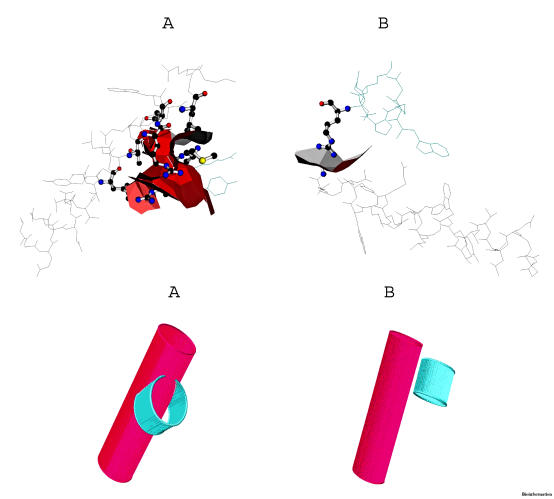
Kyte and Doolittle's hydropathy plot [51] (Figure 17) shows the window position values on the x-axis of the graph reflect the average hydropathy of the entire window, with the corresponding amino acid as the middle element of that window. When the window size is nine, strong negative peaks indicate possible surface regions of globular proteins. This observation suggests that the C-terminal region of Vif is likely to be exposed on the surface of the molecule and thus is accessible to the Vif kinase(s). [47] The Vif C terminus from positions 150 to 192 is likely to be an exposed region of the molecule. Thus, the relative accessibility of the Vif C terminus may permit interactions between this domain and other proteins, including protein kinases. The clusters of basic residues in the Vif C terminus may interact electrostatically with a membrane-associated protein(s) to anchor Vif to the membrane surface. [52] This observation raises the possibility that phosphorylation of Vif may play a role in modulating its association with membrane-associated protein(s) or lipids by introducing negative charges into the molecule. Possibly, the phosphate residues have ponderal effects as well, due to their over-all sizes. The domain binding analysis has to be done in order to determine the domain interactions of Vif. Moreover, it has been shown that the Vif dimerizes and can form higher order structures after oligomerization. Surface amino acids have to be specific to the virus to allow correct dimerization of the Vif and /or interaction with itself. In many proteins, helix–helix interactions can be critical to establishing protein conformation (folding) and dynamics, as well as determining associations between protein units. The self interactions of alpha helices (Figures 18 a & b) were also identified in the Vif structure (1VZF) using Helix Interaction Tool (HIT) [33] available online [http://helix.gersteinlab.org/]. These methods can be used for analysis of individual protein conformations or to gain insight into dynamic changes in helix interactions.
Figure 17.
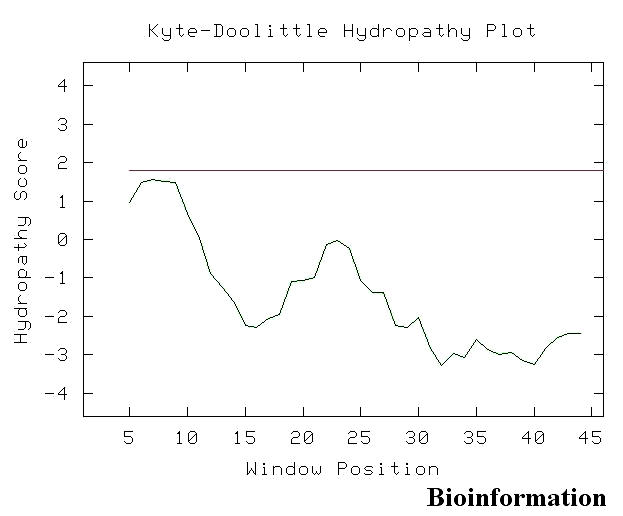
Kyte and Doolittle's hydropathy plot for Vif C-terminal (for details refer text)
Figure 18.
(a) & (b): Visualization of the helix-helix interaction for helices 2 and 3 (Left-hand side), as well as 2 and 5 (Right-hand side) of Vif (PDB ID: 1VZF). Part (A) shows hydrogen bonding within the two helices with geometric characteristics. Part (B) focuses specifically on the helix-helix interface; the surface depicted between the helices is formed by the shared polyhedra faces derived from the Voronoi packaging calculation
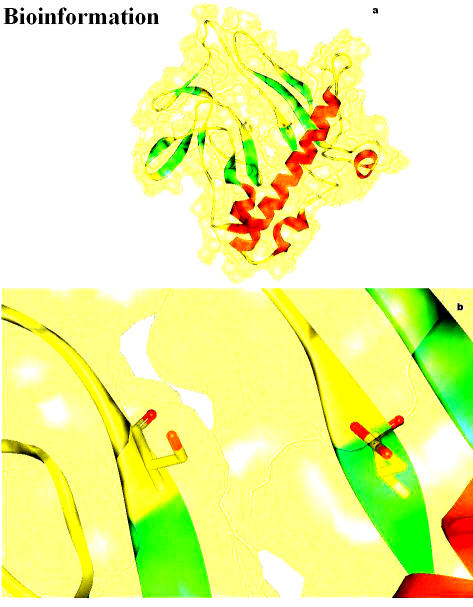
The electrostatic potential of the Vif structure predicted by Deep View is presented in Figure 19. This figure shows the basic charge distribution on the surface of the model. Electrostatic potentials are computed using simple coulomb interaction. The protein is assumed to be at pH 7.0, with default protonation states for all residues by using atomic partial charges and by the default protein dielectric constant. The structure has five Aspartic acid residues (at positions 14, 101, 106, 115, 174) and thirteen Glutamic acid residues (at positions 2, 45, 54, 61, 63, 65, 78, 80, 90, 119, 136, 173, 174, 187). Among those, we observed Glu54, 63 and 65 (negatively charged region) lay on the surface, swamped with positive charge distribution. This is in concord with Oberste and Gonda [2], who suggested Vif is a very basic protein (predicted pI = 10.7). The positive channel has a hook like structure (hydroxyl group of Ser 146) which is partially obstructing this cavity (Figures 20a & b). An Aspartate at position 106 is located near the Ser 146, which is the only acidic amino acid near by the neutral serine at 146, which is a major phosphorylation site in Vif is depicted in the Figures 21a & b. Since the presence of the Serine is in front of the cleft suggests, apart from phosphorylation, it may have some other essential functional role assisted by the Aspartic acid at 106.
Figure 19.
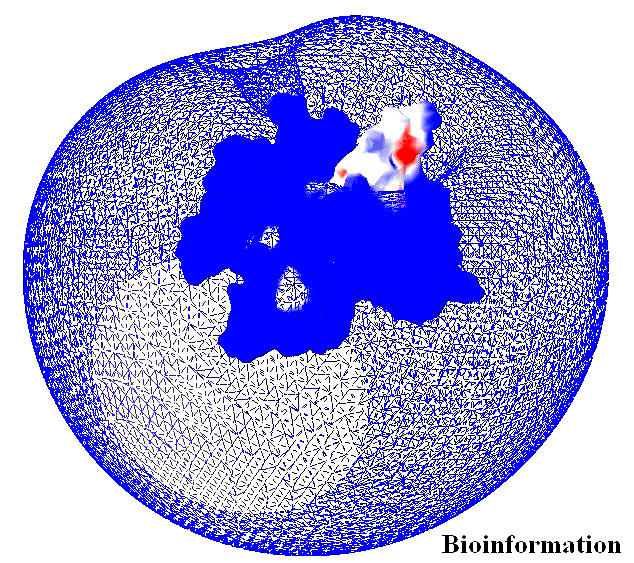
The electrostatic potential of the Vif structure shows the basic charge distribution on the surface of the model. Electrostatic potentials are computed using simple coulomb interaction by DeepView
Figure 20.
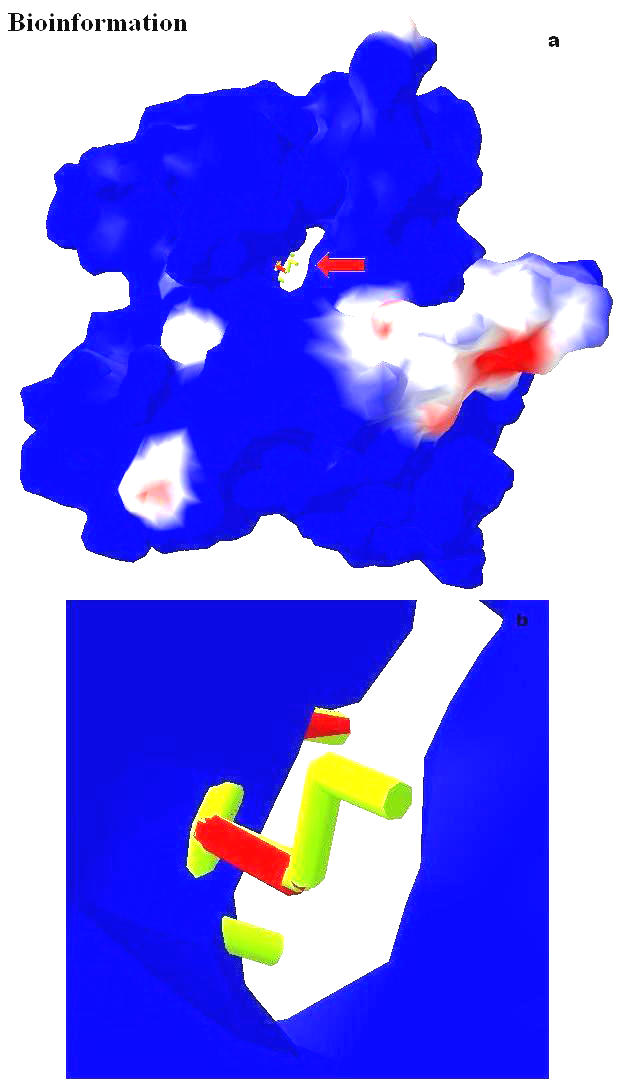
(a) Computed molecular surface of the modeled Vif, colored by electrostatic potential; (b) The hydroxyl hook of Ser 146 partially obstructing the cleft is marked by an arrow in (a) is magnified here
Figure 21.
(a) Computed solvent accessible surface of the modeled Vif, showing transparent secondary structural elements; (b) Magnified figure shows the hydroxyl hook (in front of cleft) of neutral amino acid (Ser 146) and an acidic amino acid Asp 106, which is nearer to this
Conclusion
The model presented here shows for the first time details of the unique structural features of Vif. This model provides specific details about mutation sites, etc. At the same time, such a model should be used with caution, because of the lack of x-ray diffraction data. Moreover in our predicted protein, positions of atoms are far from precise, and geometries are often non-ideal, so an x-ray structure of the Vif with high resolution may reveal new, unexpected features of Vif. The computational model presented in this work provides a paradigm approach to obtain information on inter-helix interactions that could prove valuable in obtaining an improved crystal structure of Vif and will also be useful in phase determination of x-ray diffraction data.
The characterization of the Vif binding site could shed light and insight into an interesting perspective to predict mechanism of interaction with A3G. Unfortunately, this protein structure is also unavailable. Our predicted model Vif [PDB code 1VZF] will be compared with the actual crystal data when available. Protein structure and inhibitors of this important virus regulatory protein are not currently available. Therefore, this model would be helpful for initial structure related studies, which provide guidance for rational drug discovery.
Acknowledgments
PS acknowledges support from NIH Grants DA 14533, DA 12580, GM 056529, and reports no conflicting financial interests.
Footnotes
Citation:Balaji et al., Bioinformation 1(8): 290-309 (2006)
References
- 1.Baraz L, Kotler M. Curr Med Chem. 2004;11:221. doi: 10.2174/0929867043456124. [DOI] [PubMed] [Google Scholar]
- 2.Oberste MS, Gonda MA. Virus Genes. 1992;6:95. doi: 10.1007/BF01703760. [DOI] [PubMed] [Google Scholar]
- 3.Wiegand HL, et al. EMBO J. 2004;23:2451. doi: 10.1038/sj.emboj.7600246. [DOI] [PMC free article] [PubMed] [Google Scholar]
- 4.Dang Y, et al. J Virol. 2006;80:10522. doi: 10.1128/JVI.01123-06. [DOI] [PMC free article] [PubMed] [Google Scholar]
- 5.Conticello SG, et al. Curr Biol. 2003;13:2009. doi: 10.1016/j.cub.2003.10.034. [DOI] [PubMed] [Google Scholar]
- 6.Schrofelbauer B, et al. AIDS Rev. 2004;6:34. [PubMed] [Google Scholar]
- 7.Zhang J, Webb DM. Hum Mol Genet. 2004;13:1785. doi: 10.1093/hmg/ddh183. [DOI] [PubMed] [Google Scholar]
- 8.Mehle A, et al. J Biol Chem. 2004;279:7792. doi: 10.1074/jbc.M313093200. [DOI] [PubMed] [Google Scholar]
- 9.Svarovskaia ES, et al. J Biol Chem. 2004;279:35822. doi: 10.1074/jbc.M405761200. [DOI] [PubMed] [Google Scholar]
- 10.Soros VB, Greene WC. Curr Infect Dis Rep. 2006;8:317. doi: 10.1007/s11908-006-0077-6. [DOI] [PubMed] [Google Scholar]
- 11.Dutko JA, et al. Curr Biol. 2005;15:661. doi: 10.1016/j.cub.2005.02.051. [DOI] [PMC free article] [PubMed] [Google Scholar]
- 12.Sheehy AM, et al. Nat Med. 2003;9:1404. doi: 10.1038/nm945. [DOI] [PubMed] [Google Scholar]
- 13.Stopak K, Greene WC. Curr Opin Investig Drugs. 2005;6:141. [PubMed] [Google Scholar]
- 14.Kobayashi M, et al. J Biol Chem. 2005;280:18573. doi: 10.1074/jbc.C500082200. [DOI] [PubMed] [Google Scholar]
- 15.Altschul SF, et al. J Mol Biol. 1990;215:403. doi: 10.1016/S0022-2836(05)80360-2. [DOI] [PubMed] [Google Scholar]
- 16.Rost B, et al. Nucleic Acids Research. 2004;32:W321. doi: 10.1093/nar/gkh377. [DOI] [PMC free article] [PubMed] [Google Scholar]
- 17.Rost B, Sander C. J Mol Biol. 1993;232:584. doi: 10.1006/jmbi.1993.1413. [DOI] [PubMed] [Google Scholar]
- 18.Rost B, Sander C. Proteins. 1994;19:55. doi: 10.1002/prot.340190108. [DOI] [PubMed] [Google Scholar]
- 19.Rost B. Methods Enzymol. 1996;266:525. doi: 10.1016/s0076-6879(96)66033-9. [DOI] [PubMed] [Google Scholar]
- 20.Rost B, et al. Protein Sci. 1996;5:1704. doi: 10.1002/pro.5560050824. [DOI] [PMC free article] [PubMed] [Google Scholar]
- 21.Rost B. Proc Int Conf Intell Syst Mol Biol. 1995;3:314. [PubMed] [Google Scholar]
- 22.Rost B, et al. J Mol Biol. 1997;270:471. doi: 10.1006/jmbi.1997.1101. [DOI] [PubMed] [Google Scholar]
- 23.Sander C, Schneider R. Proteins. 1991;9:56. doi: 10.1002/prot.340090107. [DOI] [PubMed] [Google Scholar]
- 24.Guex N, Peitsch MC. Electrophoresi. 1997;18:2714. doi: 10.1002/elps.1150181505. [DOI] [PubMed] [Google Scholar]
- 25.Kneller DG, et al. J Mol Biol. 1990;214:171. doi: 10.1016/0022-2836(90)90154-E. [DOI] [PubMed] [Google Scholar]
- 26.Shenkin PS, et al. Biopolymers. 1987;26:2053. doi: 10.1002/bip.360261207. [DOI] [PubMed] [Google Scholar]
- 27. http://www.igc.ethz.ch/gromos/ [Google Scholar]
- 28.Sippl JM. J Mol Biol. 1990;213:859. doi: 10.1016/s0022-2836(05)80269-4. [DOI] [PubMed] [Google Scholar]
- 29.Eisenberg D, et al. Methods Enzymol. 1997;277:396. doi: 10.1016/s0076-6879(97)77022-8. [DOI] [PubMed] [Google Scholar]
- 30.Vriend G. J Mol Graph. 1990;8:52. doi: 10.1016/0263-7855(90)80070-v. [DOI] [PubMed] [Google Scholar]
- 31.Laskowski RA, et al. J Biomol NMR. 1996;8:477. doi: 10.1007/BF00228148. [DOI] [PubMed] [Google Scholar]
- 32.Hooft RW, et al. Nature. 1996;381:272. doi: 10.1038/381272a0. [DOI] [PubMed] [Google Scholar]
- 33.Anne E, et al. Bioinformatics. 2006;22:2735. doi: 10.1093/bioinformatics/btl274. [DOI] [PubMed] [Google Scholar]
- 34.Richards FM. J Mol Biol. 1974;82:1. doi: 10.1016/0022-2836(74)90570-1. [DOI] [PubMed] [Google Scholar]
- 35.Richards FM, et al. Methods Enzymol. 1985;115:440. doi: 10.1016/0076-6879(85)15032-9. [DOI] [PubMed] [Google Scholar]
- 36.Harpaz Y, et al. Structure. 1994;2:641. doi: 10.1016/s0969-2126(00)00065-4. [DOI] [PubMed] [Google Scholar]
- 37.Gerstein M, et al. J Mol Biol. 249:955. doi: 10.1006/jmbi.1995.0351. [DOI] [PubMed] [Google Scholar]
- 38.Tsai J, et al. J Mol Biol. 1999;290:253. doi: 10.1006/jmbi.1999.2829. [DOI] [PubMed] [Google Scholar]
- 39.Rost B, et al. J Mol Biol. 1997;270:471. doi: 10.1006/jmbi.1997.1101. [DOI] [PubMed] [Google Scholar]
- 40.Geourjon C, Deleage G. Comput Appl Biosci. 1995;11:681. doi: 10.1093/bioinformatics/11.6.681. [DOI] [PubMed] [Google Scholar]
- 41.Morris AL, et al. Proteins. 1992;12:345. doi: 10.1002/prot.340120407. [DOI] [PubMed] [Google Scholar]
- 42.Kabsch W, Sander C. FEBS Lett. 1983;155:179. doi: 10.1016/0014-5793(82)80597-8. [DOI] [PubMed] [Google Scholar]
- 43.Engh RA, Huber R. Acta Cryst. 1991;A47:392. [Google Scholar]
- 44.Luthy R, et al. Nature. 1992;356:83. doi: 10.1038/356083a0. [DOI] [PubMed] [Google Scholar]
- 45.Berman HM, et al. Nucleic Acids Research. 2000;28:235. doi: 10.1093/nar/28.1.235. [DOI] [PMC free article] [PubMed] [Google Scholar]
- 46.Doolittle RF. Of URFs and ORFs: a primer on how to analyze derived amino acid sequences. CA, USA: University Science Books, Mill Valley; 1986. [Google Scholar]
- 47.Yang X, et al. J Biol Chem. 1996;271:10121. doi: 10.1074/jbc.271.17.10121. [DOI] [PubMed] [Google Scholar]
- 48.Oberste MS, Gonda MA. Virus Genes. 1992;6:95. doi: 10.1007/BF01703760. [DOI] [PubMed] [Google Scholar]
- 49. http://bioinfo.hku.hk/db/aids/AIDS_99.10/aidsdb/ [Google Scholar]
- 50.Goncalves J, et al. J Virol. 1995;69:7196. doi: 10.1128/jvi.69.11.7196-7204.1995. [DOI] [PMC free article] [PubMed] [Google Scholar]
- 51.Kyte J, Doolittle R. J Mol Biol. 1982;157:105. doi: 10.1016/0022-2836(82)90515-0. [DOI] [PubMed] [Google Scholar]
- 52.Bouyac M, et al. J Virol. 1997;71:9358. doi: 10.1128/jvi.71.12.9358-9365.1997. [DOI] [PMC free article] [PubMed] [Google Scholar]


