

Abstract
Fas-associated phosphatase-1 (FAP-1) is a protein-tyrosine phosphatase that binds the cytosolic tail of Fas (Apo1, CD95), presumably regulating Fas-induced apoptosis. Elevations of FAP-1 protein levels in some tumor cell lines have been correlated with resistance to Fas-induced apoptosis. To explore the expression of FAP-1 in ovarian cancer cell lines and archival tumor specimens, mouse monoclonal and rabbit polyclonal antibodies were generated against a FAP-1 peptide and recombinant FAP-1 protein. These antibodies were used for immunoblotting, immunohistochemistry, and flow-cytometry analysis of FAP-1 expression in the Fas-sensitive ovarian cancer lines HEY and BG-1, and in the Fas-resistant lines OVCAR-3 FR and SK-OV-3. All methods demonstrated high levels of FAP-1 in the resistant lines OVCAR-3 FR and SK-OV-3, but not in the Fas-sensitive lines HEY and BG-1. Furthermore, levels of FAP-1 protein also correlated with the amounts of FAP-1 mRNA, as determined by reverse transcriptase-polymerase chain reaction analysis. FAP-1 protein levels were investigated by immunoblotting in the National Cancer Institute’s panel of 60 human tumor cell lines. Although FAP-1 failed to correlate with Fas-resistance across the entire tumor panel, Fas-resistance correlated significantly with FAP-1 expression (P ≤ 0.05) and a low Fas/FAP-1 ratio (P ≤ 0.028) in ovarian cancer cell lines. FAP-1 expression was also evaluated in 95 archival ovarian cancer specimens using tissue-microarray technology. FAP-1 was expressed in nearly all tumors, regardless of histological type or grade, stage, patient age, response to chemotherapy, or patient survival. We conclude that FAP-1 correlates significantly with Fas resistance in ovarian cancer cell lines and is commonly expressed in ovarian cancers.
Ovarian cancer often carries a poor prognosis, because the majority of patients are diagnosed with advanced-stage disease (FIGO III/IV). Although the introduction of taxane-containing chemotherapy regimens greatly increased the rate of chemotherapy responders (as high as 73%), less than one-third of all patients survive 5 years after diagnosis. Consequently, ovarian cancer ranks as the fourth-leading cause of cancer-related death in the United States among women.
The major problem with ovarian cancer lies in the ability of most tumors to relapse and to develop resistance against commonly used cytostatic regimens (eg, platin-derivates, taxanes, etoposide). The success of several chemotherapeutic drugs seems to lie with their capability to induce apoptosis by several signaling pathways, including activation of apoptosis-signaling pathways induced by tumor necrosis factor (TNF) family death receptors.
Fas is a type-II membrane protein belonging to the TNF/nerve growth factor receptor (NGFR) family. 1 Ligation of the Fas receptor with its natural ligand, FasL, induces aggregation of the receptor followed by activation of caspases, which are proteases responsible for degrading cellular components. In certain types of cancers, cisplatin and etoposide treatment can induce increases in Fas receptor levels, allowing self-aggregation and apoptosis initiation in the absence of FasL. 2 It has been questioned whether resistance to cytostatic drugs correlates with defects in apoptosis induction via Fas and related TNF-family death receptors.
Fas-associating phosphatase-1 (FAP-1) is a 275-kd tyrosine phosphatase capable of inhibiting Fas signaling. 3 FAP-1 binds to the extreme carboxy-terminal amino acids of Fas. FAP-1 contains six PDZ domains, a membrane binding domain, and a catalytic domain, of which either PDZ3 or PDZ5 are required for Fas association. 3 The potential to inhibit Fas-induced apoptosis and the correlation between FAP-1 expression and Fas-resistance has been shown for several kinds of cancer cell lines including colon, pancreatic, and hematological malignancies. 4-6
This study was performed to examine the correlation between FAP-1 and the resistance against Fas-induced apoptosis and also to determine the FAP-1 expression in ovarian cancer, preliminarily exploring its role in tumor progression and chemoresistance.
Materials and Methods
Plasmid Construction
A fragment of FAP-1 encoding residues 1279 to 1883, designated HFAP10, 3 was amplified from a testis cDNA library using the following primers: FAP-1-5s: ATGCATGGCAGCCCTTCCCATCTGTAATATC and FAP-1-3s: AGTCCGGTAGCAAATGAGGCAACATTGGTA.
The resulting 1,834-bp product was cloned into Topo 2.1 vector (Invitrogen, Carlsbad, CA) and confirmed by DNA sequencing. HindIII and NotI restriction sites were introduced by polymerase chain reaction and using these sites the product was directionally subcloned into pcDNA3.1 (Invitrogen) for expression in mammalian cells. The integrity of the subcloned cDNA was further confirmed by in vitro translation (Promega, Madison, WI) and sodium dodecyl sulfate-polyacrylamide gel electrophoresis (SDS-PAGE) analysis.
Cell Culture, Transfection, and Cellular Subcloning
Ovarian cancer cell lines and the Jurkat T-cell line were cultured in RPMI medium supplemented with 10% fetal bovine serum, 1 mmol/L l-glutamine, 100 U/ml penicillin, and 100 μg/ml streptomycin sulfate. HEK 293 cells were cultured in Dulbecco’s modified Eagle’s medium with the same supplements.
Jurkat cells were transfected with pcDNA3.1-HFAP10 using DMRIE-C transfection reagent (Life Technologies, Inc., Gaithersburg, MD) according to the manufacturer’s instructions. Three days after transfection, cells were selected with 1 mg/ml G418 (Omega Scientific, Inc., Torzana, CA). Subculturing was performed in six-well plates at a cell number of 2 × 10 6 cells/well. After 2 weeks of antibiotic treatment, cells were seeded at one cell/well in two 96-well plates and cultured in 50% conditioned media. Eighteen clones were thus obtained. HFAP10 expression of each stably transfected clone was analyzed by fluorescence-activated cell sorting (FACS) analysis. Jurkat clones transfected with pcDNA3.1 vector alone served as a negative control.
Reverse Transcriptase-Polymerase Chain Reaction Assays
Total RNA (5 μg) from various cell lines was transcribed using an engineered reverse transcriptase (RTase) (Superscript II, Life Technologies, Inc.). Subsequent polymerase chain reactions were performed with internal primers (FAP-RT-5s: 5′-GAATACGAGTGTCAGACATG-3′ and FAP-RT-3s: 5′-AGGTCTGCAGAGAAGCAAGA-3′) amplifying a 607-bp product. Thermal cycling was performed according to the following conditions: denaturation at 95°C for 30 seconds, annealing for 1 minute at 62°C, and elongation at 72°C for 1 minute, for 36 cycles. A final extension was performed at 72°C for 10 minutes.
Apoptosis Assays
Cells were attached to 96-well plates (2,000 or 10,000 cells) and treated with CH-11 Fas agonistic antibody (MBL, Inc., Nagoya, Japan) at various concentrations for 2 days. Relative viable cell numbers were measured by XTT assay 7 using 0.025 mmol/L phenazine methosulfate (Sigma Chemical Co., St. Louis, MO) and 1 mg/ml XTT (Polysciences, Inc., Warrington, PA) dissolved in serum-free media. Absorbance was measured at 450 nm after incubation for 1 hour at 37°C in 5% CO2:95% air.
The sensitivity of the National Cancer Institute’s panel of 60 human tumor cell lines to anti-Fas mAb CH-11 was determined by a 48-hour sulforhodamine B assay as previously described. 8-11 The concentration of antibody needed to obtain 50% growth inhibition under these assay conditions revealed GI50 values for each cell line.
Production of Recombinant FAP-1 Protein and Monoclonal Antibodies
A glutathione S-transferase (GST)-human HFAP10 (GST-hu-HFAP10) fusion protein (residues 1279 to 1883) was produced in bacteria and purified by affinity-chromatography using glutathione-Sepharose. 3 Transgenic mice that overexpress Bcl-2 in their B cells (line B6) 12 were immunized with GST-HFAP10 protein, and splenocytes were fused with SP/2 cells to generate hybridomas as described previously. 13 Positive hybridomas were identified by a primary enzyme-linked immunosorbent assay using GST-HFAP10 protein, followed by a secondary enzyme-linked immunosorbent assay screening using GST protein to eliminate clones producing anti-GST antibodies. Cells from positive wells were subcloned twice, and the resulting hybridomas were used for monoclonal antibody production as ascites in pristane-primed BALB/c mice. 13 3G10, 2C8, and 2D12 hybridomas were determined to secrete IgG1 murine immunoglobulins.
Production of Polyclonal Antibody
High-titer antisera specific for FAP-1 were generated in rabbits using a multiple boosting technique and recombinant human FAP-1 fusion protein (GST-HFAP10) corresponding to amino acids 1279 to 1883 as immunogens, essentially as described (no. 1730). 14 Antibody specificity was confirmed by immunoblot analysis of in vitro translated HFAP10 as well as recombinant GST-HFAP10 versus GST alone. A second polyclonal antibody (no. 1729) was raised against a synthetic peptide corresponding to a unique carboxyl-terminal sequence of the human FAP-1 gene (N-CEPTRQENWTPLKNDLE-NH2; amino acids 438 to 453). The peptide was covalently conjugated with maleimide activated KLH carrier protein (Pierce, Inc., Rockford, IL) in a carrier to peptide ratio of 1:1 or 1:10 (w:w). The immunogens were prepared in bulk for the entire immunization period. The effectiveness of conjugation was tested in a SDS gel using Coomassie blue protein stain to distinguish peptide-conjugated from unconjugated carrier proteins.
FACS Analysis
Ovarian cancer cells were detached with ethylenediaminetetraacetic acid-based dissociation solution (Cell and Molecular Technologies, Inc., Phillipsburg, NJ) and washed with phosphate-buffered saline (PBS). After fixation in 1% formaldehyde in PBS (Polyscience, Inc.), permeabilization with 0.05% Triton X-100 (Bio-Rad, Richmond, CA), and pre-incubation with 0.1 μg/μl γ-globulin, cells were incubated with 3G10 mouse monoclonal antibody (dilution 1:500 v:v ascites) for 1 hour on ice. Binding of secondary fluorescein isothiocyanate-labeled goat anti-mouse-IgG antibody (500 μg/ml; DAKO Inc., Carpinteria, CA) was performed 1 hour on ice. For each cell line, an incubation with mouse IgG1 (DAKO) as primary antibody was performed as a negative control. Jurkat T cells served as a negative control for FAP-1 expression. 3 Cells were analyzed by flow cytometry using a Becton-Dickinson FACScan Plus instrument (Becton-Dickinson, Mountain View, CA).
For determination of Fas expression, 0.5 × 10 6 cells were incubated with 20 μl of fluorescein isothiocyanate-labeled anti-Fas mAb (Kamiya Biomedical, Seattle, WA) for 30 minutes at room temperature and subsequently analyzed by FACS. For each cell line, an incubation with 20 μl of fluorescein isothiocyanate-labeled mouse IgG (Becton Dickinson) was performed as a negative control. The Fas expression level of each cell line was calculated using the integrated number of events under the histogram peaks for the respective antibodies: specific fluorescence index = fluorescence intensity obtained by anti-Fas incubation/fluorescence intensity obtained by IgG incubation.
Immunocytochemical Assay
Cells were cultured on chamber slides (Nunc Laboratories, Rochester, NY) and fixed with Bouin’s solution for 10 minutes at room temperature. Cells were permeabilized with 0.1% Triton X-100. Incubation with primary antibody (Santa Cruz sc-1138, 4 μg/ml; Santa Cruz Technology, Santa Cruz, CA) was performed at 4°C overnight. Secondary biotinylated horse anti-goat antibody (BA-9500, 7.5 μg/ml; Vector Laboratories, Burlingame, CA) was detected using an avidin-biotin complex method (Vectastain ABC Kit, Vector Laboratories) and diaminobenzidine. Peptide neutralization experiments were performed as a control for antibody specificity.
Immunoblot Assays
Cell and tissue lysates were prepared using RIPA buffer (10 mmol/L Tris, pH 7.43, 150 mmol/L NaCl, 1% Na-deoxycholate, 0.1% SDS, 1% Triton X-100, 1 mmol/L ethylenediaminetetraacetic acid) containing Complete protease inhibitors (Boehringer Mannheim, Indianapolis, IN), normalized for total protein content (100 μg) and resolved by SDS-PAGE (7% gels). Protein quantification was performed using the Pierce BCA Kit (Pierce). Proteins were transferred (overnight 150 mA, 4°C) to nitrocellulose membranes (Bio-Rad). After blocking with 5% skim milk, 2% bovine serum albumin in TBST (10 mmol/L Tris, pH 7.6, 120 mmol/L NaCl, 0.1% Tween 20) at room temperature for 2 hours, blots were incubated overnight with either rabbit polyclonal primary antibody no. 1730 (1:3,000) or goat polyclonal primary antibody (sc-1138, dilution 1:100; Santa Cruz ) at 4°C. After incubation with horseradish peroxidase-conjugated secondary goat anti-rabbit (Bio-Rad) or donkey anti-goat (Santa Cruz) antibodies at room temperature for 1 hour, immunodetection was accomplished by an enhanced chemiluminescence methods (Amersham, Arlington Heights, IL), followed by exposure to X-ray film (Kodak/XAR; Kodak, Rochester, NY). To quantify immunoblotting results, films were analyzed densitometrically using a Multi Image Light Cabinet and the ChemiImager software version 4000 (Alpha Innotech Corporation, San Leandro, CA).
Tissue Array Construction
A microarray recipient block was constructed containing paraffin-embedded ovarian cancer tissue samples from 95 archival patient specimens, previously fixed in 8% formaldehyde, according to established methods. 15 From every archival paraffin block, three cylinders of 1-mm diameter tissue were taken from representative areas and transferred to a paraffin recipient block with 1.5-mm distance between the samples, using a Tissue Arrayer (Beecher Instruments, Gene Micro-Array Technologies, Silver Spring, MD). Fallopian tube tissue was transferred as a positive control for FAP-1. To achieve an even surface of the paraffin block, cylinders were leveled with a glass slide after incubation at 42°C for 30 minutes. Serial sections (4 μm) were attached to 3-aminopropyltriethoxysilane (Sigma)-coated slides, as described. 16
Immunohistochemical Assays
Immunostaining of tissues and cultured cell lines was performed as described previously. 17,18 Cells were detached from dishes with ethylenediaminetetraacetic acid-based dissociation solution (Cell and Molecular Technologies, Inc.), washed with PBS, fixed with Bouin’s solution at room temperature for 10 minutes, and dissolved in 1% agarose in PBS (Life Technologies, Inc.) to facilitate the next steps of tissue processing. The hardened agarose cell suspensions were then embedded in paraffin. Dehydration and paraffin-embedding were performed according to the routine procedures. Anti-FAP-1 rabbit polyclonal antibody no. 1730 was applied at 1:2,000 (v:v) and incubated at room temperature. Colorimetric detection used the Rabbit Envision-Plus-horseradish peroxidase system (DAKO, Inc.) with a Universal staining system automated immunostainer (DAKO, Inc.). Nuclei were counterstained with hematoxylin. Various paraffin-embedded cell lines served as positive and negative controls of immunostaining. Omission of the primary antibody as well as incubation with preimmune serum were additional negative controls. Two authors evaluated the immunostaining independently (IM and MK) and scored each tumor based on the percentage of immunopositive cells (0 to 100) multiplied by staining intensity score (0/1/2/3), yielding scores of 0 to 300.
Tumor Samples and Clinical Data
Ninety-five patients with ovarian cancer presenting to the Department of Gynecology and Obstetrics of the University of Freiburg, Freiburg, Germany between 1993 and 1998 were included in this study. The material was fixed in 8% formalin and paraffin-embedded according to routine procedures. Clinical data including survival and chemoresponse data were available until July 2000, representing a median follow-up of 35 months.
Statistical Analysis
Data were analyzed using the JMP Statistics software package (SAS Institute, Cary, NC). Comparisons of FAP-1 immunostaining data with patient survival were made using the Kaplan-Meier method. An unpaired t-test method was used for correlation of FAP-1 immunoscores with patient’s data, including histology [serous (S) versus nonserous (NS)], tumor grade [low (LMP/low malignant potential + G1) versus high (G2 + G3)], clinical stage [low (I + II) versus high (III + IV)], age (≤60 years versus >60 years). The statistical significance of differences in clinical responses to chemotherapy were assessed using the unpaired t-test and chi-square test, in which a positive response represented patients who achieved either partial response (PR) or complete response (CR).
FAP-1 immunoblot data and Fas/FAP-1 ratio (Fas expression values/FAP-1 expression values) of cell lines were correlated with results of Fas-induced apoptosis using the unpaired t-test. Significance was confirmed by determination of the correlation coefficient using the individual GI50 values of each cell line as parameters.
Results
FAP-1 Expression in Ovarian Cancer Cell Lines
Four ovarian cancer cell lines, HEY, BG-1, SK-OV-3, and OVCAR-3 FR were examined for FAP-1 expression at the mRNA and protein level. For purposes of detecting FAP-1 protein using immunoblotting, immunocytochemistry, immunohistochemistry, and FACS analyses, a rabbit polyclonal antibody (no. 1730) and a mouse monoclonal antibody (3G10) were raised against a protein fusing GST to a fragment of FAP-1 containing amino acids 1279 to 1883 (HFAP10). Specificity of the rabbit polyclonal antibody no. 1730 was confirmed by immunoblotting against recombinant GST-HFAP10 in that a band corresponding to ∼80 kd was detected (Figure 1A) ▶ . This antibody recognized HFAP10 produced by in vitro translation as well (data not shown). The mouse monoclonal 3G10 also recognized the GST-HFAP10 protein in a concentration-dependent manner as well as the in vitro translated version of the protein (Figure 1B) ▶ . In addition, FACS analysis of Jurkat cells that had been stably transfected with a pcDNA3.1 construct encoding HFAP10 showed a significant right shift whereas cells transfected with pcDNA3.1 alone did not (Figure 1C) ▶ .
Figure 1.

Specificity of antibodies raised against GST-HFAP10. A: The rabbit polyclonal antibody no. 1730 detects the recombinant GST-HFAP10 protein as well as in vitro-translated HFAP10 in SDS-PAGE (12% gel). Left lane, 20 ng GST; right lane, 20 ng GST-HFAP10. B: The mouse monoclonal antibody (clone 3G10) binds to HFAP10 on immunoblot. Lanes (from left to right): 20 ng GST, 10 ng GST-HFAP10, 20 ng GST-HFAP10, 250 ng in vitro-translated HFAP10. C: FACS analysis of Jurkat cells stably transfected with HFAP10 (open, clone F4) or with pcDNA3.1 alone (gray).
The antibodies were used to determine whether FAP-1 is present in the ovarian cancer cell lines HEY, BG-1, SK-OV-3, and OVCAR-3 FR. In immunoblot assays, the rabbit polyclonal antibody recognized a protein of the expected size of full-length FAP-1 protein (275 kd) in lysates derived from SK-OV-3 and OVCAR-3 FR but not those from HEY and BG-1 (Figure 2) ▶ . Similar results were obtained with a commercial goat polyclonal antibody sc-1138 against the carboxy terminus of FAP-1 (Santa Cruz) and the rabbit polyclonal no. 1729 (data not shown).
Figure 2.

Comparison of FAP-1 protein levels in ovarian cancer cell lines. Lysates from cell lines (100 μg total protein) were subjected to SDS-PAGE/immunoblot assay using rabbit polyclonal no. 1730. Jurkat and HEK 293 cells served as negative and positive controls, respectively. A nonspecific band is also observed (asterisk), serving as a loading control. Densitometrical analysis was performed using a Multi Image light cabinet and the ChemiImager software version 4000 yielding values based on integrated density (#). Data were arbitrarily normalized relative to FAP-1 levels of HEK 293 cells that were included on all blots as an internal control.
The FAP-1 expression levels in the four ovarian cell lines were also analyzed immunocytochemically. After culture on chamber slides and fixation, cells were immunostained with the goat polyclonal antibody sc-1138 (Santa Cruz) and detected with diaminobenzidine with hematoxylin counterstaining of nuclei. Again, positive immunostaining was detected for SK-OV-3 and OVCAR-3 FR, whereas HEY and BG-1 were slightly positive and negative, respectively (Figure 3A ▶ , top). Antibody binding could be competitively inhibited by incubation with excess FAP-1 peptide (Santa Cruz sc-1138p) (Figure 3A ▶ , bottom). Cells were also fixed and suspended in agarose and embedded in paraffin for sectioning and immunostaining with rabbit polyclonal antibody no. 1730. A strong signal is observed in SK-OV-3 and OVCAR-3 FR whereas HEY and BG-1 are negative for FAP-1 (Figure 3B ▶ , top). Incubation with preimmune serum yielded no signal. The Jurkat T cell line served as a negative control (Figure 3B ▶ , bottom). The protein levels detected in the ovarian cell lines corresponded with relative FAP-1 mRNA levels as assayed by reverse transcriptase-polymerase chain reaction (data not shown).
Figure 3.
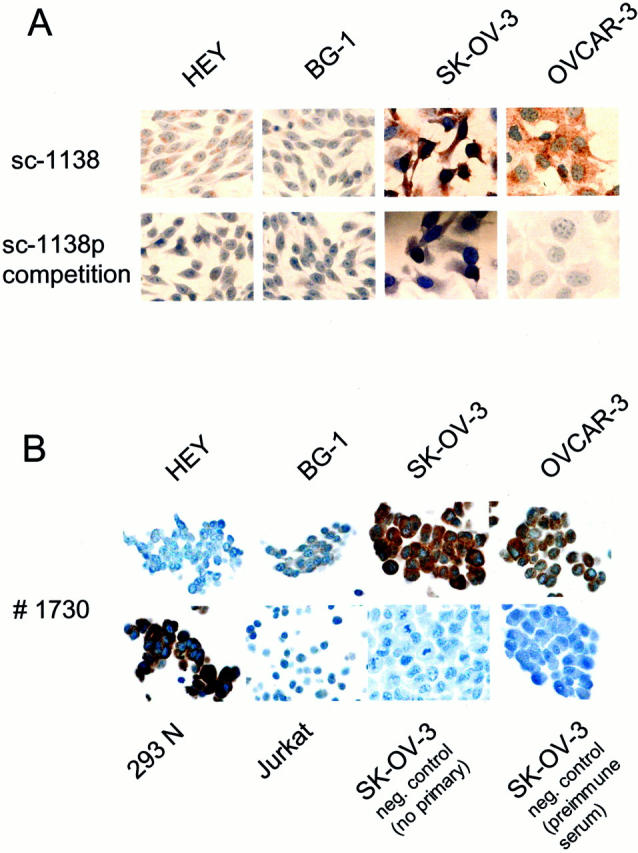
Immunocytochemical analysis of FAP-1 in ovarian cancer cell lines. A: Cells were cultured in chamber slides, fixed in Bouin’s solution, and washed with PBS. Immunostaining was performed using a goat polyclonal antibody (Santa Cruz sc-1138) and a biotinylated horse anti-goat secondary antibody (Vector Laboratories). Antibody detection was by the diaminobenzidine method (brown) with hematoxylin counterstaining of nuclei (blue). Competition study using excess FAP-1 peptide (Santa Cruz sc-1138p) served as a negative control (bottom). B: Cell lines were fixed, suspended in agarose, and then embedded in paraffin for sectioning and immunostaining using polyclonal antiserum no. 1730. Immunodetection was performed involving the Rabbit Envision-Plus-horseradish peroxidase system with a Universal System automated immunostainer (DAKO). Omitting primary antibody or applying preimmune serum served as controls (bottom).
FAP-1 Expression Correlates with Fas-Resistance in Ovarian Cancer Cell Lines
To test whether the presence of FAP-1 correlates with an increased Fas resistance, the cell lines were assayed with FACS for FAP-1 expression using the mouse monoclonal antibody 3G10. In agreement with the immunoblotting and immunostaining results, only SK-OV-3 and OVCAR-3 FR showed a significant right-shift of fluorescence intensity, indicating high levels of FAP-1 expression (Figure 4A) ▶ .
Figure 4.
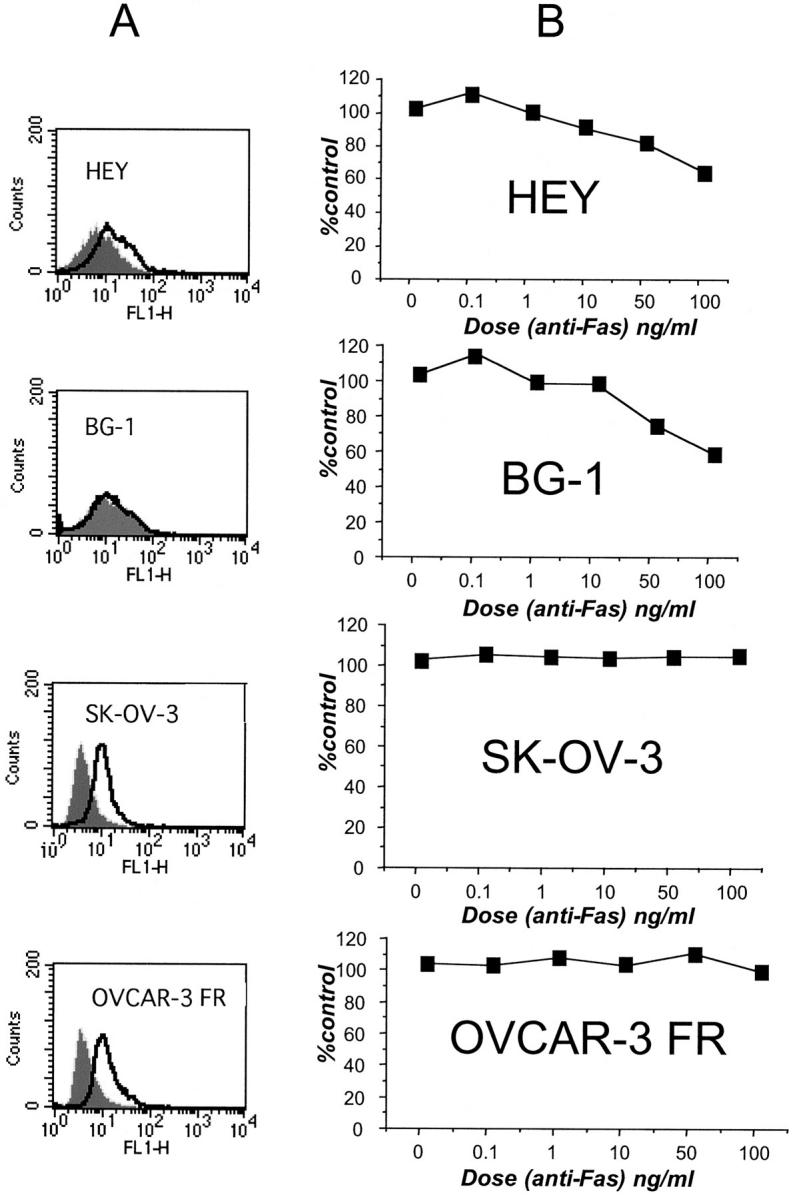
Fas-resistance correlates with FAP-1 expression. A: FACS analysis of ovarian cell lines using mAb 3G10. Immunofluorescence intensity results are compared between cells stained with control (gray) or anti-FAP-1 antibody (open). B: XTT assays were performed after culturing cells for 2 days in the presence of various concentrations of CH11 anti-Fas mAb. Data are expressed as a percentage of viable cells relative to control cells cultured in the absence of antibody.
The ovarian cell lines were then tested for Fas resistance by incubating cells with increasing amounts of Fas agonistic antibody CH-11, which induces aggregation of the Fas receptor and induction of the Fas apoptotic pathway. Cell viability was assayed with XTT after 2 days of exposure to CH-11. Cells having high FAP-1 expression were more resistant to Fas-induced apoptosis than those lacking FAP-1 (Figure 4B) ▶ . The presence of the Fas receptor protein was detected in the four cell lines by immunoblotting (Table 1) ▶ and on the cell surface by FACS analysis (data not shown).
Table 1.
Fas and FAP-1 Expression in Relation to Fas Response in Ovarian Cell Lines
| Cell line | Fas expression | FAP-1 expression | Fas/FAP-1 ratio | Fas response* |
|---|---|---|---|---|
| HEY | 3.51 | 0.14 | 25 | R |
| BG-1 | 3.51 | 0.14 | 25 | R |
| NIH:OVCAR-3 | 1.21 | 0.15 | 8 | R |
| IGROV-1 | 8 | 0.3 | 27 | R |
| OVCAR-4 | 1.21 | 0.24 | 5 | R |
| OVCAR-3 FR | 1.17 | 0.98 | 3 | NR |
| OVCAR-5 | 1.05 | 0.27 | 4 | NR |
| OVCAR-8 | 1.47 | 0.35 | 4 | NR |
| SK-OV-3 | 1.17 | 1.38 | 1 | NR |
Fas and FAP-1 expression data represent densitometrical analyses from at least three independent experiments. Fas resistance correlated significantly with FAP-1 expression (P ≤ 0.05) and with Fas/FAP-1 ratio (P ≤ 0.028).
*Cell lines were dichotomized into responders (R) and nonresponders (NR) according to whether their 50% growth inhibitory (GI50) value was above or below the median of values observed for the National Cancer Institute screening panel of 60 human tumor cell lines.
To confirm this correlation, five additional ovarian cancer cell lines belonging to the National Cancer Institute’s screening panel of 60 human tumor cell lines were analyzed for FAP-1 protein levels by immunoblotting using rabbit polyclonal antibody no. 1730. FAP-1 expression of the nine ovarian cell lines was then quantitated densitometrically (Figure 2) ▶ and correlated with Fas-response revealing a statistically significant correlation between FAP-1 expression and resistance to Fas-induced apoptosis (P ≤ 0.05) (Table 2) ▶ . In addition, ovarian cell lines resistant to Fas-induced apoptosis showed a significantly lower Fas/FAP-1 ratio than Fas-sensitive cell lines (P ≤ 0.028) (Table 1) ▶ .
Table 2.
Correlation of FAP-1 Immunostaining Data with Clinical and Pathological Variables
| Characteristic | n | Range | Median | Mean | P value |
|---|---|---|---|---|---|
| Histology | |||||
| Papillary serous | 50 | 0–300 | 180 | 181 ± 9 | |
| Mucinous | 9 | 63–230 | 163 | 156 ± 21 | 0.4† |
| Endometrioid | 10 | 43–210 | 175 | 150 ± 20 | |
| Other | 13 | 86–300 | 180 | 189 ± 18 | |
| Grade | |||||
| Low | 15 | 60–300 | 180 | 174 ± 17 | 1.0 |
| High | 63 | 0–300 | 180 | 175 ± 8 | |
| Stage* | |||||
| I+II | 19 | 43–300 | 180 | 187 ± 15 | 0.5 |
| III+IV | 63 | 0–300 | 180 | 175 ± 8 | |
| Age | |||||
| ≤60 years | 42 | 0–300 | 180 | 172 ± 10 | 0.4 |
| >60 years | 40 | 70–300 | 180 | 183 ± 10 | |
| Treatment status | |||||
| Untreated | 82 | 0–300 | 180 | 177 ± 8 | 0.3 |
| Treated | 13 | 0–300 | 140 | 158 ± 19 | |
| Response‡ | |||||
| R | 44 | 0–300 | 180 | 191 ± 10 | 0.08 |
| NR | 13 | 60–230 | 180 | 153 ± 19 | |
| Survival (2 yrs)§ | |||||
| Alive | 50 | 0–300 | 180 | 179 ± 9 | 0.7 |
| Deceased | 31 | 60–300 | 180 | 173 ± 12 |
FAP-1 immunostaining data are presented for the ovarian cancer specimens derived from previously untreated patients, whose tumors were included on the microarray.
†P value for comparison of papillary serous tumors against all nonserous tumors. Additional statistical comparisons among histological subgroups were nonsignificant.
*Comparisons of individual clinical stages were also nonsignificant, including stage IV (distant metastases) against stages I–III, I–II, or I (not shown).
‡Responders (R) included patients who achieved partial remissions, complete remissions, or who had no clinical evidence of residual disease as defined by the criteria of the World Health Organization. Nonresponders (NR) included patients who had no change in their disease or whose disease progressed while on therapy. Patients received combination chemotherapy (eg., a platin derivate, cyclophosphamide, gemcitabine, epirubicin, or ifosfamid) with or without a taxane. FAP-1 immunostaining results were not significantly different for the taxane-positive and -negative groups (not shown).
§No significant correlation of FAP-1 immunostaining data with survival was observed using 3- and 5-year data or by low-rank or Wilcoxon analysis of Kaplan-Meier survival data (not shown).
Comparisons of FAP-1 protein levels or Fas/FAP-1 ratios across 54 cell lines belonging to the National Cancer Institute’s panel, for which Fas-sensitivity data were available, however failed to reveal a statistically significant association with Fas response.
FAP-1 Expression in Ovarian Cancer Biopsies: Correlations with Clinical Data
FAP-1 expression in 95 ovarian cancer samples was examined with immunostaining using a tissue microarray approach. From each sample, three punches were included in the array, which also contained samples of fallopian tube and ovarian surface epithelial tissue. The former produced a strong positive signal after incubation of the array with rabbit polyclonal antibody no. 1730 (Figure 5 ▶ , left). Incubation with rabbit preimmune serum was performed as a negative control (Figure 5 ▶ , right). Paraffin-embedded cell lines served as additional positive and negative controls (Figure 3B) ▶ .
Figure 5.
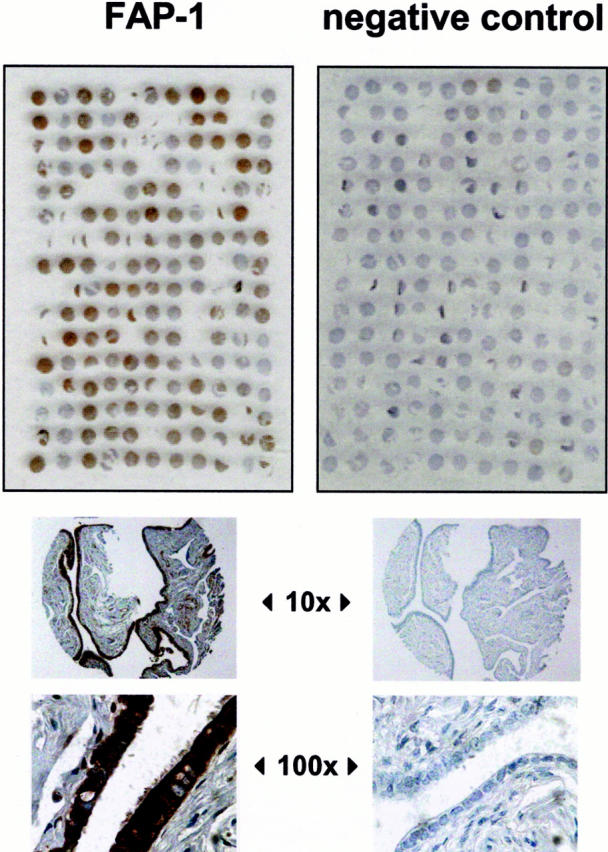
Immunohistochemical analysis of FAP-1 expression in ovarian cancers. Two tissue microarray blocks were prepared using 1-mm diameter cylindrical punches of fixed tissue from 95 ovarian tumor specimens. Normal ovary and fallopian tube tissue was also included on the array blocks. The number of three punches per tumor ensured the evaluation of each case even if some samples were lost during the staining procedure. Left: Shown is an ovarian cancer tissue array stained for FAP-1 using no.1730 antibody, whereas the right panel was stained with preimmune serum, which served as a negative control. Bottom: Shown are ×10 and ×100 original magnifications of fallopian tube tissue, which is known for its FAP-1 positivity. 23
Immunoblot analysis of four representative frozen tumor samples corresponding to paraffin-embedded tumor specimens was performed to validate the immunostaining results. Lysates derived from these tumors, which exhibited different immunostaining intensities, yielded corresponding relative levels of FAP-1 protein in immunoblot assays. The chief difference in FAP-1 immunopercentage is because of the abundance of connective tissue in 99-171 and 99-175, which is FAP-1 negative, unlike the malignant ovarian cancer cells that are FAP-1 immunopositive (Figure 6) ▶ .
Figure 6.

Correlation of FAP-1 immunoblot analysis with immunohistochemistry. Lysates were prepared from frozen tumor tissue corresponding to four matching tumor specimens that were fixed and embedded in paraffin: 99-124, 99-171, 99-175, and 99-188. Lysates were normalized for total protein content (100 μg) and subjected to SDS-PAGE/immunoblot assay using anti-FAP-1 polyclonal antibody no. 1730 (top). Bottom: Shown is immunohistochemical analysis of the same tumors at ×10 and ×100 original magnifications.
Of the 95 ovarian cancers, 97.8% (93 of 95 cases) contained at least 20% immunopositive cells having immunointensities of 2 to 3 on a 0 to 3 scale with immunoscores (IS) ≥ 40 where IS = (immunointensity, 0 to 3) × (% immunoreactive cells). Examination of the immunoscoring data as a continuous variable failed to reveal a significant correlation of FAP-1 immunostaining with patient age (≥60 years versus <60 years), clinical stage (FIGO I/II versus III/IV), response to chemotherapy [responder (CR, PR, NED) versus nonresponder (PD, NC)], duration of response, or survival at 2, 3, or 5 years (Table 2) ▶ .
Discussion
To evaluate FAP-1 expression in ovarian cancer cell lines and tumor samples, a recombinant FAP-1 protein fragment was used to generate monoclonal and polyclonal antibodies specific for this Fas-binding protein. The specificity of these antibodies was demonstrated by immunoblotting, flow-cytometry, and immunocytochemistry. Reverse transcriptase-polymerase chain reaction analysis of ovarian cancer cell lines indicated that FAP-1 protein levels correlated with FAP-1 mRNA. FAP-1 levels in ovarian cancer cell lines were found to correlate with resistance to Fas-induced apoptosis in vitro. Two different cell lines from the same origin (NIH:OVCAR-3 and OVCAR-3 FR) showed striking differences in Fas sensitivity and FAP-1 expression, suggesting that the FAP-1 expression level is critical for Fas-response in this case. In addition, the Fas/FAP-1 ratio was significantly lower in Fas-resistant than in Fas-sensitive cell lines, indicating the importance of both Fas and FAP-1 expression levels in determining the sensitivity of ovarian cell lines to Fas-induced apoptosis.
Previous studies have documented an association between the presence of FAP-1 and resistance to Fas-induced apoptosis. For example, although Jurkat T-cell leukemia cells lack endogenous FAP-1, ectopic expression of FAP-1 after gene transfer confers an increased resistance to Fas-induced cell death. 3 Normal T-cell helper-2 (Th2) is less susceptible to Fas-mediated cell death than Th1 cells. The expression of FAP-1 after activation in Th2 and not Th1 could account for their differing responses to antigen stimulation. 19 Similarly, endogenous FAP-1 expression in colon cancer cell lines has been correlated with Fas resistance. Fas sensitivity of these cell lines could be restored by microinjection of peptides that bind PDZ domains of FAP-1 and prevent its association with Fas. 20 Similar results were observed in thyrocytes. 21 Hepatoma carcinomas also express FAP-1, which could explain how these cells avoid apoptosis induced by the Fas pathway. 22 In pancreatic cancer cell lines, Fas resistance has also been correlated with high levels of FAP-1 mRNA. 5 FAP-1 has been detected in tissues from various carcinomas including skin, gastric, colon, hepatocellular, kidney, and thyroidal. 23 In contrast, although FAP-1 mRNA and protein were present in prostate cancer, it did not correlate with Fas sensitivity. 24,25 In addition, whereas FAP-1 may promote Fas resistance in some cell types, deletion of the C-terminal FAP-1-binding region of Fas did not alter its ability to induce apoptosis in murine lymphoid cell lines, implying that the relative importance of FAP-1 as an inhibitor of Fas-induced apoptosis may be dependent on cell context. 26
In addition to Fas, FAP-1 also binds to the C terminus of the p75-kd neurotrophin receptor (p75NTR) and suppresses nuclear factor-κB induction by this member of the TNF-NGF receptor family. 27 Little is known about the expression of p75NTR in ovarian cancers, thus the significance of FAP-1 interactions with this and other members of the TNF/NGFR family in ovarian tumors remains to be explored. This will be important because increased levels of two soluble TNF receptors, TNFR1 (p55/p60-TNFR, CD120a) and TNFR2 (p75/p80-TNFR, CD120b) have been observed in serum and ascites of ovarian cancer patients, relative to patients having benign masses. 28,29 TNFR2 mRNA and protein has been detected in infiltrating ovarian cancer cells, but is rarely expressed in normal ovarian tissue. 30
We observed that FAP-1 is commonly expressed in ovarian cancers, as determined by immunohistochemical analysis of archival specimens. Several studies have suggested that Fas plays a role in apoptosis induction after exposure of tumor cells to anti-cancer drugs under some, but not all circumstances. 31-36 Because in our study there was a trend toward correlation of FAP-1 expression with responses to chemotherapy, it remains to be determined whether Fas participates in chemoresponses in ovarian cancers.
Given the varying expression levels detected in ovarian cancer cell lines, it was surprising to observe that ∼98% of the archival tumor samples assayed were positive for FAP-1. Despite the differences in the intensity of staining, we did not observe a significant correlation of FAP-1 immunostaining data with response or survival among the patient specimens examined in this study, at least when FAP-1 immunoscore data were evaluated as a continuous variable. It is possible that empirical dichotomization of FAP-1 immunostaining data at a specific cut-off value might reveal a correlation with either response or survival, but such approaches are subject to bias and would require independent confirmation in follow-up studies. Also, because FAP-1 is expressed in nearly all ovarian cancers, it is unlikely that it can serve as a prognostic marker.
Much interest has emerged in provoking immune responses against ovarian cancers, with some strategies designed to provoke an immune response against the antigen CA 125, which is expressed by most malignant ovarian tumors, or vaccination with HER2-neu peptides that serve as targets for specific T-cell responses. 37,38 Cytolytic T cells and natural killer cells use FasL as a weapon to trigger apoptosis of cancer cells they recognize. 39 It would thus be interesting to inquire whether FAP-1 expression levels correlate with the success or failure of immunotherapies for ovarian cancer. In this regard, tripeptide inhibitors that mimic the site on Fas where FAP-1 PDZ domains interact have been exploited to abolish FAP-1 interactions with Fas and to restore sensitivity to Fas-induced apoptosis in colon cancer cell lines. 20,40 These observations suggest that it may be possible to devise small molecule drugs that bind the PDZ domains of FAP-1, preventing its association with Fas and enhancing the efficacy of immune-mediated attack of ovarian cancers. Because FAP-1 is expressed in nearly all ovarian cancers, it may therefore serve as a candidate target for drug discovery.
Acknowledgments
We thank R. Cornell for manuscript preparation, Dr. E. Godi for acquisition of clinical data, Dr. S. Schendel for helpful suggestions on the manuscript, and H. Bettendorf for excellent technical assistance.
Footnotes
Address reprint requests to Dr. John C. Reed, The Burnham Institute, 10901 North Torrey Pines Rd., La Jolla CA 92037. E-mail: jreed@burnham-inst.org.
Supported by National Institutes of Health (grant CA-72994), the Deutsche Krebshilfe/Mildred-Scheel-Stiftung, (grants D/98/02291 to I. M. H. and D/98/02293 to F. S. L.), and the Lady Tata Memorial Foundation (to J. M. Z.).
References
- 1.Itoh N, Yonehara S, Ishii A, Yonehara M, Mizushima S-I, Sameshima M, Hase A, Seto Y, Nagata S: The polypeptide encoded by the cDNA for human cell surface antigen fas can mediate apoptosis. Cell 1991, 66:233-243 [DOI] [PubMed] [Google Scholar]
- 2.Micheau O, Solary E, Hammann A, Dimanche-Boitrel MT: Fas ligand-independent, FADD-mediated activation of the Fas death pathway by anticancer drugs. J Biol Chem 1999, 274:7987-7992 [DOI] [PubMed] [Google Scholar]
- 3.Sato T, Irie S, Kitada S, Reed JC: A protein tyrosine phosphatase that associates with Fas/APO-1 (CD95). Science 1995, 268:411-415 [DOI] [PubMed] [Google Scholar]
- 4.Li Y, Kanki H, Hachiya T, Ohyama T, Irie S, Tang GI, Mukai J, Sato TA: Negative regulation of Fas-mediated apoptosis by FAP-1 in human cancer cells. Int J Cancer 2000, 87:473-479 [DOI] [PubMed] [Google Scholar]
- 5.Ungefroren H, Voss M, Jansen M, Roeder C, Henne-Bruns D, Kremer B, Kalthoff H: Human pancreatic adenocarcinomas express Fas and Fas ligand yet are resistant to Fas-mediated apoptosis. Cancer Res 1998, 58:1741-1749 [PubMed] [Google Scholar]
- 6.Arai M, Kannagi M, Matsuoka M, Sato T, Yamamoto N, Fujii M: Expression of Fap-1 (Fas-associated phosphatase) and resistance to Fas-mediated apoptosis in T cell lines derived from human T cell leukemia virus type 1-associated myelopathy/tropical spastic paraparesis patients. AIDS Res Hum Retroviruses 1998, 14:261-267 [DOI] [PubMed] [Google Scholar]
- 7.Weislow OS, Kiser R, Fine DL, Bader J, Shoemaker RH, Boyd MR: New soluble-formazan assay for HIV-1 cytopathic effects: application to high-flux screening of synthetic and natural products for AIDS-antiviral activity. J Natl Cancer Inst 1989, 81:577-586 [DOI] [PubMed] [Google Scholar]
- 8.Rubinstein LV, Shoemaker RH, Paull KD, Simon RM, Tosini S, Skehan P, Scudiero DA, Monks A, Boyd MR: Comparison of in vitro anticancer drug-screening data generated with tetrazolium assay versus a protein assay against a diverse panel of human tumor cell lines. J Natl Cancer Inst 1990, 82:1113-1118 [DOI] [PubMed] [Google Scholar]
- 9.Monks A, Scudiero DA, Skehan P, Shoemaker RH, Paull KD, Vistica D, Hose C, Langley J, Cronise P, Vaigro-Wolff A, Gray-Goodrich M, Campball H, Mayo J, Boyd M: Feasibility of a high-flux anticancer drug screen using a diverse panel of cultured human tumor cell lines. J Natl Cancer Inst 1991, 83:757-766 [DOI] [PubMed] [Google Scholar]
- 10.Grever MT, Schepartz SA, Chabner BA: The National Cancer Institute Cancer Drug Discovery and Development. Semin Oncol 1992, 19:622-638 [PubMed] [Google Scholar]
- 11.Skehan P, Storeng R, Scudiero D, Monks A, McMahon J, Vistica D, Warren J, Bokesch H, Kenny S, Boyd M: New colorimetric cytotoxicity assay for anticancer drug-screening. J Natl Cancer Inst 1990, 82:1107-1112 [DOI] [PubMed] [Google Scholar]
- 12.Katsumata M, Siegel RM, Louie DC, Miyashita T, Tsujimoto Y, Nowell PC, Greene MI, Reed JC: Differential effects of Bcl-2 on T and B cells in transgenic mice. Proc Natl Acad Sci USA 1992, 89:11376-11380 [DOI] [PMC free article] [PubMed] [Google Scholar]
- 13.Reed JC, Tanaka S, Cuddy M, Cho D, Smith J, Kallen R, Saragovi HU, Torigoe T: A strategy for generating monoclonal antibodies against recombinant baculovirus-produced proteins: application to the Bcl-2 oncoprotein. Anal Biochem 1992, 205:70-76 [DOI] [PubMed] [Google Scholar]
- 14.Krajewska M, Wang HG, Krajewski S, Zapata JM, Shabaik A, Gascoyne R, Reed JC: Immunohistochemical analysis of in vivo patterns of expression of CPP32 (Caspase-3), a cell death protease. Cancer Res 1997, 57:1605-1613 [PubMed] [Google Scholar]
- 15.Kononen J, Bubendorf L, Kallioniemi A, Barlund M, Schraml P, Leighton S, Torhorst J, Mihatsch MJ, Sauter G, Kallioniemi OP: Tissue microarrays for high-throughput molecular profiling of tumor specimens. Nat Med 1998, 4:844-847 [DOI] [PubMed] [Google Scholar]
- 16.Rentrop M, Knapp B, Winter H, Schweizer J: Aminoalkylsilane-treated glass slides as support for in situ hybridization of keratin cDNAs to frozen tissue sections under varying fixation and pretreatment conditions. Histochem J 1986, 18:271-276 [DOI] [PubMed] [Google Scholar]
- 17.Krajewski S, Krajewska M, Shabaik A, Wang H-G, Irie S, Fong L, Reed JC: Immunohistochemical analysis of in vivo patterns of Bcl-X expression. Cancer Res 1994, 54:5501-5507 [PubMed] [Google Scholar]
- 18.Takayama S, Krajewski S, Krajewska M, Kitada S, Zapata JM, Kochel K, Knee D, Scudiero D, Tudor G, Miller GJ, Miyashita T, Yamada M, Reed JC: Expression and location of Hsp70/Hsc-binding anti-apoptotic protein BAG-1 and its variants in normal tissues and tumor cell lines. Cancer Res 1998, 58:3116-3131 [PubMed] [Google Scholar]
- 19.Zhang X, Brunner T, Carter L, Dutton R, Rogers P, Bradley L, Sato T, Reed J, Green D, Swain S: Unequal death in T helper cell effectors: th1, but not Th2, effectors undergo rapid Fas/FasL-mediated apoptosis. J Exp Med 1997, 185:1837-1849 [DOI] [PMC free article] [PubMed] [Google Scholar]
- 20.Yanagisawa J, Takahashi M, Kanki H, Yano-Yanagisawa H, Tazunoki T, Sawa E, Nishitoba T, Kamishohara M, Kobayashi E, Kataoka S, Sato T: The molecular interaction of Fas and FAP-1: a tripeptide blocker of human Fas interaction with FAP-1 promotes Fas-induced apoptosis. J Biol Chem 1997, 272:8539-8545 [DOI] [PubMed] [Google Scholar]
- 21.Myc A, Arscott PL, Bretz JD, Thompson NW, Baker JRJ: Characterization of FAP-1 expression and function in thyroid follicular cells. Endocrinology 1999, 140:5431-5434 [DOI] [PubMed] [Google Scholar]
- 22.Lee SH, Shin MS, Lee JY, Park WS, Kim SY, Jang JJ, Dong SM, Na EY, Kim CS, Kim SH, Yoo NJ: In vivo expression of soluble Fas and Fap-1: possible mechanisms of Fas resistance in human hepatoblastomas. J Pathol 1999, 188:207-212 [DOI] [PubMed] [Google Scholar]
- 23.Lee SH, Shin MS, Park WS, Kim SY, Kim HS, Lee JH, Han SY, Lee HK, Park JY, Oh RR, Jang JJ, Lee JY, Yoo NJ: Immunohistochemical localization of FAP-1, an inhibitor of Fas-mediated apoptosis, in normal and neoplastic human tissues. APMIS 1999, 107:1101-1108 [DOI] [PubMed] [Google Scholar]
- 24.Uslu R, Borsellino N, Frost P, Garban H, Ng CP, Mizutani Y, Belldegrun A, Bonavida B: Chemosensitization of human prostate carcinoma cell lines to anti-fas-mediated cytotoxicity and apoptosis. Clin Cancer Res 1997, 3:963-972 [PubMed] [Google Scholar]
- 25.Hedlund TE, Duke RC, Schleicher MS, Miller GJ: Fas-mediated apoptosis in seven human prostate cancer cell lines: correlation with tumor stage. Prostate 1998, 36:92-101 [DOI] [PubMed] [Google Scholar]
- 26.Cuppen E, Nagata S, Wieringa B, Hendriks W: No evidence for involvement of mouse protein-tyrosine phosphatase-bas-like fas-associated phosphatase-1 in fas-mediated apoptosis. J Biol Chem 1997, 272:30215-30220 [DOI] [PubMed] [Google Scholar]
- 27.Irie S, Hachiya T, Rabizadeh S, Maruyama W, Mukai J, Li Y, Reed J, Bredesen D, Sato T: Functional interaction of Fas-associated phosphatase-1 (FAP-1) with p75 and their effect on NF-kB activation. FEBS Lett 1999, 460:191-198 [DOI] [PubMed] [Google Scholar]
- 28.Onsrud M, Shabana A, Austgulen R: Soluble tumor necrosis factor receptors and CA125 in serum as markers for epithelial ovarian cancer. Tumour Biol 1996, 17:90-96 [DOI] [PubMed] [Google Scholar]
- 29.Onsrud M, Shabana A, Austgulen R, Nustad K: Comparison between soluble tumor necrosis factor receptors and CA125 in peritoneal fluids as a marker for epithelial ovarian cancer. Gynecol Oncol 1995, 57:183-187 [DOI] [PubMed] [Google Scholar]
- 30.Naylor MS, Stamp GW, Foulkes WD, Eccles D, Balkwill FR: Tumor necrosis factor and its receptors in human ovarian cancer. Potential role in disease progression. J Clin Invest 1993, 91:2194-2206 [DOI] [PMC free article] [PubMed] [Google Scholar]
- 31.Min YH, Lee S, Lee JW, Chong SY, Hahn JS, Ko YW: Expression of Fas antigen in acute myeloid leukemia is associated with therapeutic response to chemotherapy. Br J. Haematol 1996, 93:928-930 [DOI] [PubMed] [Google Scholar]
- 32.Eischen CM, Kottke TJ, Martins LM, Mesner PW, Basi GS, Tung JS, Earnshaw WC, Leibson PJ, Kaufmann SH: Comparison of apoptosis in wild-type and Fas-resistant cells: chemotherapy-induced apoptosis is not dependent on Fas/Fas ligand interactions. Blood 1997, 90:935-943 [PubMed] [Google Scholar]
- 33.McGahon AJ, Costa Pereira AP, Daly L, Cotter TG: Chemotherapeutic drug-induced apoptosis in human leukaemic cells is independent of the Fas (APO-1/CD95) receptor/ligand system. Br J Haematol 1998, 101:539-547 [DOI] [PubMed] [Google Scholar]
- 34.Houghton JA, Harwood FG, Tillman DM: Thymineless death in colon carcinoma cells is mediated via fas signaling. Proc Natl Acad Sci USA 1997, 94:8144-8149 [DOI] [PMC free article] [PubMed] [Google Scholar]
- 35.Tillman D, Petak I, Houghton J: A Fas-dependent Component in 5-fluorouracil/leucovorin-induced cytotoxicity in colon carcinoma cells. Clin Cancer Res 1999, 5:425-430 [PubMed] [Google Scholar]
- 36.Wu GS, Burns TF, McDonald ERR, Jiang W, Meng R, Krantz ID, Kao G, Gan DD, Zhou JY, Muschel R, Hamilton SR, Spinner NB, Markowitz S, Wu G, El-Deiry WS: KILLER/DR5 is a DNA damage-inducible p53-regulated death receptor gene. Nat Genet 1997, 17:141-143 [DOI] [PubMed] [Google Scholar]
- 37.Reinartz S, Boerner H, Koehler S, Von Ruecker A, Schlebusch H, Wagner U: Evaluation of immunological responses in patients with ovarian cancer treated with the anti-idiotype vaccine ACA125 by determination of intracellular cytokines—a preliminary report. Hybridoma 1999, 18:41-45 [DOI] [PubMed] [Google Scholar]
- 38.Disis ML, Grabstein KH, Sleath PR, Cheever MA: Generation of immunity to the HER-2/neu oncogenic protein in patients with breast and ovarian cancer using a peptide-based vaccine. Clin Cancer Res 1999, 5:1289-1297 [PubMed] [Google Scholar]
- 39.Shimizu M, Takeda Y, Yagita H, Yoshimoto T, Matsuzawa A: Antitumor activity exhibited by Fas ligand (CD95L) overexpressed on lymphoid cells against Fas+ tumor cells. Cancer Immunol Immunother 1998, 47:143-148 [DOI] [PMC free article] [PubMed] [Google Scholar]
- 40.Sawa E, Takahashi M, Kamishohara M, Tazunoki T, Kimura K, Arai M, Miyazaki T, Kataoka S, Nishitoba T: Structural modification of Fas C-terminal tripeptide and its effects on the inhibitory activity of Fas/FAP-1 binding. J Med Chem 1999, 42:3289-3299 [DOI] [PubMed] [Google Scholar]