

Abstract
Development of noninvasive methods for the diagnosis of transitional cell carcinoma (TCC) of the bladder remains a challenge. A ProteinChip technology (surface enhanced laser desorption/ionization time of flight mass spectrometry) has recently been developed to facilitate protein profiling of biological mixtures. This report describes an exploratory study of this technology as a TCC diagnostic tool. Ninety-four urine samples from patients with TCC, patients with other urogenital diseases, and healthy donors were analyzed. Multiple protein changes were reproducibly detected in the TCC group, including five potential novel TCC biomarkers and seven protein clusters (mass range, 3.3 to 133 kd). One of the TCC biomarkers (3.4 kd) was also detected in bladder cancer cells procured from bladder barbotage and was identified as defensin. The TCC detection rates provided by the individual markers ranged from 43 to 70% and specificities from 70 to 86%. Combination of the protein biomarkers and clusters, increased significantly the sensitivity for detecting TCC to 87% with a specificity of 66%. Interestingly, this combinatorial approach provided sensitivity of 78% for detecting low-grade TCC compared to only 33% of voided urine or bladder-washing cytology. Collectively these results support the potential of this proteomic approach for the development of a highly sensitive urinary TCC diagnostic test.
Bladder cancer is the second most common genitourinary malignancy accounting for ∼5% of all newly diagnosed cancers in the United States. 1 More than 90% are of the transitional cell carcinoma (TCC) histology. 2 At present, the most reliable way of diagnosis and surveillance of TCC is by cystoscopic examination and bladder biopsy for histological confirmation. The invasive and labor-intensive nature of this procedure presents a challenge to develop better, less costly, and noninvasive diagnostic tools. Urine cytology has for many years been the gold standard of the noninvasive approaches. It has high specificity and provides the advantage over biopsy of screening the entire urothelium. 2,3 However, its high false-negative rate, particularly for low-grade tumors, has limited its use as an adjunct to cystoscopy.
Many noninvasive molecular diagnostic tests have been developed based on an ever-increasing knowledge about the molecular alterations associated with bladder cancer pathogenesis. The bladder tumor antigen, 4 the bladder tumor antigen stat, 5 the fibrinogen/fibrin degradation products, 6 and the nuclear matrix protein-22 tests, 3,7 have been approved by the Food and Drug Administration to be used in conjunction with cystoscopy. Additional molecular assays currently being evaluated for their diagnostic/prognostic utility 2,3,8,9 are the Telomerase, 10 Immunocyt, 11 and hyaluronic acid/hyaluronidase 12,13 tests, microsatellite analysis, 14 as well as assays detecting blood group antigens, 15 carcinoembryonic antigen, 16 p53 and retinoblastoma proteins, 3 E cadherin, 17,18 and various growth factors. 9 Because of the molecular heterogeneity of these tumors, it is likely that there will be no single molecular assay that will replace cystoscopy. The identification and simultaneous analysis of a panel of biomarkers, representative of the various biological characteristics of the cancer, has greater potential for improving the early detection/diagnosis of TCC.
For many years, two-dimensional (2D) gel electrophoresis has been the principal tool for the separation and analysis of multiple proteins. 19 This methodology, which is able to resolve thousands of proteins in one experiment, provides the highest resolution in protein separation. However, it is labor intensive, requires large quantities of starting material, lacks interlab reproducibility, and is not practical for clinical application. Although development of image analysis software for the comparison of 2D gel-protein maps and automation of protein spot excision 20 have facilitated the analysis of the separated proteins, most of the major technical difficulties of 2D gel electrophoresis remain.
Significant technological advances in protein chemistry in the last 2 decades have established mass spectrometry as an indispensable tool for protein study. 21-23 Although the resolving power of 2D gels remains unchallenged, the high sensitivity, speed, and reproducibility of mass spectrometry have boosted its application in all aspects of protein analysis, including discovery, identification (ie, peptide mapping, sequencing), and structural characterization. Analogous to the DNA chip technologies that allow the study of gene expression profiles, Ciphergen Biosystems, Inc. (Fremont, CA) has recently developed the ProteinChip technology coupled with SELDI-TOF-MS (surface-enhanced laser desorption/ionization time of flight mass spectrometry) to facilitate protein profiling of complex biological mixtures. 24,25 This technology utilizes patented chip arrays to capture individual proteins from complex mixtures that are subsequently resolved by mass spectrometry. This innovative technology has numerous advantages over 2D-polyacrylamide gel electrophoresis: it is much faster, has a high-throughput capability, requires orders of magnitude lower amounts of the protein sample, has a sensitivity for detecting proteins in the picomole to attamole range, can effectively resolve low mass proteins (2,000 to 20,000 Da), and is directly applicable for clinical assay development.
The efficacy of the SELDI technology for discovery of prostate cancer protein markers in serum, seminal plasma, and cell extracts, as well as the development of immunoassays for the detection of known prostate cancer markers has recently been demonstrated by our laboratory. 26,27 This report describes our initial evaluation using the ProteinChip SELDI-MS system to detect potential TCC biomarkers in urine, and to assess these biomarkers for the diagnosis of TCC. Multiple protein changes were reproducibly found in the urine of TCC patients, including five potentially novel urinary TCC biomarkers, and seven protein cluster regions consisting of different numbers of proteins observed in the cancer versus the control groups. One of these potential urinary TCC-associated protein biomarkers was identified as belonging to the defensin family of peptides.
Materials and Methods
Study Participants
Urine samples were collected throughout a period of several months from patients seen in the department of Urology, Eastern Virginia Medical School. The urine samples were immediately aliquoted and stored at −80°C in the Tissue and Body Fluid Bank of the Virginia Prostate Center, until assayed. A total of 94 urine specimens were collected. The demographics of the TCC patient and control groups are provided in Table 1 ▶ . Healthy controls (n = 34) included volunteers with no evidence of disease, and healthy individuals (ie, no history or evidence of urological cancer) participating in the prostate cancer screening program at Eastern Virginia Medical School. TCC (n = 30 patients) was histologically or cytologically confirmed at the time of specimen collection. In the case of recurrences none of the patients had received chemo- or immunotherapy within 3 months before specimen collection. Grading was assessed using the World Health Organization system. Tumor stage and grade of patients with TCC are shown in Table 2 ▶ . Other urogenital diseases (n = 30 patients) included clinical or pathologically confirmed prostatitis (n = 6), prostatism (n = 9), urinary tract infections (n = 1), benign prostatic hyperplasia (n = 12), amyloidosis (n = 1), inflammation of prostate and bladder (n = 1), bladder outlet obstruction (n = 1), and prostate cancer (n = 1). One patient with benign prostatic hyperplasia and one with prostatism had concomitant prostatitis.
Table 1.
Demographics of the Study (TCC) and Control (Normal, Other Diseases) Groups
| TCC | Normal | Other | |
|---|---|---|---|
| No. of samples | 30 | 34 | 30 |
| Age range | 42–86 | 23–71 | 41–82 |
| Mean age | 69.4 | 55 | 68.5 |
Table 2.
Stage/Grade of Bladder Tumors
| Stage | No. of samples | Grade | No. of samples |
|---|---|---|---|
| Ta | 10 | I | 4 |
| Ta-CIS | 4 | II | 5 |
| T1 | 7 | III | 21 |
| T1-CIS | 1 | ||
| T2 | 4 | ||
| T2-CIS | 1 | ||
| T3 | 1 | ||
| CIS | 2 |
CIS, carcinoma in situ.
ProteinChip SELDI Analysis of Urine
Urine samples were thawed and briefly centrifuged (1 minute, 10,000 rpm) for the removal of cellular material. Protein concentration of the supernatants was estimated using the bicinchoninic acid kit (Pierce, Rockford, IL). Samples were diluted with binding buffer (20 mmol/L Tris, pH 9, 0.4 mol/L NaCl, 0.1% Triton X 100) to equal protein concentration (2 mg/ml) and subjected to protein size fractionation using a K30 microspin column (Ciphergen Biosystems, Inc.). After a 30-minute incubation on ice, diluted urine samples were applied to the spin columns and centrifuged for 3 minutes at 720 × g. The ProteinChip SELDI analysis was performed similar to that described in an earlier report. 26 Briefly, 5-μl aliquots of the flow-through (fraction) and the unfractionated sample diluted in 20 mmol/L Tris, pH 9.0, 0.1% Triton X-100, were directly applied onto different arrays of a SAX2 chip that consists of a strong anion exchanger chemistry. After a brief wash with H2O, 0.5 μl of saturated matrix solution (α-cyano-4-hydroxycinnamic acid in 50% acetonitrile and 0.5% trifluoroacetic acid) was applied on the array and allowed to air dry. The chips were then placed in the PBS-I mass reader, where nanosecond laser pulses are generated from a nitrogen laser (337 nm). Spectra were generated using an average of 60 laser shots at each of the following laser intensities (L): 15 (filter in), 30 (filter in), and 55 (filter out) and manually compared for the detection of protein differences between the various groups. A protein or protein cluster was considered to be differentially expressed in the TCC group, if statistically significant differences in its frequency, compared to the normal and/or other diseases group, were observed. For the calculation of protein peak numbers resolved at low laser intensities, spectra collected at L15 and L30 were combined using the SELDI software (0.5% variation). External calibration was performed using bovine insulin (5,733.6 Da), bovine cytochrome C (12,230.9 Da), and bovine serum albumin (66,410 Da) as standards (Ciphergen Biosystems, Inc.).
Processing of Bladder Barbotage
Bladder washings were centrifuged at 1,500 rpm for 5 minutes for the collection of cellular material. Supernatants were discarded with the exception of 1 to 2 ml that were used for resuspending the cell pellet. Cytospin preparations of 50 to 100 μl of the resuspended cell pellet were then made, the slides immediately placed in 100% EtOH, and stained with hematoxylin and eosin. The stained slides were examined by a pathologist (SN) to identify the cancer cells, and the individual cancer cells or clusters were procured using the Pixcell 100 Laser Capture Microdissection Microscope (Arcturus Engineering, Mountain View, CA), as previously described. 26,28
ProteinChip SELDI Analysis of Cell Lysates
Protein extracts were prepared from 500 to 1,000 microdissected cells by resuspending the cells in 3 to 5 μl of 20 mmol/L Hepes containing 0.1% Nonidet P-40, vortexing for 5 minutes, and then centrifugation at 14,000 rpm for 1 minute. The entire lysate was applied onto a nickel IMAC3 (Immobilized Metal Affinity) chip array, and incubated for 1 hour. The chips were washed with 20 mmol/L Tris, pH 7.5, 0.1% Triton X-100, 0.5 mol/L NaCl (5 times), and HPLC-H20 (5 times). Mass analysis was performed as described for urine, using either α-cyano-4-hydroxycinnamic acid or sinapinic acid as the energy absorbing molecules.
Statistical Analysis
Sensitivity is defined as the ratio of the TCC patients that contained the biomarker to the total number of TCC patients included in the study. Specificity is defined as the ratio of the individuals that do not have the protein peak and do not have TCC, to the total number of individuals without TCC. Positive predictive value is defined as the probability that an individual with the biomarker has TCC. Negative predictive value is defined as the probability that an individual without the biomarker does not have TCC. Statistics were performed using the chi-square test, after organizing the data in two-dimensional contingency tables and testing for independence of variables. Comparison of peak numbers between the various groups was performed using Student’s t-test. In all cases, P < 0.05 was considered statistically significant.
Immunoassay
The SELDI immunoassay was performed similar to that described in a previous report. 26 Briefly, the arrays of a preactivated chip (PS1, Ciphergen Biosystems, Inc.), were coated with 4 μl of Protein G (0.5 mg/ml in 50 mmol/L sodium bicarbonate, pH.8: Sigma Chemical Co., St. Louis, MO) for 2 to 4 hours at room temperature with shaking. Residual active sites were subsequently blocked with 1 mol/L ethanolamine (30 minutes, room temperature), followed by sequential washes in 15-ml conical tubes with phosphate-buffered saline (PBS) and 0.5% Triton X (3×) and PBS (4×). Two μl of defensins-1, -2, and -3 (HNP-1, -2, and -3) monoclonal antibody (mAb) (IgG1, 0.2 mg/ml; Serotec), prostate-specific membrane antigen (PSMA) 7E11C5.3 mAb (IgG1, 0.2 mg/ml; kindly provided by Cytogen Corporation, Princeton, NJ) or mouse IgG1 (30 μg/ml) were applied on the chip and allowed to bind at 4°C, overnight with shaking. Unbound Abs were removed by sequential washes in 15-ml conical tubes with PBS and 0.5% Triton X (1×), PBS and 0.1% Triton X (3×), and PBS (4 ×). Urine samples were diluted in 100 μl of PBS-0.1% CETAB 29 (Sigma Chemical Co., St. Louis, MO) at a total protein concentration of 0.055 mg/ml, and after a 20-minute incubation in ice, were applied onto the arrays using a bioprocessor (Ciphergen). After a 3-hour incubation at 4°C, the unbound urinary proteins were washed away by five washes with PBS-0.1% CETAB (5 minutes each, room temperature) followed by five washes with HPLC-H20, α-cyano-4-hydroxycinnamic acid added, and the chip subjected to mass analysis. The spectra were generated using signal averaging of 90 laser shots.
Results
Detection of Five TCC-Associated Proteins
Ninety-four urine samples were assayed by SELDI mass spectrometry. Processing on a strong anion exchanger chip surface resolved up to 70 protein peaks. Figure 1a ▶ is a representative protein spectrum showing the protein masses between 2,000 to 150,000 Da of a single urine specimen. Generation of spectra was performed at laser intensities 15, 30, and 55, so as to better resolve low- and high-molecular mass proteins, respectively. As shown, the SELDI technology was particularly effective in resolving the low molecular weight (<10 kd) proteins and polypeptides. Interestingly, urine samples from TCC patients appeared to contain higher numbers of protein peaks. Collection of data at laser intensities 15 and 30, generated an average of 33 protein peaks from the TCC urine samples versus an average of 21 and 22 for the normal and other urogenital diseases, respectively (P < 0.001). Similarly, at higher laser intensities (ie, 55-filter out), TCC samples had an average of 34 protein peaks, versus 27 and 20 in the normal and other urogenital diseases groups (P < 0.001 for the normals and P = 0.008 for the other diseases).
Figure 1.

a: Representative protein mass spectra of one urine sample processed on a strong anion exchange (SAX II) chip surface. b and c: Reproducibility of protein detection using the SELDI-TOF-MS technology. Lanes 1–3: mass spectra (top) and respective gel views (bottom) of urine sample processed in triplicate. Lanes 1 and 2 were processed on the same day whereas lane 3 on a different day. Numbers correspond to the mass of the respective protein peaks. m/z, mass/charge (in d). +H denotes that the respective peak is singly charged.
All samples were processed in either duplicate or triplicate to confirm reproducibility in resolving the urinary proteins. Figure 1, b and c ▶ , shows that reproducibility was quite acceptable. The mean, standard deviation (SD) and coefficient of variation (CV) were determined for four prominent peaks, designated as proteins 1 to 4. The intraassay reproducibility, ie, the mean mass, SD (%CV) for protein 1 was 6,440.6 ± 0.92 Da (0.014%); for protein 2, 7,914 ± 3.32 Da (0.042%); for protein 3, 13,262 ± 0.78 Da (0.006%); and for protein 4, 66,288 ± 69.3 Da (0.1%) (Figure 1, b and c ▶ ; spectra 1 and 2). The interassay reproducibility was determined to be 6,443.3 ± 3.85 Da (0.06%) for protein 1, 7,918.3 ± 6.12 Da (0.08%) for protein 2, 13,267 ± 8.42 Da (0.06%) for protein 3, and 66,277 ± 15.56 Da (0.023%) for protein 4 (Figure 1, b and c ▶ ; spectra 1 and 2 versus 3).
Analysis of urine specimens from patients with TCC, patients with other diseases of the urogenital tract, and normal individuals, revealed that five prominent protein peaks were preferentially expressed in TCC. Representative mass spectra and gel views of these proteins are shown in Figure 2 ▶ . One of the proteins was observed as a doublet or occasionally as a triplet protein peak (Figure 2a) ▶ having an average mass of 3.353 (SD: 21 Da), 3.432 (SD: 24.4 Da), and 3.470 kd (SD: 6.32 Da), respectively. This protein will be referred to as marker urinary bladder cancer 1 or UBC1. The average SELDI mass associated with the other four TCC-associated proteins are UBC2: 9.495 kd (SD: 46.5 Da); UBC3: 44.6 kd (SD: 372.8 Da); UBC4: 100.120 kd (SD: 866.8 Da); and UBC5: 133.190 kd (SD: 772.9 Da) (Figure 2 ▶ ; b, c, and d). Of the TCC patient urine samples evaluated, 47% (14 of 30) were positive for UBC1, 53% (16 of 30) for UBC2, 70% (21 of 30) for UBC3, 43% (13 of 30) for UBC4, and 63% (19 of 30) for UBC5 (Table 3A) ▶ . Frequency of almost all markers was observed to increase with progression from low-grade (I to II) to high-grade (III) and low-stage (Ta) to higher stage (T1–3) carcinomas (data not shown). Nevertheless, larger numbers of samples will need to be analyzed to confirm these initial observations.
Figure 2.

Detection of five TCC-associated protein peaks in urine. Mass spectra (top) and respective gel views (bottom) of urine samples from four different TCC patients (C1–C4), two normals (N1 and N2), and two patients with other urogenital diseases (B1 and B2). The average molecular mass of the five proteins identified to be unique or overexpressed in the TCC specimens are: UBC1, 3.352/3.432 kd (a, arrow) and occasionally 3.47 kd (a, arrowhead); UBC2, 9.495 kd (b, arrow); UBC3, 44.647 kd (c, arrow); UBC4, 100.120 kd; and UBC5: 133.190 kd (d, arrows). Numbers in the mass spectra represent the observed mass of the marker in that particular sample. M/z, mass/charge.
Table 3.
Summary of TCC-Associated Protein Data
| A. Detection of the 5 TCC-associated proteins in the study and control groups | ||||||||
|---|---|---|---|---|---|---|---|---|
| Number positive/number tested | P* | P** | ||||||
| Marker | Sensitivity % | Specificity N% | Specificity O% | Specificity All % | PPV% | NPV% | ||
| UBC1 | 47 (14/30) | 85 (5/34) | 87 (4/30) | 86 (9/64) | 61 | 76 | 0.01 < P < 0.025 | 0.01 < P < 0.025 |
| UBC2 | 53 (16/30) | 91 (3/34) | 70 (9/30) | 81 (12/64) | 57 | 79 | P < 0.001 | 0.1 < P < 0.25 |
| UBC3 | 70 (21/30) | 88 (4/34) | 70 (9/30) | 80 (13/64) | 62 | 85 | P < 0.001 | 0.001 < P < 0.005 |
| UBC4 | 43 (13/30) | 85 (5/34) | 87 (4/30) | 86 (9/64) | 59 | 76 | 0.01 < P < 0.025 | 0.01 < P < 0.025 |
| UBC5 | 63 (19/30) | 79 (7/34) | 60 (12/30) | 70 (19/64) | 50 | 80 | 0.001 < P < 0.005 | 0.1 < P < 0.25 |
| B. Frequency of the TCC-associated proteins according to age | ||
|---|---|---|
| Marker | Specificity N% (>50) | Specificity N% (<50) |
| UBC1 | 96 (1/22) | 67 (4/12) |
| UBC2 | 91 (2/22) | 92 (1/12) |
| UBC3 | 91 (2/22) | 83 (2/12) |
| UBC4 | 86 (3/22) | 83 (2/12) |
| UBC5 | 82 (4/22) | 75 (3/12) |
N, normal; O, other diseases; PPV, positive predictive value; NPV, negative predictive value. P*, P values from TCC and normal group comparison; P**, P values from TCC and other diseases group comparison.
>50, normal individuals older than 50 years old (range 50–71, mean 61.95); <50, normal individuals younger than 50 years old (range 23–49, mean 42.8).
The percent positive samples for the five biomarkers in the normal population were 15 (5 of 34) for UBC1, 9 (3 of 34) for UBC2, 12 (4 of 34) for UBC3, 15 (5 of 34) for UBC4, and 21 (7 of 34) for UBC5, corresponding to a specificity of 85, 91, 88, 85, and 79%, respectively (Table 3A) ▶ . The frequency of the markers in this control group is significantly different from their frequency in the TCC urine samples (Table 3A) ▶ , and does not appear to change significantly when aged-matched normal individuals (ie, older than 50 years old) are considered (Table 3B) ▶ .
Biomarkers UBC1 and UBC4 were found to be present in urine specimens from patients with other urogenital diseases at a frequency (4 of 30 or 13%) nearly equal to the normal group. Markers UBC2, -3, and -5, however, were found at relatively higher frequencies: 30% (9 of 30) for UBC2 and UBC3, and 40% (12 of 30) for UBC5. The difference in the frequency of the markers between this control (ie, other diseases) and the TCC cancer group remains statistically significant for markers UBC1, -3, and -4, but was not significant for markers UBC2 and UBC5 (Table 3A) ▶ .
Based on these results, the overall specificity of the individual markers for TCC detection range from 70 to 86% (Table 3A) ▶ . Similarly, the negative predictive values varied from 76 to 85%, and the positive predictive values from 50 to 62% (Table 3A) ▶ .
Detection of the 3.3/3.4-kd UBC1 Marker in Microdissected Bladder Cancer Cells
To test the cellular expression of the TCC-associated proteins in urine, bladder cancer cells were microdissected from a bladder barbotage, cell lysates prepared, and the lysates subjected to SELDI analysis. A total of six matched (ie, from the same TCC patient) bladder-washing and urine specimen sets were analyzed. Bladder cancer cells from all six patients expressed the 3.3/3.4-kd protein that was also present in 4 of 6 matched urine samples. Figure 3 ▶ shows three of the matched sets that were positive for the marker in both cell lysate and urine. It is notable, that the doublet peak pattern for this protein found in urine is maintained in the spectra of the cell lysates. Bladder epithelial cells from two different bladder barbotage specimens, characterized by the pathologist as benign, were also found to contain the 3.3/3.4-kd protein (data not shown). In contrast to the UBC1 protein marker, the 9.5-kd (UBC2), 44-kd (UBC3), 100-kd (UBC4), and 133-kd (UBC5) urinary proteins were not detected in the bladder cell lysates.
Figure 3.
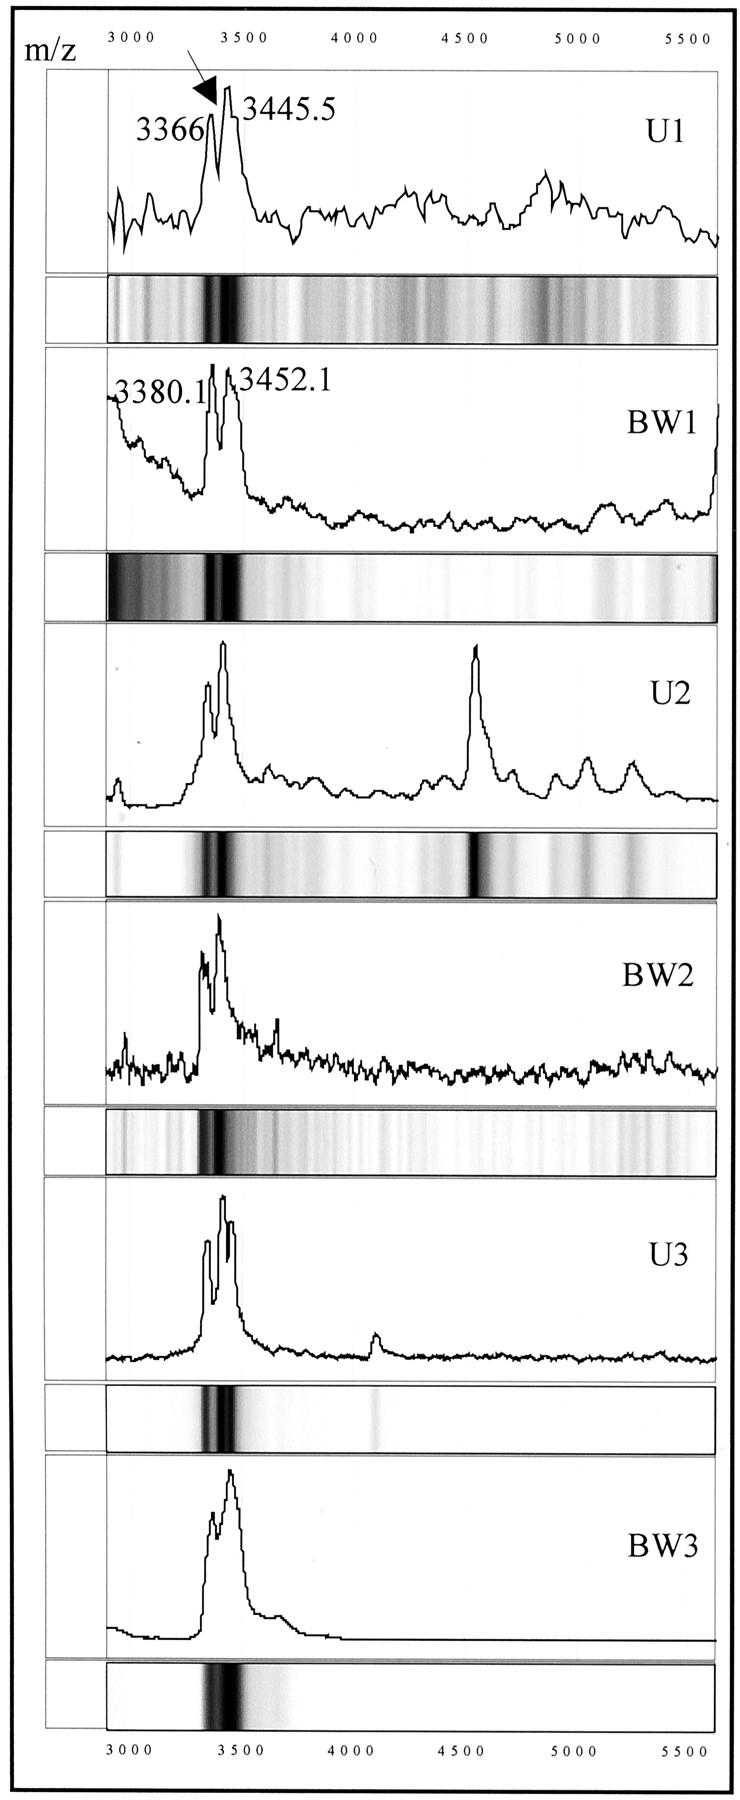
Protein mass spectra and gel views of three sets of matched urine samples (U1, U2, and U3) and cancer cells microdissected from bladder washings (BW1–BW3), showing the presence of the UBC1 protein (arrow) in the tumor cells and urine. M/z, mass/charge. Numbers correspond to the molecular mass of the respective protein peaks (in d).
Identification of the 3.3/3.4-kd UBC-1 Marker as a Member of the Defensin Family
Searching through protein databases (SWISS-PRO; www.expasy.ch/tools/tagident.html) for proteins with similar molecular weight to the five TCC-associated markers, suggested that the doublet 3.3/3.4-kd marker corresponds to human defensins-α2 and -α1 29 with reported molecular masses of 3.38 and 3.45 kd, respectively. To test this hypothesis, a SELDI-based immunoassay was performed using a commercially available antibody against human defensins-1, -2, and -3. A total of three positive and three negative urine specimens for this marker were analyzed. As shown in Figure 4A ▶ , marker UBC1 was readily captured when the defensin-α Ab was prebound on the chip. In contrast, in the absence of the defensin Ab (Figure 4B) ▶ or in the presence of an unrelated Ab, no specific binding above the background levels was detected (Figure 4, C and D) ▶ . Urine specimens that were UBC1-negative by SELDI direct binding remained UBC1-negative by the SELDI immunoassay (Figure 4E) ▶ .
Figure 4.

Identification of the 3.3/3.4-kd (UBC1) protein marker as defensin by SELDI immunoassay. A–D: A TCC urine, that by the direct-binding SELDI assay contained the 3.3/3.4-kd marker, was incubated with: defensin-α Ab (A), no Ab (B), an Ab reactive with prostate-specific membrane antigen (PSMA) (C), or an irrelevant isotype matched control immunoglobulin (D). E: Normal urine that did not contain the 3.3/3.4-kd protein incubated with defensin-α Ab. Note that the 3.3/3.4-kd protein was captured only in the sample containing this mass protein (A). F: Pure α defensin peptide (Peptides International, Louisville, KY) incubated with the α-defensin Ab. M/z, mass/charge.
Detection of Differentially Expressed Protein Clusters
In addition to the detection of differences in the frequency of individual protein peaks between the TCC and the control groups, regional differences in the mass spectra were also observed. Table 4 ▶ shows the number and percent positive, and P values for the seven protein cluster regions that demonstrated differences between the TCC group and control groups and Figure 5 ▶ shows the spectra of these regions. The protein pattern displayed by five of these clusters, including 4,950 to 5,150 Da (Figure 5a) ▶ , 5,710 to 6,000 Da (Figure 5a) ▶ , 6,758 to 7,750 Da (Figure 5b) ▶ , 15,000 to 16,000 Da (Figure 5c) ▶ , and 85,000 to 92,000 Da (Figure 5f) ▶ , was found to be significantly different in urine samples from TCC patients than the patterns found in the healthy and other disease controls. The only exception was the 37,500 to 40,000 Da (Figure 5d) ▶ region that was found not to be statistically (0.75 < P < 0.9) different between the TCC and the other diseases group. Interestingly, a protein cluster with masses ranging from 79,500 to 82,000 Da (Figure 5e) ▶ was found in 65% of the healthy control group and in 80% of urine samples from the non-TCC disease group but in only 33% of the TCC group. The difference in frequency of this cluster between the control and the TCC groups was statistically significant.
Table 4.
Detection of Protein Clusters with Differential Expression in the Study and Control Groups
| Mass range (kd) | Number of positive/total number (%) | P * | P † | ||
|---|---|---|---|---|---|
| TCC | Normal | Other | |||
| 4.950–5.150 | 17/30 (57) | 9/34 (26) | 2/30 (7) | 0.025 < P < 0.05 | P < 0.001 |
| 5.710–6.000 | 15/30 (50) | 4/34 (12) | 6/30 (20) | 0.001 < P < 0.005 | 0.025 < P < 0.05 |
| 6.758–7.750 | 20/30 (67) | 4/34 (12) | 11/30 (37) | P < 0.001 | 0.025 < P < 0.05 |
| 15.000–16.000 | 19/30 (63) | 8/34 (24) | 7/30 (23) | 0.001 < P < 0.005 | 0.001 < P < 0.005 |
| 37.500–40.000 | 20/30 (67) | 7/34 (21) | 16/30 (53) | P < 0.001 | 0.75 < P < 0.9 |
| 79.500–82.000 | 10/30 (33) | 22/34 (65) | 24/30 (80) | 0.001 < P < 0.005 | P < 0.001 |
| 85.000–92.000 | 15/30 (50) | 5/34 (15) | 5/30 (17) | 0.005 < P < 0.01 | 0.01 < P < 0.025 |
*P values from TCC and normal group comparison.
†P values from TCC and other diseases group.
Figure 5.


Detection of differentially expressed protein clusters. Mass spectra of urinary proteins from three TCC patient urine samples (C1, C2, and C3) and three normal urine samples (N1, N2, and N3) showing the presence of the 4.95 to 5.15-kd (a, left bracket), 5.71 to 6-kd (a, right bracket), 6.758 to 7.75-kd (b, bracket), 15 to 16-kd (c, bracket), 37.5 to 40-kd (d, bracket), 85 to 92-kd (f, bracket) clusters in the TCC urine samples and 79.5 to 82-kd (e, bracket) in the normal urine samples. Numbers correspond to the molecular mass of the respective protein peaks (in d). +H denotes that the respective peak is singly charged.
Similar to the UBC1–5 markers, the frequency of most of the clusters was observed to increase with progression from grades I to II to grade III and stage Ta to stages T1 to T3 carcinomas and also to not be significantly affected by age (data not shown).
Combination of the TCC Markers Increases Sensitivity in TCC Detection
The SELDI technology provides the advantage of analyzing multiple markers simultaneously. Therefore, to maximize the diagnostic utility of the TCC-associated biomarkers, the individual proteins UBC1 to UBC5 and seven protein clusters were placed in various combinations to form a biomarker panel, and the urine spectra for all groups re-analyzed. A biomarker combination was classified as positive if any marker of the combination set was present in a sample, and negative if none of the markers were detected in the specimen. Using these biomarkerpanels, the sensitivity for detecting TCC increased from 43 to 70%, using individual biomarkers (Table 3) ▶ to 83 to 87%. (Table 5) ▶ . However, as expected, there was a compromise in the overall specificity of the assay, from an average of 81% for single markers to 67% using a combination of biomarkers (Table 5) ▶ . There was a notable increase in the negative predictive values of the assay to 90% versus an average of 79% for a single marker, and the positive predictive values of 54% (Table 5) ▶ was similar to the average positive predictive values of 58% for a single assay (Table 3) ▶ .
Table 5.
Sensitivity and Specificity of Multiple Biomarker Panels
| Marker (kd) | Sensitivity % | Specificity (N%) | Specificity (O%) | Specificity (All%) | PPV % | NPV% |
|---|---|---|---|---|---|---|
| 3.3/9.5/100 | 83 | 71 | 63 | 67 | 54 | 90 |
| 3.3/44/85–92 | 83 | 71 | 63 | 67 | 54 | 90 |
| 3.3/9.5/85–92 | 87 | 71 | 60 | 66 | 54 | 91 |
N, normal; O, other urogenital diseases. PPV, positive predictive value; NPV, negative predictive value.
The combination of the 3.3/3.4- and 9.5-kd markers and the 85- to 92-kd cluster was identified as the best of the biomarker combinations in terms of assay sensitivity. Using this set, a sensitivity of 87% was obtained with a specificity of 66%, and a negative predictive value and positive predictive value of 91 and 54%, respectively (Table 5) ▶ .
All three of the combination sets shown on Table 5 ▶ , were capable of detecting low-grade and low-stage carcinomas with relatively high sensitivity. As shown in Table 6 ▶ , the 3.3/3.4-, 44-, and 85- to 92-kd combination set detects 67% of grade I and II and 71% of stage Ta carcinomas. The 3.3/3.4-, 9.5-, 100-kd, and 3.3/3.4-, 9.5- and 85- to 92-kd combination sets provided a slightly superior sensitivity of 78% for grades I and II and 79% for Ta carcinomas. Most notable was that the detection rate of the SELDI urine assay was markedly superior to the 33% rate obtained by either voided urine or bladder washing cytology for these same patients. All combination biomarker panels, provided higher sensitivities (86 to 91%) in detecting grade III carcinomas and with the exception of the 3.3/3.4-, 9.5-, and 100-kd set, stage T1 to T3 tumors (93%).
Table 6.
Sensitivity of the Biomarker Panels versus the Stage and Grade of Tumor
| Marker (kd) | Grade I, II | Grade III | Ta* | T1*, T2*, T3 |
|---|---|---|---|---|
| 3.3/9.5/100 | 78 | 86 | 79 | 79 |
| 3.3/44/85–92 | 67 | 91 | 71 | 93 |
| 3.3/9.5/85–92 | 78 | 91 | 79 | 93 |
*Patients with concomitant carcinoma in situ have been included (see Table 2 ▶ ).
Discussion
The search for bladder cancer biomarkers that could potentially replace cystoscopy as a diagnostic and surveillance tool has been complicated by the molecular heterogeneity of this disease. The multiple protein differences observed between and within the TCC and the non-TCC control groups in our study, exemplify this heterogeneity and enhance the role of protein profiling as a potential novel diagnostic and prognostic approach.
Two-dimensional gel electrophoresis has been the classical proteomic tool for protein separation and analysis. It has vastly contributed to our current knowledge of the proteomics of bladder cancer by generating disease-associated protein databases, 30,31 leading to the identification of potential TCC-associated biomarkers. 32,33 Although the ability of 2D to resolve thousands of proteins remains unchallenged, the complexity of the experimental procedure involved and the very high amounts of starting material, makes it impractical for direct clinical application.
Wright and colleagues, 26 and Paweletz and colleagues, 27 have used the Protein Chip mass spectrometry technology to detect potentially novel biomarkers of prostate cancer in serum, seminal plasma, 26 and cell extracts. 26,27 Furthermore, chip-based multiplex immunoassays for the simultaneous detection of known prostate cancer markers are currently under development. 26,34 Our results expand these initial findings, and further support the applicability of this technology for protein profiling of urine samples as a method of high diagnostic sensitivity for TCC.
With the exception of the 79.5- to 82-kd protein cluster that appeared more frequently in the normal compared to the TCC group, the rest of individual markers and clusters were TCC-associated. This may be considered as a reflection of increased protein excretion in urine of bladder cancer patients detected herein and reported earlier 18,35 and attributed either to leakage of serum proteins from the tumor neovasculature, or to increased turnover of bladder cancer cells. 18 If this holds true however, the specificity of the assay may be affected by the presence of renal disease, and this will have to be addressed in future studies.
In the current study quantitative differences of proteins between the various groups have not been addressed, which may provide an additional explanation for the lack of detection of additional normal-associated protein peaks. This is because of the fact that detection and confirmation of quantitative differences by mass spectrometry is not yet standardized and, although feasible, is technically very challenging. 22 The development of a reliable method of protein quantification as well as the application of different types of chip chemistries that promises to increase the resolving power of the assay, are ongoing efforts to detect additional normal- as well as TCC- associated urinary proteins.
Searching the protein databases suggested that the 3.3/3.4-kd TCC-associated protein (biomarker UBC1) might be a member of the defensin family of peptides. The identity was confirmed to be defensins-1 and -2 using a SELDI immunoassay. Defensins form a family of small peptides with antimicrobial, cytotoxic, and anti-tumor activities. 36 Based on their primary structure, two families, the α- and β-defensins have been characterized in humans. 37 β-defensins have been found to be primarily expressed in epithelial cells of the kidneys, skin, and respiratory system 38,39 whereas α-defensins in neutrophils and intestinal Paneth cells. 40 Recent data further demonstrate the immunolocalization of α-defensins in Langerhans cells and duct cells of submandibular glands of oral carcinoma patients 41,42 as well as endothelial and smooth muscle cells of coronary vessels. 43 The presence of defensin peptides in bladder cancer cells has not been reported before. This finding may be secondary to release of these peptides from tumor activated neutrophils. Alternatively, expression of these peptides by the bladder cells cannot be ruled out and will have to be tested by studies at the mRNA level.
The presence of the Paneth cell-specific defensin in urine from ileal neobladder has been demonstrated, 44 nevertheless, the presence of that type of defensin in urine samples from the same patients before cystectomy could not be shown. The Ab used in our study recognizes the neutrophil-specific defensins HNP1, 2, and 3, providing an explanation for the different results obtained in the two studies.
The presence of the defensin polypeptides in benign bladder cells suggests that, in contrast to urine, the presence of this marker is not tumor-specific at the cellular level. However, changes in its amount during tumorigenesis are expected to occur, resulting in the detection of higher levels in the urine from TCC patients. Alternatively, the presence of these polypeptides may also be indicative of the initial phases of tumorigenesis, not yet detected by the pathologist. In support of this hypothesis is the fact that one patient was found with TCC stage T1, grade II 3 months after the collection of the bladder barbotage. In any case, development of a sensitive immunoassay to monitor quantitative changes of this peptide may provide useful information with regard to tumor development and progression.
The mass of the UBC2 to UBC5 TCC-associated urinary proteins matches a variety of proteins, such that their identity cannot be made with any certainty. Therefore, studies are ongoing to purify and identify these proteins by tryptic peptide mapping 20 and amino acid sequencing. 23
With the exception of the defensins, peaks of similar mass to the UBC2 to UBC5 urinary biomarkers were not detected in cancer cells procured from cytology specimens. Although utilization of suboptimal cell lysis conditions cannot be ruled out, there are several additional possible explanations for this result, including identification of these markers as extracellular proteins, or alternatively, as proteolytic fragments of intracellular proteins.
The sensitivity of each individual marker (UBC1 to UBC5) or each of the seven protein clusters for detecting TCC was found to be relatively low. However, combining the individual markers and protein clusters increased the overall TCC detection rate and the rate for low-grade and low-stage carcinomas. Larger scale studies addressing the efficacy of these and other markers, either used individually or in combination, for detecting the different stages/grades of TCC will be essential. Nevertheless, based on the exploratory study described in this report, the SELDI combinatorial approach provided a sensitivity of 78% in detecting grade I and II carcinomas, compared to sensitivities of 20 to 30% by voided urine cytology. 3 Although these results are preliminary, this observation coupled with the prospective for further marker addition, suggests the potential of the SELDI proteomic approach for detecting early TCC.
The combinatorial biomarker analysis approach increased the sensitivity, but decreased the specificity of the assay. However, it should be noted that this approach relies on simple conventional statistical methods. To reliably process the enormous amount of SELDI data, and increase the overall accuracy of the assay, some type of artificial intelligence program, such as fuzzy logic, cluster analysis, or neural network (ANN) will be most likely required. ANNs previously developed to predict outcome in prostate 45 or bladder cancers 46 based on clinicopathological and molecular markers have provided promising results. Artificial intelligence programs for the ProteinChip SELDI system are currently under development. Further improvements in the diagnostic accuracy of the SELDI assay will have to take into consideration the reproducibility of repeat testing of urine from the same individual, as well as possible diurnal variations.
In conclusion, the ability to simultaneously test for multiple protein changes by the Protein Chip SELDI system, increases the diagnostic sensitivity, and with appropriate statistical methodology, has the potential to improve the urinary diagnosis of TCC. Larger scale studies to establish the potential of these findings and correlate the SELDI diagnostic approach with known TCC urinary markers are in progress.
Acknowledgments
We thank Dr. E. Dalmasso from Ciphergen Biosystems, Inc. for critical review of this manuscript and helpful suggestions throughout the course of this work.
Footnotes
Address reprint requests to Antonia Vlahou, Ph.D, Department of Microbiology and Molecular Cell Biology, Eastern Virginia Medical School, 700 W. Olney Rd., Norfolk, VA, 23507. E-mail: vlahoua@borg.evms.edu.
Supported in part by grants from the American Cancer Society (IRG-93-036-06), the National Cancer Institute Early Detection Research Network (CA85067), and the Virginia Prostate Center. A. V. is recipient of a fellowship from the American Foundation of Urologic Disease and Hoechst Marion Roussel Inc.
Current address of S. Mendrinos: Department of Pathology, Emory University, Atlanta, GA.
References
- 1.Klein A, Zemer R, Buchumensky V, Klaper R, Nissenkorn I: Expression of cytokeratin 20 in urinary cytology of patients with bladder carcinoma. Cancer 1998, 82:349-354 [PubMed] [Google Scholar]
- 2.Stein JP, Grossfeld GD, Ginsberg DA, Esrig D, Freeman JA, Figueroa AJ, Skinner D, Cote R: Prognostic markers in bladder cancer: a contemporary review of the literature. J Urol 1998, 160:645-659 [DOI] [PubMed] [Google Scholar]
- 3.Grossman HB, Dinney CPN: Markers of bladder cancer state of the art. Urol Oncology 2000, 5:3-10 [DOI] [PubMed] [Google Scholar]
- 4.Schamhart DHJ, Reijke TM, Poel HG, Witjes JA, Boer EC, Kurth K-H, Schalken JA: The Bard BTA test: its mode of action, sensitivity, and specificity compared to cytology of voided urine, in the diagnosis of superficial bladder cancer. Eur Urol 1998, 34:99-106 [DOI] [PubMed] [Google Scholar]
- 5.Sarosdy MF, Hudson MA, Ellis WJ, Soloway MS, de Vere White R, Sheinfeld J, Jarowenko MV, Schellhammer PF, Schervish EW, Patel JV, Chodak GW, Lamm DL, Johnson RD, Henderson M, Adams G, Blumenstein BA, Thoelke KR, Pfalzgraf RD, Murchison HA, Brunelle SL: Improved detection of recurrent bladder cancer using the bard BTA stat test. Urology 1997, 50:349-353 [DOI] [PubMed] [Google Scholar]
- 6.Schmetter BS, Habicht KK, Lamm DL, Morales A, Bander NH, Grossman HB, Hanna MG, Jr, Silberamn SR, Butman BT: A multicenter trial evaluation of the fibrin/fibrinogen degradation products test for detection and monitoring bladder cancer. J Urol 1997, 158:801-805 [DOI] [PubMed] [Google Scholar]
- 7.Soloway MS, Briggman JV, Caprinito GA, Chodak GW, Church PA, Lamm DL, Lange P, Messing E, Pasciak RM, Resevitz GB, Rukstalis DB, Sarosdy MF, Stadler WM, Thiel RP, Hayden CL: Use of a new tumor marker, urinary NMP22, in the detection of occult or rapidly recurring transitional cell carcinoma of the urinary tract following surgical treatment. J Urol 1996, 156:363-367 [DOI] [PubMed] [Google Scholar]
- 8.Orntoft TF, Wolf H: Molecular alteration in bladder cancer. Urol Res 1998, 26:223-233 [DOI] [PubMed] [Google Scholar]
- 9.Halachmi S, Linn JF, Amiel GE, Moskovitz B, Nativ O: Urine cytology, tumour markers and bladder cancer. Br J Urol 1998, 82:647-654 [DOI] [PubMed] [Google Scholar]
- 10.Hoshi S, Takahashi T, Satoh M, Numahata K, Suzuki K-I, Ohyama C, Mori M, Mituoka T, Nakagawara K-I, Orikasa S: Telomerase activity. Simplification of assay and detection in bladder tumor and urinary exfoliated cells. Urol Oncol 2000, 5:25-30 [DOI] [PubMed] [Google Scholar]
- 11.Fradet Y, Lochart C: Performance characteristics of a new monoclonal antibody test for bladder cancer: immunoCytTM. Can J Urol 1997, 4:400-405 [PubMed] [Google Scholar]
- 12.Pham HT, Block NL, Lokeshwar VB: Tumor-derived hyaluronidase: a diagnostic urine marker for high grade bladder cancer. Cancer Res 1997, 57:778-783 [PubMed] [Google Scholar]
- 13.Lokeshwar VB, Obek C, Soloway MS, Block NL: Tumor-associated hyaluronic acid: a new sensitive and specific urine marker for bladder cancer. Cancer Res 1997, 57:773-777 [PubMed] [Google Scholar]
- 14.Steiner G, Schoenberg MP, Linn JF, Mao L, Sidransky D: Detection of bladder cancer recurrence by microsatellite analysis of urine. Nat Med 1997, 6:621-624 [DOI] [PubMed] [Google Scholar]
- 15.Golijanin D, Sherman Y, Shapiro A, Pode D: Detection of bladder tumors by immunostaining of the Lewis X antigen in cells from voided urine. Urology 1995, 46:173-177 [DOI] [PubMed] [Google Scholar]
- 16.Liu BC, Neuwirth H, Wei Zhu L, Stock LM, DeKernion JB, Fahey JL: Detection of onco-fetal bladder antigen in urine of patients with transitional cell carcinoma. J Urol 1987, 137:1258-1261 [DOI] [PubMed] [Google Scholar]
- 17.Banks RE, Porter WH, Whelam P, Smith PH, Seldy PJ: Soluble forms of E-cadherin in urine. J Clin Pathol 1995, 48:179-180 [DOI] [PMC free article] [PubMed] [Google Scholar]
- 18.Protheroe AS, Banks RE, Mzimba M, Southgate J, Singh PN, Bosomworth M, Harnden P, Smith PH, Whelan P, Selby PJ: Urinary concentrations of the soluble adhesion molecule E-cadherin and total protein in patients with bladder cancer. Br J Cancer 1999, 80:273-278 [DOI] [PMC free article] [PubMed] [Google Scholar]
- 19.O’ Farrell PH: High resolution two-dimensional gel electrophoresis of proteins. J Biol Chem 1975, 250:4007-4021 [PMC free article] [PubMed] [Google Scholar]
- 20.Patterson SD: From electrophoretically separated proteins to identification: strategies for sequence and mass analysis. Anal Biochem 1994, 221:1-15 [DOI] [PubMed] [Google Scholar]
- 21.Carr SA, Hemling ME, Bean MF, Roberts GD: Integration of mass spectrometry in analytical biotechnology. Anal Chem 1991, 63:2802-2824 [DOI] [PubMed] [Google Scholar]
- 22.Carr SA, Annan RS: Overview of peptide and protein analysis by mass spectrometry. Current Protocols in Molecular Biology. Edited by FM Ausubel, R Brent, RE Kingston, DD Moore, JG Seidman, JA Smith, K Struhl. New York, John Wiley & Sons Inc., 1998, unit 10.21, pp 10.21.1–10.21.27 [DOI] [PubMed]
- 23.Patterson SD: Protein identification and characterization by mass spectrometry. Current Protocols in Molecular Biology. Edited by FM Ausubel, R Brent, RE Kingston, DD Moore, JG Seidman, JA Smith, K Struhl. New York, John Wiley & Sons Inc., 1998, unit 10.22, pp 10.22.1–10.22.24 [DOI] [PubMed]
- 24.Hutchens TW, Yip TT: New desorption strategies for the mass spectrometric analysis of macromolecules. Rapid Commun Mass Spectrom 1993, 7:576-580 [Google Scholar]
- 25.Kuwata H, Yip T-T, Yip CL, Tomita M, Hutchens WT: Bactericidal domain of lactofferin: detection, quantitation and characterization of lactoferricin in serum by SELDI affinity mass spectrometry. Biochem Biophys Res Commun 1998, 245:764-773 [DOI] [PubMed] [Google Scholar]
- 26.Wright GL, Jr, Cazares LH, Leung S-M, Nasim S, Adam B-L, Yip T-T, Schellhammer PF, Gong L, Vlahou A: ProteinChip surface enhanced laser desorption/ionization mass spectrometry: a novel protein biochip technology for detection of prostate cancer biomarkers in complex protein mixtures. Prostate Cancer Prostate Dis 1999, 2:264-276 [DOI] [PubMed] [Google Scholar]
- 27.Paweletz CP, Gillespie JW, Ornstein DK, Simone NL, Brown MR, Cole KA, Wang Q-H, Huang J, Hu N, Yip T-T, Rich WE, Kohn EC, Linehan WM, Weber T, Taylor P, Emmert-Buck MR, Liotta LA, Petricoin EF, III: Rapid protein profiling of cancer progression directly from human tissue using a protein biochip. Drug Dev Res 2000, 49:34-42 [Google Scholar]
- 28.Emmert-Buck MR, Bonner RF, Smith PD, Chuagui FR, Zhuang Z, Goldstein SR, Weiss RA, Liotta LA: Laser capture microdissection. Science 1996, 274:998-1001 [DOI] [PubMed] [Google Scholar]
- 29.Panyutich AV, Voitenok NN, Lehrer RI, Ganz T: An enzyme immunoassay for human defensins. J Immunol Methods 1991, 141:149-155 [DOI] [PubMed] [Google Scholar]
- 30.Rasmussen HH, Orntoft TF, Wolf H, Celis JE: Towards a comprehensive database of proteins from the urine of patients with bladder cancer. J Urol 1996, 155:2113-2119 [PubMed] [Google Scholar]
- 31.Celis JE, Ostergaard M, Rasmussen HH, Gromov P, Gromova I, Varmark H, Palsdottir H, Magnusson N, Andersen I, Basse B, Lauridsen JB, Ratz G, Wolf H, Orntoft TF, Celis P, Celis A: A comprehensive protein resource for the study of bladder cancer: http://biobase.dk/cgi-bin/celis. Electrophoresis 1999, 20:300-309 [DOI] [PubMed] [Google Scholar]
- 32.Celis JE, Ostergaard M, Basse B, Celis A, Lauridsen JB, Ratz GP, Andersen I, Hein B, Wolf H, Orntoft TF, Rasmussen HH: Loss of adipocyte—type fatty acid binding protein and other protein biomarkers is associated with progression of human bladder transitional cell carcinoma. Cancer Res 1996, 56:4782-4790 [PubMed] [Google Scholar]
- 33.Ostergaard M, Rasmussen HH, Nielsen HV, Vorum H, Orntoft TF, Wolf H, Celis JE: Proteome profiling of bladder squamous cell carcinomas: identification of markers that define their degree of differentiation. Cancer Res 1997, 57:4111-4117 [PubMed] [Google Scholar]
- 34.Xiao Z, Jiang X, Beckett ML, Wright GL, Jr: Generation of a baculovirus recombinant prostate-specific membrane antigen and its use in the development of a novel protein biochip quantitative immunoassay. Protein Expr Purif 2000, 19:12-21 [DOI] [PubMed] [Google Scholar]
- 35.Hemmingsen L, Rasmussen F, Skaarup P, Wolf H: Urinary protein profiles in patients with urothelial bladder tumours. Br J Urol 1981, 53:324-329 [DOI] [PubMed] [Google Scholar]
- 36.Lichtenstein AK, Ganz T, Nguyen TM, Selsted ME, Lehrer RI: Mechanism of target cytolysis by peptide defensins. Target cell metabolic activities, possibly involving endocytosis, are crucial for expression of cytotoxicity. J Immunol 1988, 140:2686-2694 [PubMed] [Google Scholar]
- 37.Liu L, Zhao C, Heng HHQ, Ganz T: The human b-defensin-1 and a-defensins are encoded by adjacent genes: two peptide families with differing disulfide topology share a common ancestry. Genomics 1997, 43:316-320 [DOI] [PubMed] [Google Scholar]
- 38.Zhao C, Wang I, Lehrer RI: Widespread expression of beta-defensin hBD-1 in human secretory glands and epithelial cells. FEBS Lett 1996, 396:319-322 [DOI] [PubMed] [Google Scholar]
- 39.Yang D, Chertov O, Bykovskaia SN, Chen Q, Buffo MJ, Shogan J, Anderson M, Schroder JM, Wang JM, Howard OMZ, Oppenheim JJ: β-Defensins: linking innate and adaptive immunity through dendritic and T cell CCR6. Science 1999, 286:525-528 [DOI] [PubMed] [Google Scholar]
- 40.Selsted ME, Miller SI, Henschen AH, Ouellette AJ: Enteric defensins: antibiotic peptide components of intestinal host defense. J Cell Biol 1992, 118:929-936 [DOI] [PMC free article] [PubMed] [Google Scholar]
- 41.Mizukawa N, Sugiyama K, Yamachika E, Ueno T, Mishima K, Takagi S, Sugahara T: Presence of defensin in epithelial Langerhans cells adjacent to oral carcinomas and precancerous lesions. Anticancer Res 1999, 19:2969-2972 [PubMed] [Google Scholar]
- 42.Mizukawa N, Sugiyama K, Kamio M, Yamachika E, Ueno T, Fukunaga J, Takagi S, Sugahara T: Immunohistochemical staining of human alpha-defensin-1 (HNP-1), in the submandibular glands of patients with oral carcinomas. Anticancer Res 2000, 20:1125-1127 [PubMed] [Google Scholar]
- 43.Barnathan ES, Raghunath PN, Tomaszewski JE, Ganz T, Cines DB, Higazi AA-R: Immunohistochemical localization of defensin in human coronary vessels. Am J Pathol 1997, 150:1009-1019 [PMC free article] [PubMed] [Google Scholar]
- 44.Porter EM, Poles MA, Lee JS, Naitoh J, Bevins CL, Ganz T: Isolation of human intestinal defensins from ileal neobladder urine. FEBS Lett 1998, 434:272-276 [DOI] [PubMed] [Google Scholar]
- 45.Snow PB, Smith DS, Catalona WJ: Artificial neural networks in the diagnosis of prostate cancer: a pilot study. J Urol 1994, 152:1923-1926 [DOI] [PubMed] [Google Scholar]
- 46.Qureshi KN, Naguib RNG, Hamdy FC, Neal DE, Mellon JK: Neural network analysis of clinicopathological and molecular markers in bladder cancer. J Urol 2000, 163:630-633 [PubMed] [Google Scholar]