

Abstract
We have developed a protocol for degenerate oligonucleotide-primed-polymerase chain reaction-based array comparative genomic hybridization (array CGH) that, when combined with a laser microdissection technique, allows the analysis of cancer cell populations isolated from routine, formalin-fixed, paraffin-embedded tissue samples. Comparison of copy number changes detected by degenerate oligonucleotide-primed-polymerase chain reaction-based array CGH to those detected by conventional array CGH or fluorescence in situ hybridization, demonstrated that amplifications can be reliably detected. Using a genomic microarray containing 57 oncogenes, we screened a total of 28 breast cancer samples and obtained a detailed amplicon profile that is the most comprehensive to date in human breast cancer. The array CGH method described here will allow the genetic analysis of paraffin-embedded human cancer materials for example in the context of clinical trials.
A major objective of current cancer research is to develop a detailed molecular characterization of tumor cells and tissues linked to clinical information. The development of high throughput technologies has opened the way for whole genome and proteome analysis of cancers. For example, DNA arrays on microchips are being developed for numerous applications, including the ability to screen genes rapidly for mutations/single nucleotide polymorphisms and to study patterns of gene expression, amplification, or deletion on a large scale. 1-4 Until recently these analyses could only be performed on fresh or frozen tissue and required significant amounts of scarce tissue resources. However, paraffin-embedded tissue blocks are routinely available, and the development of methodologies to analyze this material has the potential to impact significantly in the molecular profiling of human cancers. Gene amplifications are common in many different tumor types and may confer diagnostic, prognostic, or therapeutic information for patient management. Tissue microdissection enables the purification of samples so that genetic aberrations can be investigated even from small tumor lesions with high sensitivity. Several papers report the combination of degenerate oligonucleotide primed-polymerase chain reaction (DOP-PCR) labeling and comparative genomic hybridization (CGH) 5,6 however, the reliability of this technique at the single gene level remains to be established. We aimed to determine and establish the validity and reproducibility of DOP-PCR, such that the array CGH analysis of large series of microdissected cancer lesions becomes possible. We report here on a protocol that allows extensive screening for genetic amplification by genomic microarray technology, using small amounts of DNA from archived microdissected clinical tumor material, which is amplified by DOP-PCR. We demonstrate the ability to measure increased copy number by profiling 57 oncogenes in 28 breast cancer cases and cell lines, and compare the results with those of nick-translation-based array CGH, metaphase CGH, and fluorescence in situ hybridization (FISH).
Materials and Methods
Cell Lines and Primary Tumor Samples
Eighteen human breast cancer cell lines, KPL-1, VP185, VP229, VP267, VP303, SUM149, SUM159, SUM185, SUM225, OCUB-F, OCUB-M, Matu, MT-1, MT-3, CAL51, MDA-MB157, MDA-MB175, and MCF7, were grown in monolayers in medium supplemented with 5 to 10% fetal bovine serum. Extraction of DNA from the cancer cell lines was performed using DNAzol Reagent (Life Technologies Ltd., Paisley, UK).
Primary breast tumor samples were obtained from 10 patients. The use of clinical materials for research was approved by the Research Ethics Committee. Cancer cells were obtained by laser capture microdissection (PixCell II laser capture microdissection system; Arcturus Engineering, Inc., Mountain View, CA). 7 Captured cells (∼500) were immediately resuspended in 20 μl of buffer containing 10 mmol/L Tris-HCl, pH 8.3, 2.5 mmol/L MgCl2, 50 mmol/L KCl, 0.45% Nonidet P-40, 0.45% Tween 20, 0.1 mg/ml proteinase K, and were incubated overnight at 55°C. The mixture was boiled for 10 minutes to inactivate the proteinase K and was used for DOP-PCR.
DOP-PCR
DOP-PCR was performed according to our published protocol 8 with modifications for formalin-fixed tissue. PCR was performed on a thermocycler (model PTC-225; MJ Research, Inc., Watertown, MA) in two separate phases. In the preamplification step, the eight initial cycles were performed at low stringency conditions (denaturation at 94°C for 90 seconds, annealing at 30°C for 180 seconds, ramp from 30 to 72°C for 210 seconds, and extension at 72°C for 180 seconds), followed by 25 cycles in high stringency conditions (denaturation at 94°C for 90 seconds, annealing at 62°C for 90 seconds, and extension at 72°C for 90 seconds; a final extension for 480 seconds at 72°C followed). This primary DOP-PCR product is labeled in a second amplification step for 28 cycles in high stringency conditions mentioned above. UN1 primer (5′-CCG ACT CGA GNN NNN NAT GTG G-3′, with N = A, C, G, T) was used in both reactions.
Array-CGH
Array-CGH was performed following the original protocol for nick-translation 3 and using a protocol modified to use DOP-PCR product. Briefly, normal female DNA (normal reference DNA) was labeled by nick translation with Alexa Fluor 594-5-dUTP (Molecular Probes, Leiden, The Netherlands) and the tumor DNAs with Alexa Fluor 488-5-dUTP (Molecular Probes). Direct red/green-fluorescence labeling (594-5-dUTP or 488-5-dUTP) of the same DNA samples was also performed by two-step DOP-PCR as mentioned above. Labeled test DNA (0.5 μg of nick-translated DNA or 1.5 μg of the labeled DOP-PCR product) and normal reference DNA (0.5 μg or 1.5 μg, respectively), were mixed in hybridization buffer (Vysis, Inc., Downers Grove, IL), and hybridized to AmpliOnc I DNA array (Vysis, Inc.). This chip contains 59 clones from 57 oncogenes (BCL2 and AR are represented by both 5′ and 3′ genomic clones) representing genomic regions that have been reported to be amplified in human tumors. We made two hybridization combinations (except where indicated otherwise): nick-labeled test DNA versus nick-labeled reference DNA (standard array CGH hybridization) and DOP-PCR-labeled test DNA versus DOP-PCR-labeled reference DNA (DOP-PCR-based array CGH). Arrays were hybridized for 24 to 48 hours, washed, and counterstained with the 4,6-diamidino-2-penylindole (DAPI) IV mounting solution.
Imaging and Analysis
Arrays were analyzed using GenoSensor Reader System (Vysis, Inc.). The filter set used in this system is: blue light excitation filter, 405/11 nm; green light, 490/17 nm; red light, 570/20 nm; and triple bandpass emission filter, 463/25 nm, 530/30 nm, and 615/30 nm. Signals from reference and test DNA (594-5-dUTP and 488-5-dUTP, respectively) were quantitatively detected with exposure times of 0.5 to 20 seconds by autoexposure system. Images were analyzed with custom software that segmented the array targets based on the DAPI staining, estimated and subtracted the background in the green and red fluorescence images, and calculated the total intensity and the intensity ratio of green and red signals for each target (three replicate spots for each target gene). The Pearson’s r correlation of a scatterplot of the test versus reference signal intensities for the pixels in each target was calculated. Data from targets with r values below 0.8 were discarded. The test/reference ratios are defined as ratio of the sum of test intensity pixel values to the sum of reference intensity pixel values. For each target ratios on replicate targets with r > 0.8 were averaged.
Control Amplicon DNA
To test the performance of the protocols and system used for amplification detection we used a mixture of DNAs (CoSH) extracted from three tumor cell lines (Vysis Inc.). The CoSH DNA is mixed as follows: COLO 320 (colon cancer), 35%; SJSA-1 (sarcoma), 40%; and BT-474 (breast cancer), 25%.
FISH
Metaphase chromosomes were prepared by standard methods. The nine breast cancer cell lines used for this study were: KPL-1, VP229, SUM159, OCUB-F, Matu, MT-1, MT3, CAL51, and MDA-MB175. Slides were denatured for 90 seconds in 70% formamide/2× standard saline citrate at 72°C and immediately snap-cooled in ice-cold ethanol series. Denatured centromeric and single-locus FISH probes in dual color combinations were hybridized according to a standard protocol; and where relevant, detected with fluorescein isothiocyanate-conjugated anti-digoxigenin antibody. The following genes were studied: ERBB2 (Appligene Oncor, Tucson, AZ), ZNF217 (Vysis Inc.), MYC (Appligene Oncor or Vysis Inc.), and CCND1 (Vysis, Inc.), as well as a centromeric probe for chromosome 17 as a control. FISH experiments using touch preparation of frozen breast cancer tissues were also performed. The copy number index for each oncogene was calculated as follows: (average gene copy number)/(modal chromosome number) × 23. The average gene copy number of 50 to 100 interphase nuclei and/or metaphases by FISH, and the modal chromosome number calculated by 24-color FISH karyotyping, interphase FISH, and from previously published data. 9
CGH
CGH was performed as described elsewhere 10 in 24 breast cancer samples (18 cancer cell lines and 6 breast cancer tissues). At least 15 metaphases were captured on a Zeiss Axioplan II fluorescent microscope using SmartCapture VP software (Digital Scientific Ltd., Cambridge, UK) and analyzed by Quips CGH analysis software (Vysis Inc.). The threshold set for gains corresponded to a mean hybridization ratio between tumor and normal of >1.2:1, and for losses of <0.8:1.
Results and Discussion
Optimization and Validation of DOP-PCR-Based Array-CGH
We first tested the feasibility of DOP-PCR-based array CGH by analyzing genomic DNAs from normal lymphocytes or tumor cell lines, and by comparing the data with that of a nick translation-based array CGH. First we hybridized normal female DNA against the same DNA, which was labeled with Alexa Fluor 488-5-dUTP (green fluorescence) or Alexa Fluor 594-5-dUTP (red fluorescence), respectively. We made four hybridization combinations: 1) nick-labeled normal DNA (green) versus nick-labeled normal DNA (red), 2) DOP-PCR-labeled normal DNA (green) versus DOP-PCR-labeled normal DNA (red), 3) nick-labeled normal DNA (green) versus DOP-PCR-labeled normal DNA (red), and 4) DOP-PCR-labeled normal DNA (green) versus nick-labeled normal DNA (red). After hybridization and washing, we detected the average green/red fluorescence ratio on three independent spotted genomic clones for each gene on the AmpliOnc I microarray. These showed uniform and even hybridization for all 57 target genes on the genomic microarray: 1) average fluorescence ratio 1.01 (SD, 0.09); 2) 1.01 (0.08); 3) 0.99 (0.07); and 4) 1.03 (0.05). These results confirm that DOP-PCR labeling of DNA is comparable to nick translation in diploid cells without amplifications or deletions. Next, we tested the performance of the system and validity of our protocols in the detection of genetic amplification using human CoSH control DNA (Vysis, Inc.). We independently labeled genomic DNA from CoSH mixture in green/red, and from normal female leukocytes in red/green by nick translation or DOP-PCR. The following hybridization combinations were done, 1) nick-labeled CoSH DNA (green) versus nick-labeled reference DNA (red); 2) DOP-PCR-labeled CoSH DNA (green) versus DOP-PCR-labeled reference DNA (red); 3) nick-labeled CoSH DNA (red) versus nick-labeled reference DNA (green); and 4) DOP-PCR-labeled CoSH DNA (red) versus DOP-PCR-labeled reference DNA (green). The fluorescence ratios determined using nick-translation showed almost complete concordance with the values for all eight genes with known amplification (for example: MYC 9.9 versus 10.3, SAS/CDK4 3.3 versus 3.1, and ZNF217 2.3 versus 2.1) (Figure 1) ▶ . The fluorescence ratio of the amplifications detected by DOP-PCR-based array CGH, showed good concordance with, but in some cases underestimated the ratio determined by nick-translation labeling (for example: MYC 6.5 versus 10.3, SAS/CDK4 2.5 versus 3.1, and ZNF217 1.4 versus 2.1). For all 57 genes on the chip, there was a statistically significant correlation between the fluorescence ratios obtained using the two labeling methods (Spearmans ρ = 0.84, P < 0.001). Moreover, comparison between normal and inverse hybridization confirmed the presence of copy number aberrations at all eight loci examined using both labeling methods. There was also a significant correlation between the fluorescence ratios from inverse hybridization experiment using the two labeling methods (Spearmans ρ = 0.73, P < 0.001). Having established the methodology and hardware performance, we labeled genomic DNA from a human breast cancer cell line, KPL-1, in green, and genomic DNA from normal female leukocytes in red by nick-translation and DOP-PCR, independently, and co-hybridized the labeled DNAs (green and red) to the genomic microarray (Figure 2, A ▶ and B). The increase in fluorescence ratio detected by DOP-PCR-based array CGH closely approximated the ratio determined by nick-translation labeling (examples: NRAS 5.31 versus 5.55), although in some cases DOP-PCR-based array CGH underestimated copy number, particularly for high-level amplifications (examples: RPS6KB1 2.81 versus. 9.39, AIB1, 4.44 versus 8.03) (Figure 2C) ▶ . Nevertheless, DOP-PCR-based array CGH detected all amplifications that were found using nick-translation.
Figure 1.

Validation of copy number measurements by array CGH. Fluorescence ratios (y axis) on the eight gene targets (x axis) for independent comparison of CoSH DNA to normal reference DNA using different labeling methods. Bold line represents the reference values provided with the CoSH DNA (Vysis, Inc.). Dotted lines above x axis represent the hybridization ratios of CoSH DNA (green fluorescence) versus normal DNA (red fluorescence). Dotted lines below x axis represent the hybridization ratios of inverse hybridization (CoSH-red and normal-green).
Figure 2.
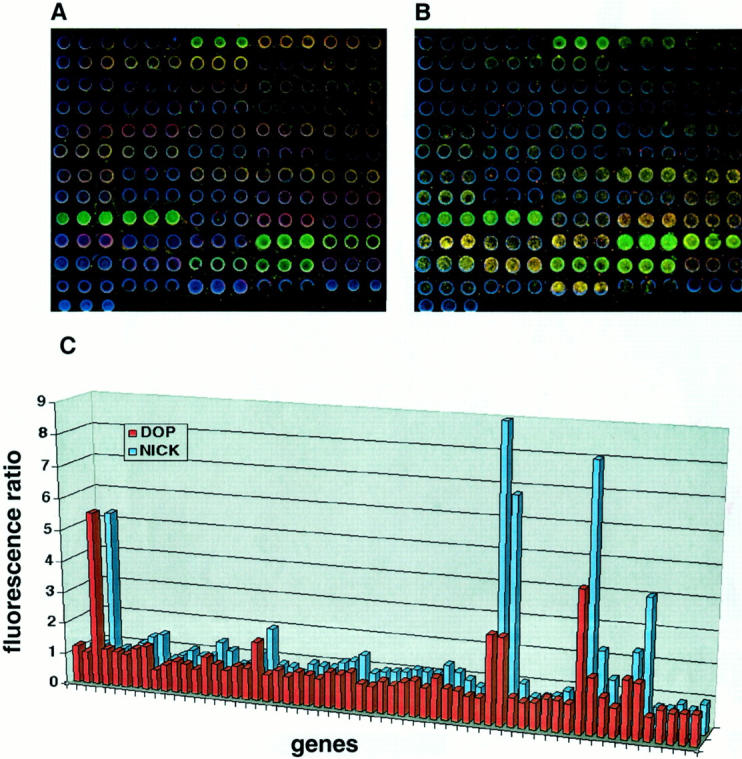
Array-CGH analysis using nick-translation and DOP-PCR labeling. DNA from KPL1, a breast cancer cell line was labeled in green and normal female DNA in red. A: Image of nick-translation based genomic microarray hybridization. B: Image of DOP-PCR-based genomic microarray hybridization. Arrays were counterstained with DAPI (blue). C: Comparison of the green-to-red fluorescence ratio (y axis) between nick-labeling and DOP-PCR labeling (z axis) at 57 genes (x axis).
To determine the accuracy (sensitivity and specificity) of array CGH to detect copy number gains using both labeling methods, we compared fluorescence ratio with copy number index obtained by FISH in nine cell lines using three extensively studied genes as probes: MYC (8q24.12-q24.3), ERBB2 (17q21.2), and ZNF217 (20q13.2) (Figure 3, A and B) ▶ . An excellent correlation was observed between array CGH, using the two different labeling methods and FISH analysis (Figure 3, C and D) ▶ . Analysis of the scatterplot indicated a fluorescence ratio threshold for amplification of 1.3. Using nick-translation-based array CGH, this threshold was 100% sensitive and specific in detecting copy number gains (copy number index of 1.5) (Figure 3C) ▶ , and was compatible with the distribution of fluorescence ratios in the normal-to-normal DNA hybridization. The threshold experimentally determined by our study underestimates the true copy number index (1.3 versus 1.5), however, it shows good concordance with the data from other reports of array CGH, including different methods: matrix-based CGH and cDNA microarray based CGH. 2,4 For example, most low copy number changes were detected as a fluorescence intensity ratio <1.5 (∼1.1 ∼ 1.4) using matrix CGH, and average fluorescence ratio for X-chromosomal genes in a case of 47, XXX was 1.31 (1.15 to 1.5) using cDNA microarray-based CGH. Figure 3D ▶ also shows that DOP-PCR-based array CGH is highly sensitive and specific. However, the most appropriate fluorescence ratio threshold for amplification could not be precisely determined, with values between 1.1 and 1.2 resulting in sensitivity and specificity of 100%.
Figure 3.
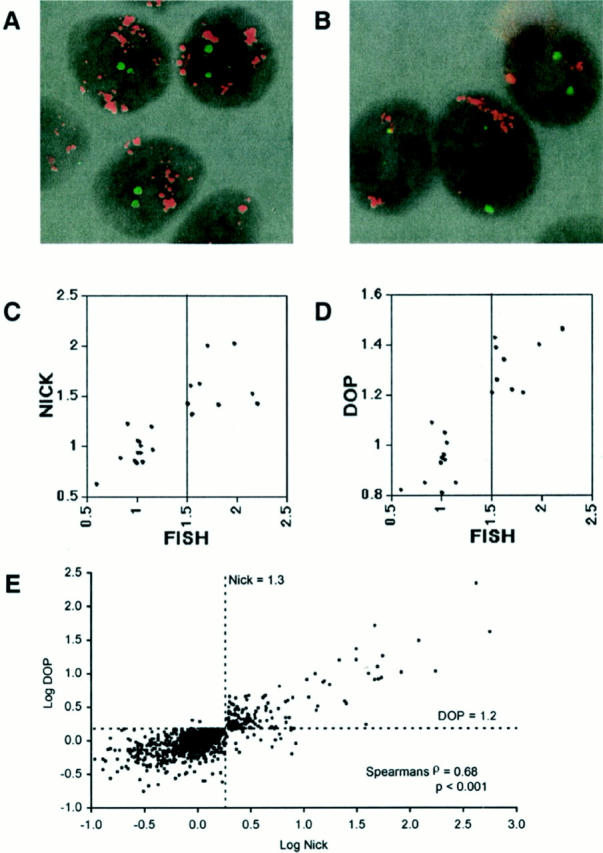
Determination of the fluorescence ratio threshold of array CGH. A: FISH analysis of the breast cancer cell line KPL-1 using ZNF217 and ERBB2 genes as probes. Each gene was labeled with SpectrumOrange (red fluorescence) and fluorescein isothiocyanate (green fluorescence), respectively. High-grade amplification of the ZNF217 gene was observed. B: FISH analysis of the breast cancer cell line SUM159 using MYC (red fluorescence) and centromeric (chromosome 17, green fluorescence) probes. High-grade amplification of MYC gene was shown. C and D: Scatterplot of the copy number index (x axis) determined by FISH of three different probes (MYC, ERBB2, and ZNF217) in nine breast cancer cell lines and the average fluorescence ratio (y axis) of the corresponding genes detected by array CGH (C, nick-translation; D, DOP-PCR). Highly amplified genes that cannot be quantitatively scored by FISH (because of diffuse distribution of signal or too many copies to count) were excluded from the comparative analysis between FISH and array CGH. E: Scatterplot of log (fluorescence ratio) for nick translation-based array CGH versus log (fluorescence ratio) for DOP-PCR-based array CGH for 57 genes in 18 human breast cancer cell lines. The dotted lines represent the fluorescence ratio thresholds for amplification.
We determined the most appropriate fluorescence ratio threshold for DOP-PCR-based array CGH by comparing the results of DOP-PCR array CGH with the results of nick translation-based array CGH in a much larger dataset. Amplification of all 57 oncogenes was evaluated in 18 breast cancer cell lines by both methods and the concordance for the two methods was very good (Figure 3E) ▶ . Analysis of the scatter plot revealed that the best fluorescence ratio threshold for DOP-PCR-based array CGH was 1.2 that had 98.4% positive predictive value, 97.6% negative predictive value, 90.6% sensitivity, and 99.6% specificity against the result of nick-translation. Treating the fluorescence ratio as a continuous variable there was a statistically significant correlation between the scores of the two methods (Spearmans ρ = 0.68, P < 0.001). Comparing this threshold with the distribution in fluorescence ratio of the normal-to-normal DNA hybridization using DOP-PCR labeling confirms its suitability. We also confirmed the suitability of these array CGH fluorescence ratio thresholds by detecting the trisomy of chromosome 7 found by 24-color FISH karyotyping 9 in the breast cancer cell line MT-3. The average fluorescence ratio (using three genes on chromosome 7) for nick-translation was 1.4 (range, 1.35 to 1.46) and for DOP-PCR-based array CGH 1.3 (range, 1.22 to 1.45).
Highly amplified genes that cannot be quantitatively scored by FISH (because of diffuse distribution of signal or too many to count signal dots) were initially excluded from the comparative analysis between FISH and array CGH; however all of these were detected as amplification using array CGH. The fluorescence ratio of these high-grade amplifications detected by DOP-PCR-based array CGH, showed good concordance with, but in some cases underestimated the ratio determined by nick-translation labeling (for example: ERBB2 2.5 versus 5.5 in OCUB-F and MYC 5.05 versus 15.66 in SUM159).
The number of gene deletions detected was small, so we were unable to determine the fluorescence ratio thresholds for deletion. However, in addition to the data mentioned above, similar analysis demonstrated the ability of DOP-PCR-based array CGH to detect single-copy deletion of the X chromosome gene (Androgen Receptor, Xq11-q12) in a comparison of normal male (XY) and female (XX) genomic DNA (fluorescence ratio of 0.69). This deletion ratio is comparable to previous array CGH reports. 1-4 Since most reports so far used a limited number of genetic loci (a few X chromosome genes in Turner’s syndrome samples, for example) to investigate deletion, further genetic target spots that are deleted in cancer will need to be analyzed to optimize the detection level for deletion by array CGH.
To determine whether results from the optimized DOP-PCR-based array CGH can be reproduced on paraffin tissue samples dissected by laser capture microdissection, we performed two experiments. First, we performed array CGH using DOP-PCR labeling in two paraffin-embedded tissues and using nick-translation in frozen sections from the same cases. All frozen and paraffin tissues were dissected by laser capture microdissection (Figure 4; A, B, and C ▶ ). The results of DOP-PCR-based array CGH in these two paraffin-embedded cancer samples showed significant concordance with that of nick-translation-based array CGH in tumor frozen sections (Spearmans ρ = 0.74, P < 0.01) (Figure 4D) ▶ . Second, using touch preparations of these two frozen sections, we analyzed the copy number of four genes (CCND1, MYC, ERBB2, and ZNF217). Complete concordance (100% sensitivity/specificity) between array CGH with DOP-PCR or nick-translation labeling and FISH analysis was observed for these four genes when we used the thresholds determined in cell lines (data not shown). These results confirmed the ability of DOP-PCR-based array CGH to detect amplification even in laser microdissected paraffin-embedded samples. Recently, it was reported that the high sensitivity of real-time PCR (with the 5′-exonuclease-based assay) enabled the reliable and objective detection of low-level amplifications of a single gene in as few as 50 breast cancer cells from laser-microdissected paraffin tissue sections. 11 Thus, independently this data confirms the ability to detect single gene amplifications in DNA samples isolated from paraffin-embedded cancer tissues.
Figure 4.

Array-CGH of laser capture microdissected cancer cells. Sequential laser capture microdissection of breast cancer in a representative case is shown before (A) and after (B) the microdissection procedure. The captured cancer tissue is also shown (C) (H&E; original magnification, ×100). D: Scatterplot of fluorescence ratio for nick translation-based array CGH in two tumor frozen sections versus fluorescence ratio for DOP-PCR-based array CGH labeling in paraffin-embedded tissues from the same cases for 57 genes. The lines represent the fluorescence ratio thresholds for amplification.
Because BCL2 and AR are represented by both 5′ and 3′ genomic clones on this chip, we compared the fluorescence ratio at these targets in 20 samples using both labeling methods. The fluorescence ratios showed complete concordance with both methods. These results further confirm the reliability of the protocols used.
Detailed Amplicon Profiling of Breast Cancer
We obtained a detailed amplicon profile using a microarray chip containing 57 oncogenes (Table 1) ▶ (the detailed amplicon profile of the 57 oncogenes in Table 1 ▶ are available on the Internet (http://www.cimr.cam.ac.uk/research/groups.htm), with data from nick-translation and DOP-PCR-based array CGH in 18 cell lines and two frozen breast cancer tissues, and data from DOP-PCR-based array CGH in eight cases of paraffin-embedded cancer tissues. Twenty-four of these samples (18 cell lines and 6 cancer tissues) were also analyzed by metaphase CGH (Figure 5) ▶ . In all, 379 gains covering 49 genetic loci from 21 chromosomes were observed by array CGH (data summarized in Table 1 ▶ ). Allelic gains at frequencies of >20% were observed at 39 genetic loci. Eighteen of these genes have been extensively studied in breast cancer (Table 1A ▶ , column a) and we show a similar or higher frequency of gain compared to previous reports. 12-14 This increase in frequency may be because of the high sensitivity of our method to detect small copy number increases, or differences in pathological stage and grade of samples. Thirteen genes (Table 1B ▶ , column a) constitute a group that has been implicated in breast carcinogenesis by expression or functional analysis, and we show that these are amplified in a proportion of breast cancers. We detected an increase copy number of KRAS2 in 10 of 27 cases (37%) of breast cancer by both labeling methods (fluorescence ratio ranging from 1.2 ∼ 5.11) (Table 1B ▶ , column a). Eight of these cases did not have an accompanying increase in copy number of adjacent genes (CCND2, 12p13), indicating a lesser probability of regional amplification or aneuploidy for this chromosome. A diploid cell line, CAL51 also had an increased fluorescence ratio of KRAS2 (1.77). Such a copy number change in KRAS2 may represent gene-specific or small region amplification. In human breast cancers, activating mutation of the KRAS2 gene (12p12.1) is uncommon. 15 To our knowledge, just one case of amplification of the KRAS2 gene not associated with point mutation has previously been reported (in a lung metastasis of rectal carcinoma). 16 Our results suggest that KRAS2 activation by amplification might be involved in the progression of human breast cancers. Eight loci not previously shown to be amplified in breast cancer were also identified (Table 1C ▶ , column a).
Table 1.
Frequency of Copy Number Change by Array CGH and Metaphase CGH in Breast Cancer
| Gene | Location | a (%)* | b (%)† | c (%)‡ | ||||
|---|---|---|---|---|---|---|---|---|
| A. Genes previously reported to be amplified in breast cancer | ||||||||
| NRAS | 1p13.2 | 8/27 (30) | 2/4 (50) | 5/19 (26) | ||||
| FGFR1 | 8p11.2-p11.1 | 5/25 (20) | 1/4 (25) | 3/17 (18) | ||||
| MYC | 8q24.12-q24.3 | 18/27 (67) | 11/13 (85) | 5/10 (50) | ||||
| HRAS | 11p15.5 | 8/28 (29) | 3/5 (60) | 2/19 (11) | ||||
| CCND1 | 11q13 | 8/28 (29) | 6/9 (67) | 1/15 (7) | ||||
| FGF4/FGF3 | 11q13 | 7/28 (25) | 6/9 (67) | 0/15 (0) | ||||
| EMS1 | 11q13 | 10/28 (36) | 6/9 (67) | 1/15 (7) | ||||
| GARP | 11q13.5-q14 | 9/28 (32) | 5/8 (63) | 2/16 (13) | ||||
| MDM2 | 12q14.3-q15 | 6/27 (22) | 2/3 (67) | 2/20 (10) | ||||
| AKT1 | 14q32.3 | 11/28 (39) | 5/7 (71) | 2/17 (12) | ||||
| TOP2A | 17q21-q22 | 6/28 (21) | 1/6 (17) | 3/18 (17) | ||||
| ERBB2 | 17q21.2 | 11/28 (39) | 4/6 (67) | 4/18 (22) | ||||
| AIB1 | 20q12 | 10/28 (36) | 8/17 (47) | 2/7 (29) | ||||
| STK15 | 20q13 | 12/27 (44) | 10/17 (59) | 2/6 (33) | ||||
| CSE1L | 20q13 | 14/26 (54) | 8/15 (53) | 3/7 (43) | ||||
| MYBL2 | 20q13.1 | 9/28 (32) | 5/17 (29) | 4/7 (57) | ||||
| PTPN1 | 20q13.1-q13.2 | 14/28 (50) | 11/17 (65) | 2/7 (29) | ||||
| ZNF217 | 20q13.2 | 11/28 (39) | 9/17 (53) | 2/7 (29) | ||||
| B. Genes suspected to be amplified in breast cancer | ||||||||
| MYCN | 2p24.1 | 6/28 (21) | 1/4 (25) | 3/20 (15) | ||||
| RAF1 | 3p25 | 7/27 (26) | 3/4 (75) | 2/18 (11) | ||||
| MYB | 6q22 | 7/23 (30) | no amp. | 6/19 (32) | ||||
| EGFR | 7p12.3-p12.1 | 7/28 (25) | 3/6 (50) | 3/18 (17) | ||||
| PGY1 | 7q21.1 | 8/28 (29) | 4/7 (57) | 3/17 (18) | ||||
| MOS | 8q11 | 6/27 (22) | 2/5 (40) | 4/18 (22) | ||||
| KRAS2 | 12p12.1 | 10/27 (37) | 3/5 (60) | 7/22 (32) | ||||
| IGFR1 | 15q25-q26 | 6/28 (21) | 3/7 (43) | 2/17 (12) | ||||
| FES | 15q26.1 | 7/28 (25) | 1/6 (17) | 3/18 (17) | ||||
| RPS6KB1 | 17q23 | 13/28 (46) | 6/8 (75) | 5/16 (31) | ||||
| JUNB | 19p13.2 | 6/24 (25) | 3/4 (75) | 1/16 (6) | ||||
| PDGFB | 22q12.3-q13.1 | 8/28 (29) | 5/5 (100) | 2/19 (11) | ||||
| AR | Xq11-q12 | 5/23 (22) | 3/3 (100) | 2/16 (13) | ||||
| C. Novel genes amplified in breast cancer | ||||||||
| FGR | 1p36.2-p36.1 | 6/22 (27) | 2/6 (33) | 3/13 (23) | ||||
| LAMC2 | 1q25-q31 | 9/28 (32) | 4/6 (67) | 3/18 (17) | ||||
| TERC | 3q26.3 | 7/24 (29) | 2/4 (50) | 5/17 (29) | ||||
| PDGFRA | 4q12 | 6/28 (21) | no amp. | 4/24 (17) | ||||
| MET | 7q31 | 7/25 (28) | 3/4 (75) | 4/18 (22) | ||||
| GLI | 12q13.2-q13.3 | 6/28 (21) | 1/5 (20) | 2/19 (11) | ||||
| INSR | 19p13.2 | 8/25 (32) | 3/4 (75) | 3/17 (18) | ||||
| CCNE1 | 19q13.1 | 6/28 (21) | 3/12 (25) | 2/12 (17) | ||||
*a; Number of cancers with copy number gains per total samples tested (in 28 samples).
†b; Fraction of amplicons detected by CGH in which a specific oncogene amplification was identified by array CGH (in a total of 24 cases).
‡c; Fraction of cancers (in 24 cases) without a specific chromosomal band amplicon by classical CGH in which array CGH detected oncogene amplification.
no amp.; no amplification was detected by metaphase CGH.
Figure 5.

Summary ideogram of amplifications detected by array CGH and metaphase CGH in 24 breast cancer samples. Breast cancer cell lines: A, KPL1; B, VP229; C, VP267; D, OCUB-F; E, 1OCUB-M; F, MTI; G, Matu; H, SUM149; I, SUM159; J, SUM185; K, SUM225; L, VP185; M, VP303; N, MT3; O, CAL51; P, MDA-MB157; Q, MDA-MB175; R, MCF7. Primary breast cancers: S, Brc 1; T, Brc2; U, Brc3; V, Brc4; W, Brc5; X, Brc6. Solid lines represent low-level amplification by metaphase CGH. Open squares represent regions of high-level amplification by metaphase CGH [fluorescence ratio (tumor/normal)>2.0]. Open circles indicate high copy amplification of target genes [fluorescence ratio (tumor/normal)>2.0]; filled circles, low amplification (<2.0).
Mechanisms underlying gene copy number change may include polyploidy or regional amplification. We compared array CGH results with data on ploidy obtained by 24-color FISH or centromeric FISH. In most cases, increase in gene copy number was independent of overall ploidy change. The architecture of amplification is complex and discontinuous, frequently involving several co-amplified genes. Amplification of the 11q13 region has been reported in breast cancer at ∼10%. 17 In this study we detected eight cases (∼30%) of regional amplification at 11q13. The array used includes CCND1, FGF4/FGF3, and EMS1, and three breast cancers revealed the same level of amplification for all three genes. In the other five cases only one gene in this region was significantly amplified. At 20q12-q13, another common amplicon, we analyzed six genes (AIB1, STK15, CSE1L, MYBL2, PTPN1, and ZNF217), and found 14 cancer specimens with regional amplification. Among these, significant gain of AIB1 was observed in two samples, CSE1L in two samples and ZNF217 in two samples. In recent reports 18,19 using array CGH two regions of amplification within a ∼2-Mb region of recurrent aberration at 20q13.2 in breast cancer were shown. The ZNF217 gene mapped to one peak, and CYP24 (encoding vitamin D 24 hydroxylase), whose overexpression is likely to lead to abrogation of growth control mediated by vitamin D, mapped to the other. The presence of differentially amplified genes raises the possibility that cells of certain tumors are susceptible to independent amplification events in these regional amplified sequences. Further analysis with locus-specific arrays in many cancer samples will bring more precise information about these regional amplifications.
Comparison of Array-CGH and Metaphase-CGH
CGH was developed for genome-wide analysis of DNA sequence copy number in a single experiment and has been broadly applied to human cancers. The use of metaphase chromosomes, however, limits detection of events involving small regions (<20 Mb) of the genome, resolution of closely spaced aberrations, and linking ratio changes to genomic/genetic markers. Several reports indicate that there is good correlation of data obtained by CGH (relative copy number of DNA sequence), with FISH (the number of copies of a specific DNA sequence in single nuclei), or flow cytometry (DNA content/index). 20,21 However these analyses were based on a limited number of data points (sample size and/or number of probes).
We compared in 24 breast cancer samples amplifications of 57 oncogenes detected by array CGH with data on chromosomal band amplification obtained by CGH Figure 5 ▶ ; the detailed amplicon profile of the 57 oncogenes and CGH data in Figure 4 ▶ are available on the internet. (http://www.cimr.cam.ac.uk/research/groups.htm). In most cases with amplicons detected by CGH there was a significant number with amplification of oncogenes known to be within the amplicon and represented in the microarray used (Table 1 ▶ , column b). It is not surprising the concordance is less than perfect because the true targets of several of the amplicons are not represented in the microarray used. Screening by metaphase CGH has proven to be highly useful for the first step of identification of candidate cancer-related genes, yet more sensitive techniques, such as locus or chromosome-specific arrays covering amplified regions may facilitate subsequent oncogene identification. 19 One would also predict that a proportion of oncogene amplifications detected by array CGH are not picked up by classical CGH. That is indeed the case (Table 1 ▶ , column c), with at least two genes identified to be amplified in a significant proportion of cases (PDGFRA/4q12 and MYB/6q22 in 21 and 30% of cases, respectively) and no amplicon of the corresponding chromosomal bands detected by classical CGH. Although further comparative analyses using more gene-specific loci are required, the techniques are complementary for some loci, such as 8q24 (MYC), 11q13, and 20q12q13.
Conclusion
In summary, the array CGH protocol here described and validated can be used to analyze microdissected material from both fresh and paraffin-embedded tumors by use of DOP-PCR. The amplicon profile obtained can yield valuable insights into the molecular events underlying breast carcinogenesis and might provide clues about clinical correlations, including response to treatment. Although further refinement will be required, in particular to detect deletions, DOP-PCR-based array CGH is a powerful and effective tool for amplification screening.
Acknowledgments
We thank Drs. J. Kurebayashi, H. M. McCallum, S. P. Ethier, T. Sawada, M. C. Bibby, and J. Gioanni for breast cancer cell lines; and Vysis Inc. UK for providing the array reader and CoSH DNA for array CGH optimization.
Footnotes
Address reprint requests to Carlos Caldas, Department of Oncology, University of Cambridge, Cambridge Institute for Medical Research, Wellcome Trust/MRC Building, BOX139, Addenbrooke’s Hospital, Hills Road, Cambridge CB2 2XY, UK. E-mail: cc234@cam.ac.uk.
Supported by The Cancer Research Campaign; the Uehara Memorial Foundation postdoctoral research fellowship (to Y. D.); and a Sackler Studentship, Overseas Research Studentship Award, and Cambridge Commonwealth Trust Prince of Wales Scholarship (to K. L. G.).
Y. D. and S.-F. C. contributed equally to this work.
References
- 1.DeRisi J, Penland L, Brown PO, Bittner ML, Meltzer PS, Ray M, Chen Y, Su YA, Trent JM: Use of a cDNA microarray to analyse gene expression patterns in human cancer. Nat Genet 1996, 14:457-460 [DOI] [PubMed] [Google Scholar]
- 2.Solinas-Toldo S, Lampel S, Stilgenbauer S, Nickolenko J, Benner A, Dohner H, Cremer T, Lichter P: Matrix-based comparative genomic hybridization: biochips to screen for genomic imbalances. Genes Chromosom Cancer 1997, 20:399-407 [PubMed] [Google Scholar]
- 3.Pinkel D, Segraves R, Sudar D, Clark S, Poole I, Kowbel D, Collins C, Kuo WL, Chen C, Zhai Y, Dairkee SH, Ljung BM, Gray JW, Albertson DG: High resolution analysis of DNA copy number variation using comparative genomic hybridization to microarrays. Nat Genet 1998, 20:207-211 [DOI] [PubMed] [Google Scholar]
- 4.Pollack JR, Perou CM, Alizadeh AA, Eisen MB, Pergamenschikov A, Williams CF, Jeffrey SS, Botstein D, Brown PO: Genome-wide analysis of DNA copy-number changes using cDNA microarrays. Nat Genet 1999, 23:41-46 [DOI] [PubMed] [Google Scholar]
- 5.Kuukasjarvi T, Tanner M, Pennanen S, Karhu R, Visakorpi T, Isola J: Optimizing DOP-PCR for universal amplification of small DNA samples in comparative genomic hybridization. Genes Chromosom Cancer 1997, 18:94-101 [PubMed] [Google Scholar]
- 6.Aubele M, Mattis A, Zitzelsberger H, Walch A, Kremer M, Hutzler P, Hofler H, Werner M: Intratumoral heterogeneity in breast carcinoma revealed by laser-microdissection and comparative genomic hybridization. Cancer Genet Cytogenet 1999, 110:94-102 [DOI] [PubMed] [Google Scholar]
- 7.Emmert-Buck MR, Bonner RF, Smith PD, Chuaqui RF, Zhuang Z, Goldstein SR, Weiss RA, Liotta LA: Laser capture microdissection. Science 1996, 274:998-1001 [DOI] [PubMed] [Google Scholar]
- 8.Telenius H, Carter NP, Bebb CE, Nordenskjold M, Ponder BA, Tunnacliffe A: Degenerate oligonucleotide-primed PCR: general amplification of target DNA by a single degenerate primer. Genomics 1992, 13:718-725 [DOI] [PubMed] [Google Scholar]
- 9.Davidson JM, Gorringe KL, Chin S-F, Orsetti B, Besret C, Courtay-Cahen C, Roberts I, Theillet C, Caldas C, Edwards PAW: Molecular cytogenetic analysis of breast cancer cell lines. Br J Cancer 2000, 83:1309-1317 [DOI] [PMC free article] [PubMed] [Google Scholar]
- 10.Kallioniemi A, Kallioniemi OP, Sudar D, Rutovitz D, Gray JW, Waldman F, Pinkel D: Comparative genomic hybridization for molecular cytogenetic analysis of solid tumors. Science 1992, 258:818-821 [DOI] [PubMed] [Google Scholar]
- 11.Lehmann U, Glöckner S, Kleeberger W, Feist H, von Wasielewski R, Kreipe H: Detection of gene amplification in archival breast cancer specimens by laser-assisted microdissection and quantitative real-time polymerase chain reaction. Am J Pathol 2000, 156:1855-1864 [DOI] [PMC free article] [PubMed] [Google Scholar]
- 12.Visscher DW, Wallis T, Awussah S, Mohamed A, Crissman JD: Evaluation of MYC and chromosome 8 copy number in breast carcinoma by interphase cytogenetics. Genes Chromosom Cancer 1997, 18:1-7 [PubMed] [Google Scholar]
- 13.Schraml P, Kononen J, Bubendorf L, Moch H, Bissig H, Nocito A, Mihatsch MJ, Kallioniemi OP, Sauter G: Tissue microarrays for gene amplification surveys in many different tumor types. Clin Cancer Res 1999, 5:1966-1975 [PubMed] [Google Scholar]
- 14.Jimenez RE, Wallis T, Tabasczka P, Visscher DW: Determination of Her-2/Neu status in breast carcinoma: comparative analysis of immunohistochemistry and fluorescent in situ hybridization. Mod Pathol 2000, 13:37-45 [DOI] [PubMed] [Google Scholar]
- 15.Miyakis S, Sourvinos G, Spandidos DA: Differential expression and mutation of the ras family genes in human breast cancer. Biochem Biophys Res Commun 1998, 251:609-612 [DOI] [PubMed] [Google Scholar]
- 16.Rodenhuis S, van de Wetering ML, Mooi WJ, Evers SG, van Zandwijk N, Bos JL: Mutational activation of the K-RAS oncogene: a possible pathogenetic factor in adenocarcinoma of the lung. N Engl J Med 1987, 317:929-935 [DOI] [PubMed] [Google Scholar]
- 17.Bekri S, Adelaide J, Merscher S, Grosgeorge J, Caroli-Bosc F, Perucca-Lostanlen D, Kelley PM, Pebusque MJ, Theillet C, Birnbaum D, Gaudray P: Detailed map of a region commonly amplified at 11q13–>q14 in human breast carcinoma. Cytogenet Cell Genet 1997, 79:125-131 [DOI] [PubMed] [Google Scholar]
- 18.Savelieva E, Belair CD, Newton MA, DeVries S, Gray JW, Waldman F, Reznikoff CA: 20q gain associates with immortalization: 20q13.2 amplification correlates with genome instability in human papillomavirus. 16 E7 transformed human uroepithelial cells. Oncogene 1997, 14:551-560 [DOI] [PubMed] [Google Scholar]
- 19.Albertson DG, Ylstra B, Segraves R, Collins C, Dairkee SH, Kowbel D, Kuo WL, Gray JW, Pinkel D: Quantitative mapping of amplicon structure by array CGH identifies CYP24 as a candidate oncogene. Nat Genet 2000, 25:144-146 [DOI] [PubMed] [Google Scholar]
- 20.Mohapatra G, Moore DH, Kim DH, Grewal L, Hyun WC, Waldman FM, Pinkel D, Feuerstein BG: Analyses of brain tumor cell lines confirm a simple model of relationships among fluorescence in situ hybridization, DNA index, and comparative genomic hybridization. Genes Chromosom Cancer 1997, 20:311-319 [DOI] [PubMed] [Google Scholar]
- 21.Kallioniemi A, Visakorpi T, Karhu R, Pinkel D, Kallioniemi OP: Gene copy number analysis by fluorescence in situ hybridization and comparative genomic hybridization. Methods 1996, 9:113-121 [DOI] [PubMed] [Google Scholar]