

Abstract
The anatomical details of the biliary tree architecture of normal rats and rats in whom selective proliferation was induced by feeding α-naphthylisothiocyanate (ANIT) were reconstructed in three dimension using a microscopic-computed tomography scanner. The intrahepatic biliary tree was filled with a silicone polymer through the common bile duct and each liver lobe embedded in Bioplastic; specimens were then scanned by a microscopic-computed tomography scanner and modified Feldkamp cone beam backprojection algorithm applied to generate three-dimensional images. Quantitative analysis of bile duct geometry was performed using a customized software program. The diameter of the bile duct segments of normal and ANIT-fed rats progressively decreased with increasing length of the biliary tree. Diameter of bile ducts from ANIT-fed rats (range, 21 to 264 μm) was similar to that of normal rats (22 to 279 μm). In contrast, the number of bile duct segments along the major branch reproducibly doubled, the length of the bile duct segments decreased twofold, and the length of the biliary tree remained unchanged after ANIT feeding. Moreover, the total volume of the biliary tree of ANIT-fed rats was significantly greater (855 μl) than in normal rats (47 μl). Compared with normal rats, the total surface area of the biliary tree increased 26 times after ANIT-induced bile duct proliferation. Taken together, these observations quantitate the anatomical remodeling after selective cholangiocyte proliferation and strongly suggest that the proliferative process involves sprouting of new side branches. Our results may be relevant to the mechanisms by which ducts proliferate in response to hepatic injury and to the hypercholeresis that occurs after experimentally induced bile duct proliferation.
In recent years, it has become apparent that cholangiocytes, the epithelial cells that account for 3 to 5% of the liver cell population and that line the intrahepatic biliary system, are critically important epithelia. From a biological viewpoint, cholangiocytes participate in a variety of fundamental physiological processes of liver function. From a pathological viewpoint, they represent a primary target of a group of human disorders, the cholangiopathies, which include immune-mediated, infectious, genetic/developmental, neoplastic, and drug-induced, vascular and idiopathic conditions. For reasons that are not well understood, these conditions often preferentially involve specific portions or segments of the biliary tract. For example, primary biliary cirrhosis leads to destruction that is limited to interlobular bile ducts. In contrast, intrahepatic cholestasis induced by drugs seems to affect principally the cholangiocytes that line small bile ducts. 1-4 Although cholangiocyte functional and morphological heterogeneity, a concept that we developed, 5-8 likely contributes to the selective involvement of different portions of the biliary tree in the cholangiopathies, our understanding of the nature and mechanisms for normal and abnormal anatomical remodeling of the biliary tree is limited. To better define the heterogeneous nature of the human biliary tree, we 9 used a computer-aided three-dimensional imaging technique to present a quantitative anatomical study of the normal human biliary tree architecture.
In various forms of human liver diseases, including virtually all of the cholangiopathies, proliferation of cholangiocytes is a common pathological response. 1,3,10 Moreover, the rodent biliary tree undergoes selective proliferation in response to different experimental stimuli such as bile duct ligation, 6,8,11-14 70% hepatectomy, 15-17 CCl4 treatment, 18 and feeding of α-naphthylisothiocyanate (ANIT), a chemical substance the chronic administration of which produces a dose- and time-dependent cholangiocyte proliferative response in rats. 19-25 However, the anatomical basis for and the nature of the remodeling process of the biliary tract in response to these stimuli remain unclear.
The present study reports the analysis of the normal rat biliary tree and morphological alterations in its architecture associated with bile duct proliferation after ANIT feeding examined by three-dimensional X-ray microtomography (microCT). Reconstruction of the intrahepatic biliary system and quantitation of the biliary tree anatomy were accomplished using novel sophisticated computer software.
Materials and Methods
Animals
All experiments were performed on male Fisher 344 rats weighing 180 to 220 g. Rats were housed in a temperature-controlled room (22°C) with 12-hour light-dark cycles. Experiments were performed in two groups of animals. Group one (n = 3) consisted of control rats fed a normal laboratory chow diet. Group two (n = 3) consisted of rats fed a diet containing 0.1% ANIT (70 to 80 mg/kg body weight) for up to 28 days. The study was performed after approval by the Mayo Clinic Institutional Animal Care and Use Committee.
Specimen Preparation
Rats were anesthetized with pentobarbital (50 mg/kg body weight, i.p.). Through a midline abdominal incision, the common bile duct was isolated and cannulated above the pancreas with PE-10 intramedic polyethylene tubing. The portal vein was cannulated using a PE-50 tubing and blood flushed out with 0.9% sodium chloride. A low-viscosity, lead chromate-containing radiopaque liquid silicone polymer compound (MV-122; Flow Tech, Inc, Carver, MA) was then injected retrogradely through the common bile duct at a constant pressure of 10 to 14 mmHg controlled by a perfusion pump (Syringe Infusion Pump, 22; Harvard Apparatus) and pressure transducer (Recorder 2000; Gould Inc., Instruments System Division). Once the entire liver had uniformly become yellow, the common bile duct was ligated and the dead rat body placed under refrigeration at 4°C overnight to allow polymerization of compound. On the following day, the liver was resected, divided into individual lobes, and fixed in 10% buffered formalin. Each specimen was then transferred to a solution of glycerin in water with increasing concentrations from 30, 50, 75, and 100% to completely dehydrate the liver. The specimen was left for 24 hours in each solution, removed from 100% glycerin, and each liver lobe was then suspended in a thin-walled plastic cylinder and clear Bioplastic Liquid Casting Plastic (Aldon Corp Avon, NY) poured around for setting into a hard cylinder.
Scanning Procedure
The specimens were scanned by Mayo microCT scanner to provide the three-dimensional image of the intrahepatic biliary tree. The microCT scanner consists of a spectroscopic X-ray source, a fluorescent crystal plate, lens, and a charge-coupled device detector array.
Our microCT scanner uses a Philips spectroscopy X-ray tube with 12 mm × 0.4-mm line-focus focal spot. The specimen was mounted on a stack of computer-controlled precision stages. At the base of the stack is an inclination stage that is used to position a specimen’s rotation axis at right angles to the X-ray beam. On top of this stage is a linear translation stage with 0.1-μm resolution and 1.4-μm repeatability. On top of this stage is a rotation stage with 0.01° step size, 0.01° accuracy, and 0.001° resolution. On the top of the rotation stage is a Huber goniometer stage that allows the specimen to be placed in a symmetrical (or if desired, asymmetrical) position about the axis of rotation. The specimen was positioned close to the crystal plate and rotated in 721 equiangular steps around 360° between each X-ray exposure and its accompanying charge-couple device recording. The transmitted X-rays were converted to visible light by a fluorescent crystal plate. The light image generated within the crystal plate was transferred by the lens of a microscope objective onto the surface of a charge-coupled device camera. The charge of each pixel was digitized and stored as an array in a computer until all projections, at small increments of specimen rotation around 360°, have been acquired. The focus, rotation, and translation stages were controlled with a computer.
Image Reconstruction
The X-ray projection data covering the entire volume scanned were submitted to the reconstruction program. The modified Feldkamp cone-beam backprojection algorithm was applied to the recorded projection images to generate three-dimensional images of the intrahepatic biliary tree.
Analysis of the Reconstructed Image Data
The quantitative analysis of the three-dimensional images of the intrahepatic biliary tree was performed using a customized software program, Analyze, developed at Mayo (version 7.5; Biomedical Imaging Resource, Mayo Foundation, Rochester, MN). This program allowed computing, displaying, and analyzing orthogonal and oblique sections from the reconstructed volume images.
Volume rendering and maximum intensity projection were displayed at various angles of view and threshold voxel values. Average voxel size was 25 to 31 μm and images of up to 700 slices were rendered for each specimen. The measurement of cross-sectional area of the bile duct segments was made by use of brightness area product method as described by Block and colleagues. 26 The length of the bile duct segment was measured as a straight-line distance between bifurcations.
Measurements of the Biliary Tree Volume and Surface Area
The volume of each bile duct segment was calculated from volume = length × cross-sectional area. The surface area of each bile duct segment was given by surface area = 2 × length × root square (cross-sectional area × π).
Statistical Analysis
All values are expressed as mean ± SE as a result of pooling the data of all lobes together into one for the whole liver. Statistical analysis was performed by the Student’s t-test and results were considered statistically different at P < 0.05.
Results
Reconstructed Images of the Intrahepatic Biliary Tree
The brightest voxel projections of the three-dimensional images of the intrahepatic biliary tree of left lateral lobe from normal (Figure 1A) ▶ and ANIT-fed (Figure 1B) ▶ rats are viewed at 80° increments. Substantial differences in these two images are obvious. Visually, it would appear that the total biliary tree is markedly enlarged after ANIT feeding and that the number of individual bile ducts has increased. To more quantitatively assess these apparent differences, we used the segment-by-segment analysis of the intrahepatic biliary tree from normal and ANIT-fed rats.
Figure 1.
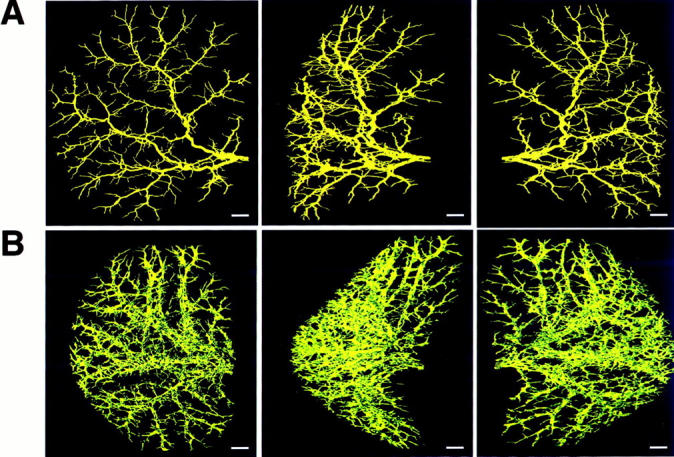
The brightest voxel projections of the three-dimensional microCT images of the intrahepatic biliary tree of the left lateral lobe of normal (A) and ANIT-fed (B) rats. Contrast agent for biliary tree visualization was injected into the common bile duct as described in detail in Materials and Methods. Both biliary trees are viewed at 80° increments. Scale bars, 1 mm.
Bile Duct Segments and Branching Orders
Quantitative analysis of the intrahepatic biliary tree involved the determination of its branching geometry. To accomplish segment-by-segment analysis, the major branch (ie, the longest branch of the intrahepatic biliary tree) was selected, manually traced, and divided into segments at each bifurcation branch point, allowing quantitation of both length and number of bile duct segments along the biliary tree. An example of such an analysis is shown for the normal biliary tree (Figure 2A) ▶ . We defined a bifurcation as the point along the biliary tree at which the bile duct divides and a segment as that part of the biliary tree between bifurcations (Figure 2B) ▶ . Thus, the number of segments equals the number of branching orders, which are numbered consecutively beginning at the largest bile duct and moving along the biliary tree axis to the smallest bile duct.
Figure 2.

Quantitative analysis of the intrahepatic biliary tree. A: An example for quantitative analysis is shown for the biliary tree of normal rat. The major branch of the biliary tree was selected, manually traced, and divided into segments at each branch point. Segments were numbered consecutively from 1 to 9 beginning at the largest bile duct and moving along the major branch to the smallest bile duct. B: Portion of the manually traced major branch. A bifurcation is defined as a point along the biliary tree at which the bile duct divides and a segment as that part of the biliary tree between bifurcations.
The number of bile duct segments along the major branch of the intrahepatic biliary tree was found to be significantly higher (P < 0.001) in ANIT-fed rats than in normal rats (Figure 3) ▶ . In normal rats, the biliary tree had 9 ± 2 bile duct segments along the major branch. In contrast, the number of bile duct segments after bile duct proliferation provoked by ANIT feeding reproducibly doubled (17 ± 3).
Figure 3.

The number of bile duct segments along the major branch of the intrahepatic biliary tree of normal and ANIT-fed rats. After bile duct proliferation induced by ANIT feeding, the number of bile duct segments was reproducibly doubled (P < 0.001).
Length of the Biliary Tree along the Major Branch
The length of the biliary tree was calculated as a sum of the length of individual bile duct segments along the major branch (Figure 4, A and B) ▶ . After bile duct proliferation induced by ANIT, the length of the intrahepatic biliary tree was not significantly different from the length of the biliary tree of normal rats (15.22 ± 0.86 mm versus 14.48 ± 0.77 mm).
Figure 4.

Length of the intrahepatic biliary tree along the major branch of normal and ANIT-fed rats. A: Length of the biliary tree was calculated as a sum of length of the individual bile duct segments along the major branch. After bile duct proliferation induced by ANIT, the biliary tree length was not different from the length of the biliary tree of normal rats. B: Representative traced major branch of the biliary tree of normal and ANIT-fed rats.
Length of the Individual Bile Duct Segments
The length of the individual bile duct segments was measured as a straight-line distance between bifurcations. The results of this analysis are shown in Figure 5 ▶ . The average length of the individual bile duct segments of the normal biliary tree was 1.61 ± 0.17 mm. These data suggest that the biliary tree under normal conditions undergoes a bifurcation approximately every 1 1/2-mm along the major branch. After induction of bile duct proliferation by ANIT, the average bile duct segment length decreased 1.8 times (0.90 ± 0.23 mm). The data indicate that the biliary tree from ANIT rats undergoes a bifurcation twice as often per unit length as the normal biliary tree.
Figure 5.

Length of the individual bile duct segments from normal and ANIT-fed rats. A: The length of the bile duct segments was measured as a straight-line distance between bifurcations. Bile duct segments from intrahepatic biliary tree of normal rats were two times longer than bile duct segments of ANIT-fed rats (P < 0.001). B: Representative individual bile duct segments from normal and ANIT-fed rats.
Diameter of Bile Duct Segments
The diameter of the defined bile duct segments was estimated from our three-dimensional reconstruction-based measurements. Diameter of bile duct segments along the major branch of the intrahepatic biliary tree of normal rats ranged from 22 μm to 279 μm (Figure 6A) ▶ . Our data showed that proliferating bile ducts from ANIT-fed rats have a diameter similar to that of normal rats. After ANIT feeding, the biliary tree was composed of bile duct segments that varied in diameter from 21 μm to 264 μm (Figure 6B) ▶ . As can be seen, the diameter of the bile duct segments from normal and ANIT-fed rats progressively decreased with increasing length of the biliary tree from the origin (ie, a point designated as first bile duct segment).
Figure 6.

Diameter of bile duct segments along the major branch of the intrahepatic biliary tree of normal (A) and ANIT-fed (B) rats. Diameters of the individual bile duct segment are shown versus length of the biliary tree along the major branch. Values are mean ± SE (P < 0.05). Note that proliferating bile ducts from ANIT-fed rats have a diameter similar to that of normal bile duct segments. C: Representative of the major branch of the intrahepatic biliary tree. With increasing length of the biliary tree diameter of bile duct segments becomes smaller.
Volumes and Surface Areas of the Individual Bile Duct Segments
We analyzed only major branch sequence and assumed that all segments at the same branching level in the other branch regions were of the same dimensions. Cumulative volumes and cumulative surface areas of all bile ducts of the same branching order were calculated by multiplying the calculated volume or surface area of each individual bile duct segment along the major branch, beginning from the origin, by 2, 4, 8, 16, and so forth, respectively.
Cumulative volumes and cumulative surface area of the individual bile duct segments at the defined branching level represents the sum of volumes or sum of surface areas of all bile ducts within this branching order (data not shown). These data were used for estimation of total volume and total surface area of the entire biliary system.
Total Volume and Total Surface Area of the Entire Biliary System
Total volume (Figure 7A) ▶ and total surface area (Figure 7B) ▶ of the entire biliary system were markedly enlarged in ANIT-fed rats. The total volume of the entire biliary system from normal rat liver was 46.97 ± 4.21 μl. After bile duct proliferation induced by ANIT, total volume of the entire biliary system significantly increased to 855.40 ± 42.69 μl (P < 0.001). After ANIT feeding, the total surface area of the entire intrahepatic biliary system was markedly evaluated (40,825.58 ± 8040.91 mm2) compared to normal rats (1563.66 ± 142.89 mm2, P < 0.001).
Figure 7.

Total volumes (A) and total surface areas (B) of the entire biliary tree from normal and ANIT-fed rats. Total volume and total surface area of the biliary tree after bile duct proliferation provoked by ANIT feeding was 18 and 26 times larger, respectively, than if seen in normal rats.
Discussion
Using a novel powerful imaging technique, we provide the first three-dimensional quantitative analysis of the normal rodent intrahepatic biliary tree as well as the corresponding alterations that occur in the biliary tree of rats with selective induction of cholangiocyte proliferation. By using this approach, we generated key biliary tract dimensions (length, duct diameter, surface area, volume) and described branching patterns (distance from the junction of intrahepatic ducts, number of bile duct branches) in normal and ANIT-fed rats. Based on our anatomical data, we have concluded that the proliferation of the biliary tree after ANIT feeding is associated with anatomical changes in the biliary architecture and results from sprouting of new duct side branches.
The normal intrahepatic biliary tree appears to be heterogeneous along the biliary tree axis with regard to the area of individual cholangiocytes and the diameter of the bile ducts. 3,6-8,16,27,28 Morphometric analysis has been performed in rats both in situ and in isolated intrahepatic bile duct units. Analysis of isolated intrahepatic bile duct units performed by us demonstrated that the diameters of bile ducts ranged in size from 10 to 433 μm. 5 Also, recent in situ morphometric studies from our group and other investigators have shown that the intrahepatic bile ducts of normal rats varied in size from 5 to 200 μm. 7,27,28 Several studies suggested that the diameters of the smallest intrahepatic bile ducts ranged from 5 μm to 20 μm. 5,7,8,16,27,28 Our observations are in agreement with these previously published data and demonstrate that the biliary tree of normal rats is composed of bile ducts of different luminal diameters (21 to 279 μm). We were able to determine the smaller bile duct with diameters of ∼21 μm; bile ducts smaller remained undetected because of the scanning resolution setup used.
It is of interest to compare the volume of the intrahepatic biliary tree of normal rats obtained in our study using three-dimensional imaging to the measurements of rat biliary tree volumes determined by totally different procedures. 29-31 The volume of the biliary tree measured by the volume of bile collected between the time of intravenous injection of sulfobromophthalein and the time at which its concentration in the bile reached one-half maximal excretion rate was 51 to 56 μl for livers weighing 10 g. 30,31 The other determination of biliary tree volume, which is based on production of mannitol transit time and mean bile flow, suggested that the biliary tree volume was ∼32 μl/10 g liver. 29 The only estimate of distended volume available is 121 μl for a 10-g liver. 30 In our study, the volume of the entire biliary system of the normal rat liver was 47 μl. Because the smallest bile ducts remained undetected because of the scanning resolution used in our study, the actual biliary tree volume may be somewhat greater. Having said that, our estimate is quite comparable to those obtained by these other methods.
It had been previously demonstrated in the rat that selective cholangiocyte proliferation induced by chronic biliary obstruction or by ANIT feeding is characterized by significant biliary tree volume enlargement. 11,13,14,24 Thus in rats obstructed for 7 days, the volume of biliary tree (functionally determined using [14C] taurocholate as a marker of biliary transit time) averaged 26.7 μl/g liver, an approximate ninefold greater than the value estimated in control rats (2.9 μl/g liver). 13 In rats with ductular cell hyperplasia induced by 14 days of extrahepatic biliary obstruction, biliary tree volume measured during taurocholate choleresis was 1071.9 μl/total liver, a value 33-fold higher than that obtained in controls (32.8 μl/total liver). 14 The results from ANIT-feeding studies indicated that during taurocholate choleresis, biliary tree volume in control rats was 2.99 μl/g liver. Twenty-eight days after rats were placed on an ANIT diet, the biliary tree volume was increased 20 to 22 times (58.89 μl/g liver) compared to control group. 24 In our study, the estimated volume of the entire biliary system after 28 days of ANIT feeding was 18-fold larger than volume of the biliary system from normal rat. Thus, our finding is quite similar to previous reports and indicates that increasing biliary tree volume reflects anatomical changes in increasing numbers of newly formed bile ducts after cholangiocyte proliferation provoked by ANIT feeding.
Examination of hepatobiliary function and liver morphology after ANIT treatment in the rat revealed that a single oral dose of ANIT results in hepatocanalicular dysfunction, involving damage to biliary epithelial cells. Biliary canaliculi become dilated with peak dilatation on the third day; by the sixth day after ANIT treatment, canalicular changes become less observable and biliary epithelial cell hyperplasia occurs. 19-22,32 Thus the pathogenesis of ANIT-induced cholestasis is biphasic; the onset of cholestasis is associated with changes in hepatocanalicular function, whereas bile duct epithelial cell proliferation follows later. 20,22,23 Continuous ANIT feeding is characterized by the development of time- and dose-dependent ductular hyperplasia. 21,24 Typical ductular hyperplasia produced by either ANIT feeding or common bile duct ligation results in cholangiocyte proliferation confined to the portal areas. In this type of hyperplasia, cholangiocytes maintain a normal cholangiocyte phenotype with formation of an organized network of well-defined tubular structures. 1,6,13,15
Although, bile duct proliferation under a variety of pathological and experimental conditions has been well described, the origin of the newly formed bile ducts and the type of anatomical remodeling that occurred is not yet clearly understood. The identity of the proliferating cell type responsible for bile duct epithelial cell hyperplasia is somewhat controversial with hepatocytes, putative stem cells, and the pre-existing biliary epithelium all being candidates. 12,13,22,23,33,34 A number of in situ and in vitro studies support the conclusion that after bile duct ligation cholangiocytes most likely arise from different portions of the intrahepatic biliary tree and are morphologically and functionally similar to the subpopulation of cholangiocytes obtained from normal rat liver and do not acquire phenotypes of hepatocyte lineage. 14,22,24,33 Studies in the rat have shown that the pre-existing biliary epithelium is the source of proliferating bile duct cells and that bile duct cells divide regardless of the size of the duct in which they are located and form a system with a lumen continuous with the pre-existing one. Morphometric analysis, based on an increase in the number of duct profiles in histological section, confirmed that pre-existing ducts elongate in zigzag manner. 13
Because proliferation of the biliary tree induced by bile duct ligation is known to result from elongation of the pre-existing biliary epithelium, we suggested that the proliferation of the biliary tree in response to ANIT feeding can occur by at least two different types of anatomical remodeling: by sprouting of the side branches of the biliary tree, or by elongation in zigzag manner of the pre-existing bile ducts, as had been described in bile duct ligated rats, 13 and as schematically illustrated in Figure 8 ▶ .
Figure 8.

Schematic representation of two different types of anatomical remodeling after selective cholangiocyte proliferation induced by ANIT. Under normal conditions, biliary tree regularly branches every 1.5 mm along its main course. After ANIT feeding proliferation of bile duct may occur by sprouting of new side branches or by elongation of the pre-existing bile duct. (Newly formed bile ducts are shown in blue). Proliferation of bile ducts is associated with anatomical alterations in biliary tree architecture. By analysis of these changes, we concluded that biliary tree proliferation results from sprouting of new side branches.
To clarify this issue, we examined changes seen after ANIT feeding that included: 1) length of the biliary tree, 2) length of the bile duct segments, 3) number of bile duct segments along the major branch of the biliary tree, 4) total volume of the biliary system, and 5) total surface area of the biliary system. If elongation of the pre-existing bile ducts took place after ANIT feeding, we should have observed an increase in the length of the biliary tree and in the length between branches. If, on the other hand, proliferation of the biliary tree results from sprouting of new side branches, we should have observed no change in the length of the biliary tree, a decrease in the distance between ductal branches, and an increase in the number of branches. In either scenario, the total volume and total surface area of the biliary system should each increase.
Our three-dimensional quantitative assessment of the resulting anatomical remodeling after ANIT feeding strongly suggests that the proliferative process involves sprouting rather than elongation. This conclusion is based on the following observations. First, after bile duct proliferation induced by ANIT, the length of the bile duct segments decreased twofold. Second, ANIT feeding led to an increase in the number of bile duct segments along the major branch. Third, the length of the biliary tree did not change after ANIT feeding. Taken together, this observation supports our conclusion that proliferation of the biliary tree after ANIT feeding results from sprouting of new side branches not from elongation of the existing biliary tree.
Three-dimensional reconstructive imaging of the biliary tree after ANIT feeding allowed us to determine that the newly formed bile ducts originate from the existing biliary system, remaining connected with the pre-existing network. This observation has physiological implications with regard to ductal bile secretion; ie, it is consistent with the known increase in basal and hormone-induced ductal bile secretion that occurs after cholangiocyte proliferation. 1,6,13,14,24 Cessation of ANIT feeding leads to a decrease in secretory and proliferative processes of small and large cholangiocytes, which decline to control values 28 days later. Gradual regression in cholangiocyte proliferation and secretion was associated with an increase of cholangiocytes apoptosis. 25 This observation is in agreement with previous reports showing that regression of cholangiocyte hyperplasia after removal of the proliferative stimulus may occur through apoptosis. 35
A number of studies provide strong evidence that there are different proliferative segments along the length of the biliary tree that specifically respond to various stimuli. For example, it has been shown that the proliferative compartment for cholangiocytes after bile duct ligation is present principally in large cholangiocytes that line large bile ducts. Small cholangiocytes apparently do not proliferate after bile duct ligation and do not respond physiologically in this hyperplastic model. 6,8,28 In contrast, when cholangiocyte hyperplasia was induced by acute exposure to CCl4, the loss of proliferative capacity of large cholangiocytes damaged after treatment was compensated by proliferation of small cholangiocytes. Two days after CCl4 administration there was an increased number of small ducts but a reduction in large ducts. 18 Both large and small cholangiocytes during the regrowth of the intrahepatic biliary tree after 70% hepatectomy were involved in proliferative processes. 17 Examination of cholangiocyte growth assessed in situ by morphometry of the number of small and large cholangiocytes and by assessment of H3 histone and proliferating cell nuclear antigen mRNA expression in small and large cholangiocytes revealed that both proliferate in response to ANIT feeding. 25 The results from our investigation based on anatomical analysis of the intrahepatic biliary tree confirmed that all segments of the biliary tree are involved in the process of proliferation induced by ANIT.
Molecular and functional studies taken together with our anatomical data suggest that all cholangiocytes have the capacity to proliferate but, depending on the nature of the stimulus, different compartments of the biliary tree may be involved in the process. Little information exists on the mechanisms by which specific segments of the intrahepatic biliary tree proliferate in response to certain stimuli. Because the biliary tree is heterogeneous along its longitudinal axis with regard not only to the size of bile ducts but also to the localization, distribution and expression of proteins, transporters, receptors, exchangers and channels, we proposed, based on this diversity, that the proliferative plasticity of cholangiocytes in response to various stimuli may be related not only to the nature of the stimulus but also to the heterogeneity of distributed proteins along the length of the biliary tree.
In summary, microCT is a novel technique that allows three-dimensional views of the entire biliary tree. The diameter of the intrahepatic bile ducts, their volumes and surface areas, the length of the bile duct segments, and the length of the entire biliary tree can all be measured using this method. Our careful anatomical characterization of the biliary tree in quantitative terms in the basal and proliferative states has provided novel information on the functional capacity and elasticity of the biliary tree and on the mechanism and sites of origin of the cholangiocyte proliferation after ANIT feeding.
Footnotes
Address reprint requests to Nicholas F. LaRusso, M.D., Center for Basic Research in Digestive Diseases, Mayo Medical School, Clinic, and Foundation, 200 First St., SW, Rochester, MN 55905. larusso. nicholas@mayo.edu.
Supported by the National Institutes of Health grants DK24031 (to N. F. L.) and RR11800 (to E. L. R.), and by the Mayo Foundation.
References
- 1.LaRusso NF: Morphology, physiology and biochemistry of biliary epithelia. Toxicol Pathol 1996, 24:84-89 [DOI] [PubMed] [Google Scholar]
- 2.Roberts SK, Ludwig J, LaRusso NF: The pathobiology of biliary epithelia. Gastroenterology 1997, 112:269-279 [DOI] [PubMed] [Google Scholar]
- 3.Alpini G, Phillips JO, LaRusso NF: The biology of biliary epithelia. Arias IM Boyer JL Fausto N Jakoby WB Schachter DA Shafritz DA eds. The Liver: Biology and Pathobiology. 1994, :pp 623-653 Ltd., New York, Raven Press [Google Scholar]
- 4.Birnbaum A, Suchy FJ: The intrahepatic cholangiopathies. Semin Liver Dis 1998, 18:263-269 [DOI] [PubMed] [Google Scholar]
- 5.Roberts SK, Kuntz SM, Gores GJ, LaRusso NF: Regulation of bicarbonate-dependent ductular bile secretion assessed by lumenal micropuncture of isolated rodent intrahepatic bile ducts. Proc Natl Acad Sci USA 1993, 90:9080-9084 [DOI] [PMC free article] [PubMed] [Google Scholar]
- 6.Alpini G, Ulrich C, Roberts S, Phillips JO, Ueno Y, Podila PV, Colegio O, LeSage GD, Miller LJ, LaRusso NF: Molecular and functional heterogeneity of cholangiocytes from rat liver after bile duct ligation. Am J Physiol 1997, 272:G289-G297 [DOI] [PubMed] [Google Scholar]
- 7.Alpini G, Roberts S, Kuntz SM, Ueno Y, Gubba S, Podila PV, LeSage G, LaRusso NF: Morphological, molecular and functional heterogeneity of cholangiocytes from normal rat liver. Gastroenterology 1996, 110:1636-1643 [DOI] [PubMed] [Google Scholar]
- 8.Alpini G, Glaser SS, Ueno Y, Pham L, Podila PV, Caligiuri A, LeSage G, LaRusso NF: Heterogeneity of the proliferative capacity of rat cholangiocytes after bile duct ligation. Am J Physiol 1998, 274:G767-G775 [DOI] [PubMed] [Google Scholar]
- 9.Ludwig J, Ritman EL, LaRusso NF, Sheedy PF, Zumpe G: Anatomy of the human biliary system studied by quantitative computer-aided three-dimensional imaging techniques. Hepatology 1998, 27:893-899 [DOI] [PubMed] [Google Scholar]
- 10.Thung SN: The development of proliferating ductular structures in liver disease. Arch Pathol Lab Med 1990, 114:407-411 [PubMed] [Google Scholar]
- 11.Gall JAM, Bhathal PS: A quantitative analysis of the liver following ligation of common bile duct. Liver 1990, 10:116-125 [DOI] [PubMed] [Google Scholar]
- 12.Marucci L, Baroni GS, Mancini R, Benedetti A, Jezequel AM, Orlandi F: Cell proliferation following extrahepatic biliary obstruction: evaluation by immunohistochemical methods. J Hepatol 1993, 17:163-169 [DOI] [PubMed] [Google Scholar]
- 13.Slott PA, Liu MH, Tavoloni N: Origin, pattern and mechanism of bile duct proliferation following biliary obstruction in the rat. Gastroenterology 1990, 99:466-477 [DOI] [PubMed] [Google Scholar]
- 14.Alpini G, Lenzi R, Sarkozi L, Tavoloni N: Biliary physiology in rats with bile ductular cell hyperplasia: evidence for a secretory function of proliferated bile ductules. J Clin Invest 1988, 81:569-578 [DOI] [PMC free article] [PubMed] [Google Scholar]
- 15.LeSage G, Glaser SS, Gubba S, Robertson WE, Phinizy JL, Lasater J, Rodgers RED, Alpini G: Regrowth of the rat biliary tree after 70% partial hepatectomy is coupled to increased secretin-induced ductal secretion. Gastroenterology 1996, 111:1633-1644 [DOI] [PubMed] [Google Scholar]
- 16.Kanno N, LeSage G, Glazer S, Alvaro D, Alpini G: Functional heterogeneity of the intrahepatic biliary epithelium. Hepatology 2000, 31:555-561 [DOI] [PubMed] [Google Scholar]
- 17.LeSage G, Glaser SS, Robertson W, Phinizy JL, Rodgers R, Alpini G: 70% partial hepatectomy induces proliferative and secretory events in small cholangiocytes. Gastroenterology 1996, 110:A1250 [Google Scholar]
- 18.LeSage G, Benedetti A, Glaser S, Marucci L, Tretjak Z, Caligiuri A, Rodgers R, Phinizy JL, Baiocchi L, Francis H, Lasater J, Ugili L, Alpini G: Acute carbon tetrachloride feeding selectively damages large, but not small, cholangiocytes from normal rat liver. Hepatology 1999, 29:307-319 [DOI] [PubMed] [Google Scholar]
- 19.Desmet VJ, Krstulovic B, van Damme B: Histochemical study of rat liver in alpha-naphthylisothiocyanate (ANIT) induced cholestasis. Am J Pathol 1968, 52:401-421 [PMC free article] [PubMed] [Google Scholar]
- 20.Plaa GL, Priestly BG: Intrahepatic cholestasis induced by drugs and chemicals. Pharmacol Rev 1977, 28:207-273 [PubMed] [Google Scholar]
- 21.Leonard TB, Popp JA, Graichen ME, Dent JG: α−Naphthylisothiocyanate induced alterations in hepatic drug metabolizing enzymes and liver morphology: implications concerning anticarcinogenesis. Carcinogenesis 1981, 6:473-482 [DOI] [PubMed] [Google Scholar]
- 22.Kossor DC, Goldstein RS, Ngo W, DeNicola DB, Leonard TB, Dulik DM, Meunier PC: Biliary epithelial cell proliferation following α-naphthylisothiocyanate (ANIT) treatment: relationship to bile duct obstruction. Fundam Appl Toxicol 1995, 26:51-62 [DOI] [PubMed] [Google Scholar]
- 23.Kossor DC, Meunier PC, Dulik DM, Leonard TB, Goldstein RS: Bile duct obstruction is not a prerequisite for type I biliary epithelial cell hyperplasia. Toxicol Appl Pharmacol 1998, 152:327-338 [DOI] [PubMed] [Google Scholar]
- 24.Alpini G, Lenzi R, Zhai WR, Slott PA, Liu MH, Sarcozi L, Tavoloni N: Bile secretory function of intrahepatic biliary epithelium in the rat. Am J Physiol 1989, 257:G124-G133 [DOI] [PubMed] [Google Scholar]
- 25.Glaser S, Francis H, Baiocchi L, Phinizy J, Rodgers R, Eisel W, LeSage G, Alpini G: Regression of cholangiocyte growth and secretion of small and large bile ducts following cessation of 1-naphtylisothiocyanate (ANIT) feeding is associated with increased cholangiocyte apoptosis. Hepatology 1998, 28:431A [Google Scholar]
- 26.Block M, Liu YH, Harris LD, Robb RA, Ritman EL: Quantitative analysis of a vascular tree model with the dynamic spatial reconstructor. J Comput Assist Tomogr 1984, 8:390-398 [DOI] [PubMed] [Google Scholar]
- 27.Benedetti A, Bassotti C, Rapino K, Marucci L, Jezequel AM: A morphometric study of the epithelium lining the rat intrahepatic biliary tree. J Hepatology 1996, 24:335-342 [DOI] [PubMed] [Google Scholar]
- 28.Alpini G, Glaser S, Robertson W, Rodgers RED, Phinizy JL, Lasater J, LeSage GD: Large but not small intrahepatic bile ducts are involved in secretin-regulated ductal bile secretion. Am J Physiol 1997, 272:G1064-G1074 [DOI] [PubMed] [Google Scholar]
- 29.Forker EL: Hepatocellular uptake of inulin, sucrose, and mannitol in rats. Am J Physiol 1970, 219:1568-1573 [DOI] [PubMed] [Google Scholar]
- 30.Barber-Riley G: Measurement of capacity of biliary tree in rats. Am J Physiol 1963, 205:1122-1126 [DOI] [PubMed] [Google Scholar]
- 31.Dammann HG: Determination of the biliary tree capacity of the rat in its distended and nondistended state using 35 S-sulfobromophtalein glutathione (35 S-BSP-GSH) as a marker. J Physiol 1977, 73:37-46 [PubMed] [Google Scholar]
- 32.Connolly AK, Price SC, Connelly JC, Hinton RH: Early changes in bile duct lining cells and hepatocytes in rats treated with α-naphthylisothiocyanate. Toxicol Appl Pharmacol 1988, 93:208-219 [DOI] [PubMed] [Google Scholar]
- 33.Gall JAM, Bhathal PS: Origin and involution of hyperplastic bile ductules following total biliary obstruction. Liver 1990, 10:106-115 [DOI] [PubMed] [Google Scholar]
- 34.Sirica AE, Gainey TW, Mutaw VR: Ductular hepatocytes: evidence for a bile ductular cell origin in furan-treated rats. Am J Pathol 1994, 145:375-383 [PMC free article] [PubMed] [Google Scholar]
- 35.Bhathal PS, Gall JAM: Deletion of hyperplastic biliary epithelial cells by apoptosis following removal of the proliferative stimulus. Liver 1985, 5:311-325 [DOI] [PubMed] [Google Scholar]