Abstract
Anaerobic mitochondrial metabolism of α-ketoglutarate and aspartate or α-ketoglutarate and malate can prevent and reverse severe mitochondrial dysfunction during reoxygenation after 60 minutes of hypoxia in kidney proximal tubules. 34 The present studies demonstrate that, during hypoxia, paxillin, focal adhesion kinase, and p130cas migrated faster by sodium dodecyl sulfate-polyacrylamide gel electrophoresis, their phosphotyrosine (pY) content decreased to ∼5% of that in oxygenated tubules without changes in total protein, and the normally basal immunostaining of β1 and α6 integrin subunits, pY, and paxillin was lost or markedly decreased. During reoxygenation without supplemental substrates, recovery of pY and basal localization of the focal adhesion proteins was poor. α-Ketoglutarate and aspartate, which maintained slightly higher levels of ATP during hypoxia, also maintained 2.5-fold higher levels of pY during this period, and promoted full recovery of pY content and basal localization of focal adhesion proteins during subsequent reoxygenation. Similarly complete recovery was made possible by provision of α-ketoglutarate and aspartate or α-ketoglutarate and malate only during reoxygenation. These data emphasize the importance of very low energy thresholds for maintaining the integrity of key structural and biochemical components required for cellular survival and reaffirm the value of approaches aimed at conserving or generating energy in cells injured by hypoxia or ischemia.
Ischemic and related forms of acute renal failure result from a complex interplay of vascular and tubular events that can vary in their relative contributions depending on characteristics of the specific clinical situation or experimental model. Although the process is frequently also termed acute tubular necrosis, much of the tubule cell damage in both animal models and human acute renal failure is sublethal and reversible within affected cells. 1-6 Effects on multiple subcellular structures have been described including loss of brush border microvilli and simplification of the basolateral membrane, 1-3 disruption of the normal polar distribution of major membrane-associated proteins including Na+,K+-ATPase and its associated cytoskeletal proteins, 7,8 disruption of tight junctions and adherens junctions, 5,9-13 and abnormalities of integrin distribution and function, 14-19 all of which can contribute to impaired barrier function and vectorial transport by the epithelium. ATP depletion and the resulting protein dephosphorylation 10-13,20,21 are the primary processes initiating these events.
Proximal tubules have relatively little or no glycolytic capacity making them dependent on mitochondrial metabolism for ATP synthesis. 22,23 Freshly isolated proximal tubules rapidly develop lethal damage when subjected to hypoxia or other ATP-depleting maneuvers, 24-27 which has limited their utility for studying reversible structural and metabolic alterations. This situation has improved with recognition that much of their sensitivity is because of the formation of pathological plasma membrane pores that can be blocked by glycine at physiological levels. 28,29 By suppressing this type of plasma membrane damage, replacement of glycine allows examination of specific injury mechanisms in vitro, uncomplicated by the plethora of postmortem degenerative changes that would otherwise occur in multiple cellular systems. 30-32 We have found that, despite glycine cytoprotection, freshly isolated, kidney proximal tubule cells develop a profound mitochondrial functional deficit during hypoxia/reoxygenation that is characterized by incomplete recovery of energization during reoxygenation, impaired respiration for substrates dependent on function of electron transport complex I, partial de-energization, and persistence of mitochondrial matrix condensation. 33-35 The mitochondrial lesion can be substantially ameliorated and recovery of cell ATP strikingly enhanced by supplementing the tubules with α-ketoglutarate plus aspartate (αKG/ASP), α-ketoglutarate plus malate (αKG/MAL), or other specific citric acid cycle metabolites during either hypoxia or reoxygenation. 34,35 The substrates promote mitochondrial pathways of anaerobic metabolism to increase ATP production by substrate level phosphorylation and energization by anaerobic respiration in electron transport complexes I and II 34,35 and provide succinate to bypass the complex I block when aerobic metabolism resumes. 35
Two related observations in these initial studies 34,35 spurred us to further investigate the relationships between anaerobic ATP generated in mitochondria and its utilization by cells to effect repair and survival. First, we were struck by the relatively small yields of energy by anaerobic metabolism of mitochondrial substrates in proximal tubules as assessed by absolute levels of ATP attained during hypoxia, ie, increases from 4.3% of oxygenated control levels in tubules without protective substrates at the end of 60 minutes hypoxia to 6.9% with the substrates. 34 Second, we noted that the ability to perform complex-integrated functions was regained to a remarkable degree during reoxygenation of substrate supplemented hypoxic tubules as indicated by increases of ATP concentrations and respiratory rates. Similar degrees of recovery could be documented in tubules that had been provided with anaerobic mitochondrial substrates only during reoxygenation. 34,35 These observations suggest that the low levels of additional ATP generation during hypoxia or early reoxygenation made possible by the substrates were sufficient for utilization to maintain or repair structure by cells that were otherwise committed to continuing ATP depletion and a lethal outcome. 35
In the present studies we have assessed the impact of the tubule energetic deficit and its modification by protective substrates on the alterations of cytoskeletal and focal adhesion protein distribution and tyrosine phosphorylation during hypoxia/reoxygenation. Cellular interactions with the extracellular matrix are essential to maintain the integrity of signal transduction pathways that ensure survival. 36-38 Moreover, the phosphorylation states of these proteins could serve as indices of the availability of mitochondrially generated, anaerobic ATP at peripheral sites. The data provide evidence that ATP generated by the protective substrates during hypoxia is available in the cytosol and that the mitochondrial recovery promoted by the substrates during reoxygenation plays a pivotal role to enable a strikingly complete rephosphorylation of tyrosine-phosphorylated proteins and coordinated re-assembly of focal adhesions that is not otherwise achieved. They indicate a major effect of early energetic recovery on critical cell-matrix interactions and the potential for enhancing these interactions with specific citric acid cycle metabolites that optimize mitochondrial function.
Materials and Methods
Isolation of Tubules
Proximal tubules were prepared from kidney cortex of female New Zealand White rabbits (1.5 to 2.0 kg; Oakwood Farms, Oakwood, MI) by digestion with combinations of Worthington Type I (Worthington, Freehold, NJ) and Sigma blend type H or F collagenase and centrifugation on self-forming Percoll gradients as described. 28,30-32
Experimental Procedure
Incubation conditions generally followed our published protocols. 28,32,33 Tubules were suspended at 3.0 to 5.0 mg of tubule protein/ml in a 95% O2/5% CO2-gassed solution (medium A) containing (in mmol/L): 110 NaCl, 2.6 KCl, 25 NaHCO3, 2.4 KH2PO4, 1.25 CaCl2, 1.2 MgCl2, 1.2 MgSO4, 5 glucose, 4 sodium lactate, 0.3 alanine, 5.0 sodium butyrate, 3% dialyzed dextran (T-40, Pharmacia), and 2 glycine. Medium A was also supplemented with 0.5 mg/ml of bovine gelatin (75 bloom) to suppress aggregation of the isolated tubules during the prolonged experimental incubation periods. After 15 minutes of preincubation at 37°C, tubules were resuspended in fresh medium A with experimental agents as needed and regassed with either 95% O2/5% CO2 (controls) or 95% N2/5% CO2 (hypoxia). The bicarbonate concentration of medium A during hypoxia was decreased to maintain a pH of 6.9 to simulate tissue acidosis during ischemia in vivo. 33 After 60 minutes, samples were removed for analysis. The remaining tubules were washed twice to remove any experimental substrates being tested for their efficacy only during hypoxia and then resuspended in fresh 95% O2/5% CO2-gassed, pH 7.4 medium A with additional experimental substrates as needed. For the reoxygenation period, sodium butyrate in medium A was replaced with 2.0 mmol/L sodium heptanoate and, to maximize availability of purine precursors for ATP resynthesis, 250 μmol/L AMP or ATP was added in most experiments. 33 After 60 minutes of reoxygenation, samples were removed again for analysis. Cell ATP was measured and ultrastructural studies done as previously described. 32 Sampling and analysis for other parameters was as in the following sections.
Measurement of Changes in Mitochondrial Membrane Potential (ΔΨm)
For staining with the carbocyanine dye, 5,5′,6,6′-tetrachloro-1,1′,3,3′-tetraethylbenzimidazocarbocyanine iodide (JC-1; Molecular Probes, Eugene, OR), 34,35,39 an aliquot from a 1000× stock solution in dimethyl sulfoxide was mixed with an equal volume of serum, dispersed as an intermediate 100× stock solution in phosphate-buffered saline (PBS), and then added to a final concentration of 5 μg/ml in the tubule suspension at the end of the desired experimental period. The suspension was regassed with O2/CO2 and incubated in the dark for an additional 15 minutes at 37°C, then tubules were washed three times in an ice-cold solution containing (in mmol/L): 110 NaCl, 25 NaHEPES, pH 7.2, 1.25 CaCl2, 1.0 MgCl2, 1.0 KH2PO4, 3.5 KCl, 5.0 glycine, and 5% polyethylene glycol (average molecular weight 8000). A 300-μl aliquot of the washed tubules containing 1.2 to 1.5 mg of protein was brought up to 2.5 ml with additional ice cold wash solution and then scanned during continuous gentle stirring using a Photon Technology International (Monmouth Junction, NJ) Alphascan fluorometer at 488 nm excitation/500 to 620 nm emission. Under these conditions, the peak of the green fluorescence of the monomeric form of the dye was at 530 nm and the red fluorescence of the J-aggregates peaked at 590 nm.
Immunoblotting
Tubules were pelleted, then dispersed in ice-cold, 10.0 mmol/L sodium imidazole, pH 7.15, 10 mmol/L sodium-EGTA, 1.0% Triton X-100, 5.0 μg/ml leupeptin, 5.0 μg/ml pepstatin A, 5.0 μg/ml aprotinin, 1.0 mmol/L phenylmethyl sulfonyl fluoride (PMSF), 50 mmol/L sodium fluoride, 20 mmol/L β-glycerol phosphate, 1 mmol/L sodium orthovanadate, 12 μmol/L cyclosporine A (Calbiochem, San Diego, CA), and 12 nmol/L calyculin (Calbiochem). The protein was then immediately precipitated in four volumes of ice-cold methanol and dissolved in 2% sodium dodecyl sulfate/10% glycerol/0.125 mol/L Tris-HCl, pH 7.4, then stored at −80°C until analysis. To optimize detection of β1 integrin by immunoblotting, samples for it were collected by resuspending pelleted tubules in boiling 1% sodium dodecyl sulfate, 1 mmol/L sodium orthovanadate, 10 mmol/L Tris-HCl, pH 7.4, and boiled for 5 minutes. Protein concentrations were measured using bicinchoninic acid (Pierce, Rockford, IL) with bovine serum albumin as the standard.
For immunoblotting, samples were mixed 1:1 with a double-strength running buffer containing 0.12 mol/L Tris-HCl, pH 6.8, 4% sodium dodecyl sulfate, 20% glycerol, 0.01% bromophenol blue, and 2% β-mercaptoethanol, boiled for 5 minutes, run on precasted 4 to 12% gradient polyacrylamide gels (Novex, San Diego, CA), and then transferred onto nitrocellulose filters. For studies of β1 integrin, β-mercaptoethanol was omitted from the running buffer. Most proteins were immunodetected using mouse monoclonal antibodies (mAbs) as the primaries (usually 1 μg/ml) and peroxidase-conjugated goat anti-mouse (Pierce) as the secondary followed by chemiluminescence (ECL; Amersham, Arlington Heights, IL). Anti-pY mAbs were from either Upstate Biotechnology, Lake Placid, NY, (4G10), or Cell Signaling Technology, Beverly, MA, (P-Tyr-102, agarose-conjugated P-Tyr-100). mAbs to paxillin (clone 349), the 85-kd α-chain of PI-3-kinase (clone 4), focal adhesion kinase (clone 77), and p130cas (clone 21) were from Transduction Laboratories (Lexington, KY). mAb to the β1 integrin subunit was from Chemicon (LM534; Temecula, CA). Phosphorylation state-specific polyclonal rabbit antibodies to pY 31 and pY118 of paxillin and to pY397 of focal adhesion kinase were from Biosource International (Camarillo, CA). For the latter antibodies, the secondary was peroxidase-conjugated goat anti-rabbit (Pierce).
Immunoprecipitation
For immunoprecipitation of p130cas, samples of whole tubule suspension protein collected in boiling sodium dodecyl sulfate, as described above for β1 integrin immunoblotting, were diluted at least 10-fold to a final volume of 1 ml into immunoprecipitation buffer [1% Triton X-100, 150 mmol/L NaCl, 10 mmol/L Tris, pH 7.4, 1 mmol/L ethylenediaminetetraacetic acid (EDTA), 1 mmol/L EGTA, 120 μmol/L pervanadate, 1 mmol/L PMSF] containing protein A:agarose (preblocked with bovine serum albumin) and 5 μg of anti-p130cas (clone 21, Transduction Laboratories). After 90 minutes incubation at 4°C, 5 μg of rabbit anti-mouse IgG (Jackson Immunoresearch Labs, West Grove, PA) was added. After 30 additional minutes of incubation, the agarose beads were pelleted and washed three times with the immunoprecipitation buffer. The beads were then resuspended in single-strength running buffer as described above for immunoblotting. After boiling for 5 minutes, beads were pelleted and the supernatants were electrophoresed, transferred to nitrocellulose, and probed with the anti-pY mAb, P-Tyr-102, as described for immunoblotting. The membranes were then stripped and reprobed with the same anti-p130cas mAb that was used for the immunoprecipitation.
For immunoprecipitation with anti-pY, we used agarose-conjugated P-Tyr-100 according the manufacturer’s directions. Tubules were pelleted and resuspended in ice-cold lysis buffer consisting of 150 mmol/L NaCl, 20 mmol/L Tris, pH 7.5, 1 mmol/L EDTA, 1 mmol/L EGTA, 1% Triton X-100, 2.5 mmol/L sodium pyrophosphate, 1 mmol/L β-glycerophosphate, 120 μmol/L pervanadate, 1 μg/ml leupeptin, and 1 mmol/L PMSF. This suspension was sonicated four times for 5 seconds on ice, then centrifuged at 12,000 × g for 10 minutes. Samples of the supernatant were incubated overnight with the agarose-conjugated anti-pY. Then the beads were pelleted and processed further for immunoblotting as described for immunoprecipitation of p130cas. The membranes were initially probed with P-Tyr-102, then were stripped and reprobed with the anti-p130cas and anti-paxillin mAbs.
Immunostaining, Rhodamine Phalloidin Staining, and Confocal Microscopic Observations on Frozen Sections of Pelleted Tubules
Aliquots of tubule suspensions were pelleted and then fixed by resuspension in ice-cold 2% paraformaldehyde, 75 mmol/L lysine monohydrochloride, 10 mmol/L sodium periodate, 37 mmol/L sodium phosphate, pH 7.2, overnight. Then the samples were cryoprotected with 20% sucrose and frozen in liquid nitrogen. Frozen pellets were stored at −80°C until used. Cryosections of 6 μm thickness were cut on a Reichert-Jung Fridgocut-N 2800 cryostat and placed on glass slides precoated with 1% poly-l-lysine, then stored at −80°C until stained. For immunostaining, slides were rinsed in PBS, then permeabilized with 0.3% Triton X-100 in PBS for 4 minutes at room temperature. They were then dip washed for 2 minutes in PBS before 10 minutes room temperature blocking in a combination of 10% rabbit serum plus 10% goat serum (Jackson Immunoresearch Labs) in PBS. After another PBS wash, primary antibodies were applied for 60 minutes at room temperature in a humidified chamber. For pY (4G10), paxillin, and β1 integrin, we used the same antibodies as for immunoblotting. Immunostaining was also done with a mouse mAb to fodrin (mAb 1622, Chemicon) and a rat mAb to the α6 integrin subunit (GoH3, MCA699; Serotec, Raleigh, NC). After mAb exposure, slides were washed and cy3-conjugated goat anti-mouse or anti-rat IgG (Jackson Immunoresearch Labs) was applied at a 1:50 dilution in PBS, pH 7.2, as the secondary. After 60 minutes slides were rinsed with PBS and dried. Then the sections were overlaid with Prolong (Molecular Probes) and covered with glass coverslips. Other slides were stained with rhodamine phalloidin (Molecular Probes), 1:50 in PBS, by a parallel procedure omitting the treatments with goat and rabbit sera and antibodies. Slides were viewed at 100× (Nikon Plan Apochromat, NA 1.4) on a BioRad MRC 600 laser-scanning confocal microscope using a krypton/argon mixed gas laser and the YHS filter set, which contains a 568 DF10 excitor filter, 585 DRLP dichroic reflector, and 585 EFLP emission filter. Intensity settings for each sample set were kept constant relative to concurrently processed and viewed sections from control preparations. Images shown are representative of observations made on at least 10 to 12 tubules from each of three to five separate tubule preparations under each of the conditions illustrated.
Reagents
Reagents were from Sigma (St. Louis, MO) unless otherwise indicated and were of the highest grade commercially available. Agents solubilized in ethanol or dimethyl sulfoxide were delivered from ≥1000× stock solutions. Pervanadate was prepared fresh before each use by adding hydrogen peroxide in a 2:1 molar ratio to a 100× stock solution of sodium orthovanadate. 40,41 Addition of catalase to the pervanadate to quench excess hydrogen peroxide did not alter its effects on the tubules.
Statistics
Paired and unpaired t-tests were used as appropriate. Where experiments consisted of multiple groups they were analyzed statistically by analysis of variance for repeated measures or independent group designs as needed. Individual group comparisons for the multigroup studies were then made using the Neuman-Keuls test for multiple comparisons (SigmaStat; SPSS, Chicago, IL). P < 0.05 was considered to be statistically significant. The group sizes given indicate the numbers of separate tubule preparations studied.
Results
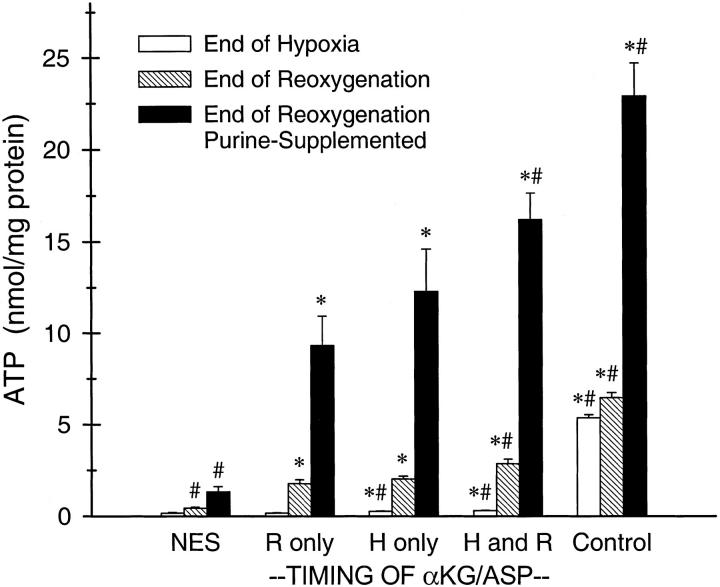
As we have observed previously, 33-35 tubules subjected to 60 minutes of hypoxia followed by 60 minutes of reoxygenation without extra protective substrates showed very poor recovery of cell ATP during reoxygenation, reaching <10% of the values of similarly incubated tubules that were kept oxygenated throughout, irrespective of the presence of supplemental purine in the medium (Figure 1) ▶ . Supplementation with αKG/ASP only during reoxygenation markedly improved ATP recovery as compared to tubules with no extra substrate (NES). αKG/ASP during only hypoxia tended to have an even greater beneficial effect, although the differences from the reoxygenation alone groups did not reach statistical significance. αKG/ASP during both hypoxia and reoxygenation had the strongest effect. Consistent with an action to promote anaerobic ATP production, 34,35 the measurements of end hypoxia ATP levels in the present studies showed that there was a significant effect of αKG/ASP during hypoxia to preserve ATP (0.16 ± 0.02 nmol/mg protein with NES versus 0.27 ± 0.02 nmol/mg protein with αKG/ASP, n = 10). As in our earlier work, 34,35 the magnitude of this difference was quite small relative to the concentrations of ATP in control oxygenated tubules incubated for the same duration (6.47 ± 0.3 nmol/mg protein).
Figure 1.
Prevention and reversal by αKG/ASP of the energetic deficit developing in tubules during hypoxia/reoxygenation. Tubules were subjected to 60 minutes hypoxia and 60 minutes reoxygenation with either no extra substrate (NES), or 4 mmol/L of α-ketoglutarate plus 4 mmol/L aspartate (αKG/ASP) during only reoxygenation (R), during only hypoxia (H), or during hypoxia and reoxygenation (H and R). Reoxygenation was studied both without and with supplemental exogenous purine (250 μmol/L ATP). Oxygenated control tubules were incubated for the same total durations as the corresponding hypoxia/reoxygenation groups. ATP was added to the medium of the purine-supplemented, oxygenated control group for the last 60 minutes of incubation. As in all studies, the incubation medium for all flasks contained glucose, lactate, alanine, and butyrate during both hypoxia and reoxygenation. Cell ATP levels sampled at the end of hypoxia and at the end of reoxygenation are means ± SE for n = 5. *, Significantly different from corresponding NES group; #, significantly different from corresponding “R only” group.
At the end of the reoxygenation period, normal appearing tubules were found in samples that were not substrate-supplemented (not shown), but cells in 60 to 80% of tubules incubated without extra protective substrates displayed irregularity and swelling of brush border microvilli, pale cytosol with increased vacuolization, and condensed mitochondria (Figure 2a) ▶ . In contrast, cells in 80 to 90% of tubules incubated during reoxygenation in the presence of αKG/ASP had a nearly normal appearance (Figure 2b) ▶ with the rest displaying changes similar to those seen in the unsupplemented tubules (not shown).
Figure 2.
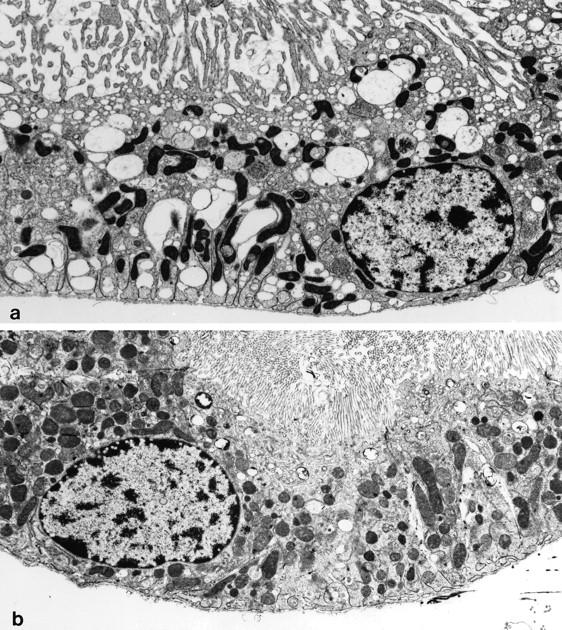
Ultrastructure of tubules subjected to hypoxia/reoxygenation without and with αKG/ASP. Tubules were subjected to 60 minutes of hypoxic incubation and 60 minutes of reoxygenation without (a) or with supplemental αKG/ASP only during reoxygenation (b). ATP was added to the medium during reoxygenation. Each picture is representative of observations that have been made on multiple tubule preparations. Original magnification, ×7000.
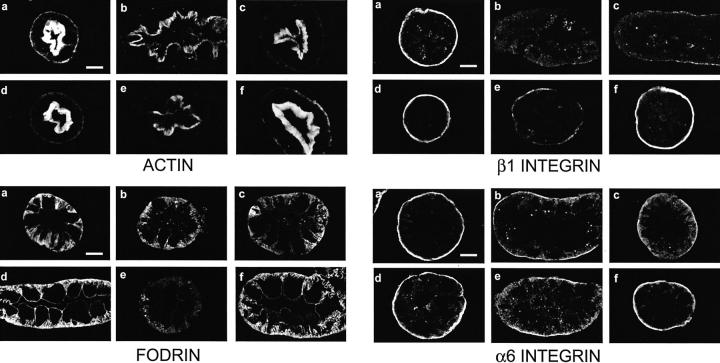
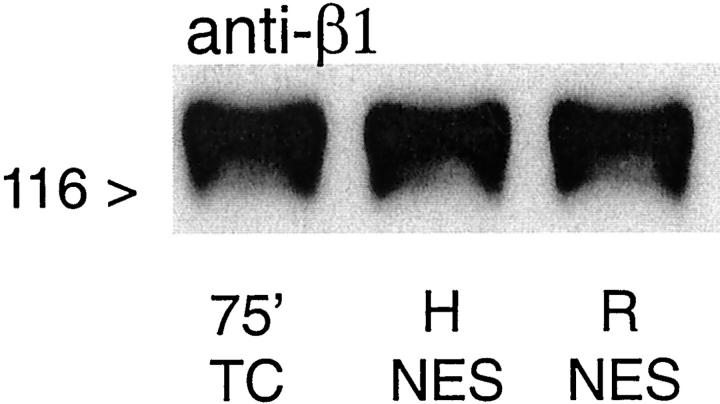
During hypoxia, microvillar and basal staining for F-actin with rhodamine phalloidin were decreased and immunostaining for fodrin was variably decreased and fragmented (Figure 3, b and c) ▶ as previously described. 31-33 Without extra protective substrates during hypoxia or reoxygenation, the majority of tubules showed little or no recovery at the end of reoxygenation (Figure 3e) ▶ . With addition of αKG/ASP during reoxygenation, most tubules recovered a normal appearance of F-actin and fodrin (Figure 3f) ▶ . The changes of basal F-actin were accompanied by marked alterations of the major proximal tubule integrin, α6β1. 42,43 Although total β1 detected by immunoblotting was unchanged (Figure 4) ▶ , the strong immunostaining for β1 at the basal membrane that was seen in oxygenated control tubules (Figure 3, a and d) ▶ nearly disappeared during hypoxia, without commensurate increases in other cellular compartments (Figure 3, b and c) ▶ . Basal staining for α6 was also decreased, but a stronger somewhat diffuse lateral component was evident (Figure 3, b and c) ▶ . As with actin and fodrin, there was minimal recovery of β1 and α6 during reoxygenation in most tubules incubated without extra substrate (Figure 3e) ▶ , but strong recovery in most tubules incubated with αKG/ASP (Figure 3f) ▶ . These observations indicate that restoration of normal localization of major tubule cytoskeletal and cell adhesion proteins was critically determined by the substrate-induced modification of energetic function.
Figure 3.
Cytoskeletal alterations during hypoxia/reoxygenation. Tubules were subjected to 60 minutes of hypoxic incubation followed by 60 minutes of reoxygenation without or with supplemental αKG/ASP only during reoxygenation. ATP was added to the medium during reoxygenation. Samples fixed in paraformaldehyde-lysine-periodate at the end of hypoxia or after hypoxia and reoxygenation were cryosectioned and stained for F-actin with rhodamine phalloidin or immunostained for fodrin, or the β1 or α6 integrin subunits. In each of the sets of images, a and d are oxygenated time controls corresponding to the ends of the 60-minute hypoxic and 60-minute hypoxia plus 60 minutes reoxygenation periods, respectively. b and c are representative of the range of changes seen in tubules at the end of the 60-minute hypoxic period. The e panels show representative tubules after hypoxia followed by reoxygenation with NES. The f panels are from the paired flasks that were also subjected to hypoxia and reoxygenation, but were supplemented with αKG/ASP during reoxygenation. Magnifications are the same in each panel; scale bars, 10 μm.
Figure 4.
Immunoblot for total β1 integrin. Tubules were incubated under oxygenated control conditions for 75 minutes (75′ TC), for 60 minutes of hypoxia, or 60 minutes of hypoxia and 60 minutes reoxygenation with NES during either during hypoxia or reoxygenation. H, sample taken at the end of 60 minutes hypoxia; R, sample taken after 60 minutes hypoxia followed by 60 minutes reoxygenation. ATP was added to the medium during reoxygenation.
The prominent alterations in basal membrane integrins and actin suggested that major changes had occurred in focal adhesions. 19,44-48 To further investigate this possibility and its relationship to alterations of protein phosphorylation during hypoxia/reoxygenation, we assessed the behavior of several tyrosine phosphorylated focal adhesion proteins. In controls (Figure 5A ▶ , lanes 1 and 8), the anti-pY mAb, 4G10, recognized multiple discrete bands, including particularly strong ones at 58 to 60 kd and 68 to 75 kd, the molecular masses, respectively, of the Src kinases 47,49 and paxillin, 50,51 and 120 to 130 kd, where focal adhesion kinase (FAK) and p130cas migrate. 45,52 Immunoblots with mAbs to p130cas, FAK, and paxillin confirmed their presence at the locations expected for their sizes (Figure 5 ▶ ; B, C, and E). The anti-paxillin mAb (Figure 5E) ▶ also recognized lower molecular weight forms of paxillin migrating at 50 to 55 kd as described in some other cell types. 50,51,53
Figure 5.
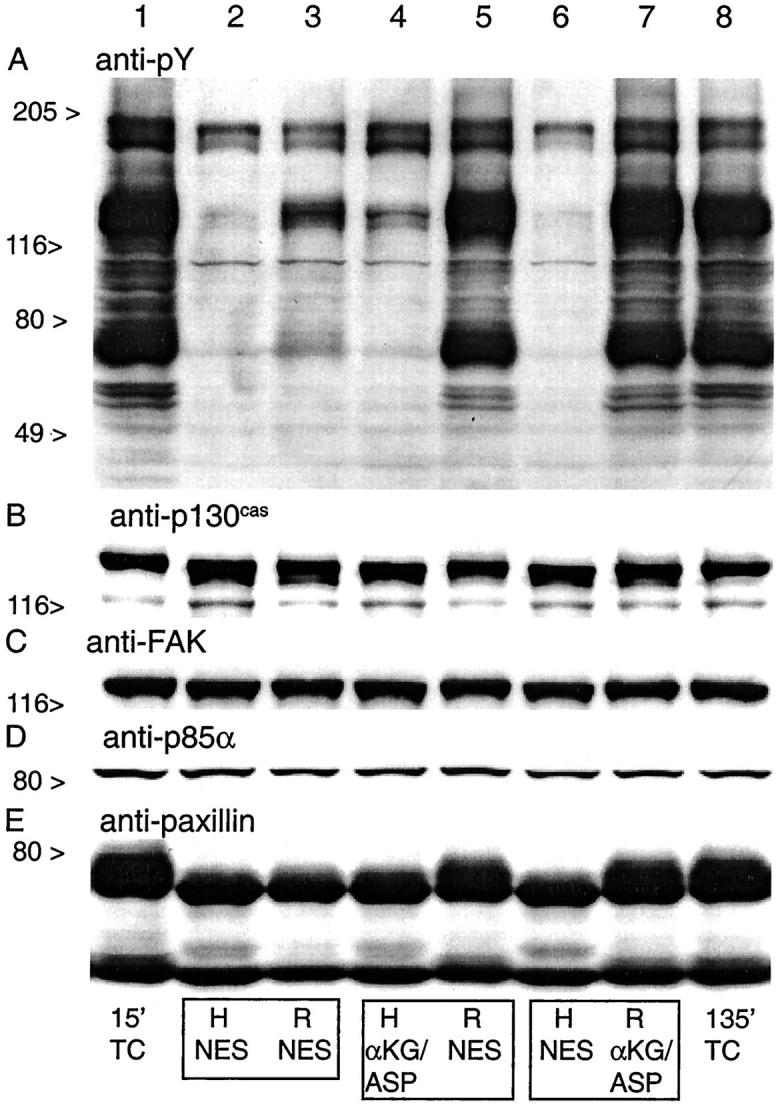
Tyrosine phosphorylation patterns of focal adhesion proteins during hypoxia/reoxygenation. These samples correspond to some of the conditions studied in Figure 1 ▶ and were taken from the same experiments. A to E: Western blots probed with the indicated mAbs of whole cell extracts from tubules subjected to 60 minutes of hypoxia and reoxygenation with either NES or αKG/ASP. pY, Phosphotyrosine; FAK, focal adhesion kinase; H, samples taken at the end of 60 minutes hypoxia; R, sample taken from the same flask as the H sample in the preceding lane enclosed in the same box, but obtained after 60 minutes of reoxygenation. αKG/ASP (4.0 mmol/L) was present during either only hypoxia (lane 4) or only reoxygenation (lane 7) as indicated; TC, oxygenated time-control tubules sampled after the indicated durations of incubation.
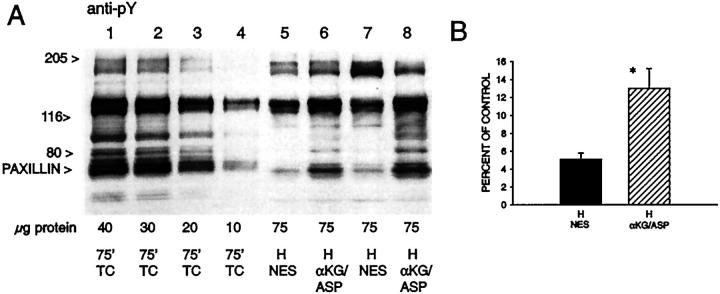
When sampled at the end of hypoxia with no extra protective substrates, the intensity of the 4G10 signal was markedly reduced in all bands, consistent with extensive dephosphorylation (Figure 5A ▶ , lanes 2 and 6). Total amounts of p130cas, FAK, and paxillin were unchanged (Figure 5 ▶ ; B, C, and E; lanes 2 and 6). Each of these proteins had a distinctly more rapid migration during hypoxia, as expected for the dephosphorylated state. This change was most clearly evident in the migration of paxillin, for which, as shown below, it was likely because of loss of both tyrosine and serine/threonine phosphorylation. Faster migration during hypoxia was not evident for a fourth tyrosine-phosphorylated protein that we assessed, the p85α chain of phosphatidylinositol-3-kinase (Figure 5D) ▶ . When αKG/ASP was present during hypoxia (Figure 5A ▶ , lane 4), tubules maintained slightly, but consistently higher 4G10 signals in several of the bands including those at 68 to 75 kd and 120 to 130 kd. We quantitated the changes in the 68 to 75 kd band (Figure 6) ▶ . During hypoxia with NES, the intensity of the signal fell to 5.1 ± 0.7% of control; with αKG/ASP, it was 13.0 ± 2.2% of control. Compared to samples from tubules with NES (Figure 5E ▶ , lanes 2 and 6), samples from the tubules treated with αKG/ASP during hypoxia (Figure 5E ▶ , lane 4) also showed slightly slower migration of paxillin, although it was still distinctly faster than migration of paxillin in the controls.
Figure 6.
Quantitation of changes of tyrosine phosphorylation during hypoxia. A: Representative scan as used for densitometry of phosphotyrosine (pY) immunoblots. The μg protein values given below each lane indicate the amount of sample protein run in that lane. Lanes 1 to 4 contain incremental amounts of the oxygenated time control (TC) sample. Lanes 5 to 8 are experimental samples taken at the end of 60 minutes of hypoxia (H) with either NES or 4.0 mmol/L αKG/ASP. Each end hypoxia sample is from a separate experiment. Larger amounts of protein were run in the hypoxia lanes to provide signals that are measurable against the most linear portion of the signal range of the control samples. B: Summary of densitometry analysis of the 68- to 75-kd band that corresponds to the location of paxillin. Values are means ± SE for n = 10. *, P < 0.05 versus hypoxia without αKG/ASP.
At 60 minutes reoxygenation of preparations incubated with NES during hypoxia or reoxygenation, recovery of pY and normal migration patterns of FAK, p130cas, and paxillin was poor (Figure 5A ▶ , lane 3). The presence of αKG/ASP during either only hypoxia or only reoxygenation restored the intensity of the 4G10 signal and the migration patterns of the three focal adhesion proteins measured at the end of reoxygenation to nearly normal (Figure 5 ▶ ; A, B, C, and E; lanes 5 and 7).
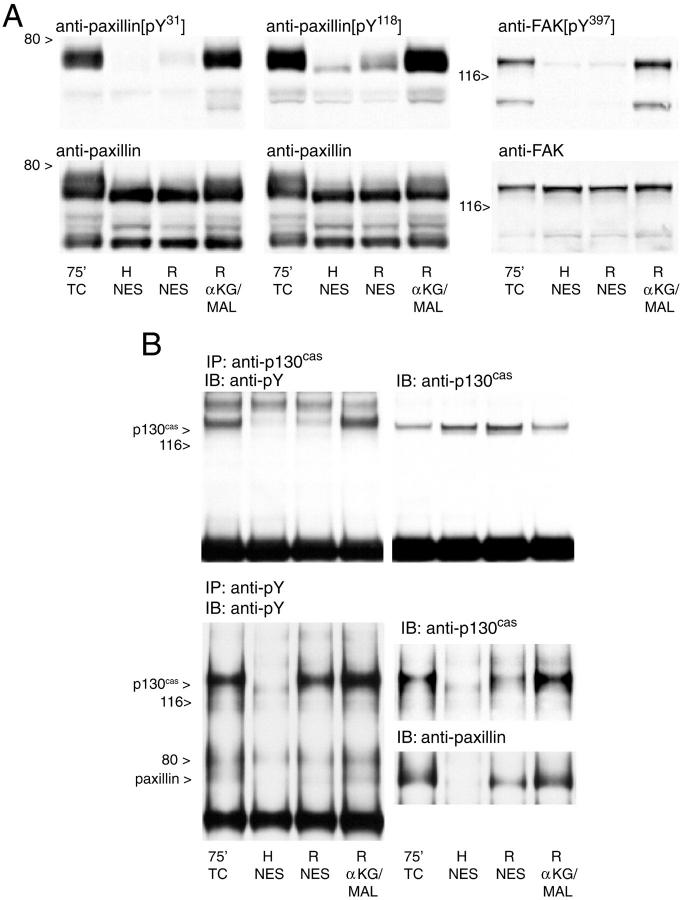
To further establish that the tyrosine phosphorylation changes occur in specific focal adhesion proteins, we used newly available phosphorylation state-specific antibodies to pY 31 and pY118 of paxillin and to pY397 of FAK as well as immunoprecipitation. As shown in Figure 7A ▶ , the phosphorylation of each of the three specific pYs was either markedly reduced or totally lost during hypoxia. For these studies, reoxygenation with NES was compared to reoxygenation in the presence of αKG/MAL, which has metabolic effects identical to those of αKG/ASP. 35 Phosphorylation of each of the pYs recovered poorly during reoxygenation with NES and strongly in paired flasks treated with αKG/MAL during reoxygenation. A similar protocol was followed for studies using immunoprecipitation with anti-p130cas or anti-pY (Figure 7B) ▶ . After immunoprecipitation with anti-p130cas, the pY signal from hypoxic tubules and tubules that were reoxygenated with NES was much reduced as compared to that of oxygenated controls and tubules reoxygenated with αKG/MAL. Recovery of both p130cas and paxillin in anti-pY immunoprecipitates was nearly absent in samples taken at the end of hypoxia and sharply reduced in tubules reoxygenated with NES as compared to oxygenated controls and tubules reoxygenated with αKG/MAL.
Figure 7.
Immunoblots with phosphorylation state-specific antibodies to paxillin and focal adhesion kinase and after immunoprecipitation with anti-p130cas or anti-pY. A: Western blots of total cell protein from tubules subjected to 60 minutes of hypoxia followed by 60 minutes of reoxygenation were probed with the indicated phosphorylation state-specific antibodies (top), then the membranes were reprobed (bottom) with the same antibodies used in Figure 5 ▶ , which recognize the proteins irrespective of their phosphorylation state. pY, phosphotyrosine; FAK, focal adhesion kinase; H, sample taken at the end of 60 minutes of hypoxia with NES; R, samples taken from the same flask as the H sample, but obtained after 60 minutes of reoxygenation with either NES or 4.0 mmol/L αKG/MAL; 75′ TC, oxygenated time control at 75 minutes of incubation. Blots shown are all for samples from the same experiment, which is representative of the results of four separate studies analyzed by this approach. B: Representative blots showing the results of: 1) immunoprecipitation (IP) with anti-p130cas followed by immunoblotting (IB) for pY, then p130cas; and 2) immunoprecipitation with anti-pY followed by immunoblotting for pY, then p130cas and paxillin. Experimental protocols and labeling are otherwise the same as for A.
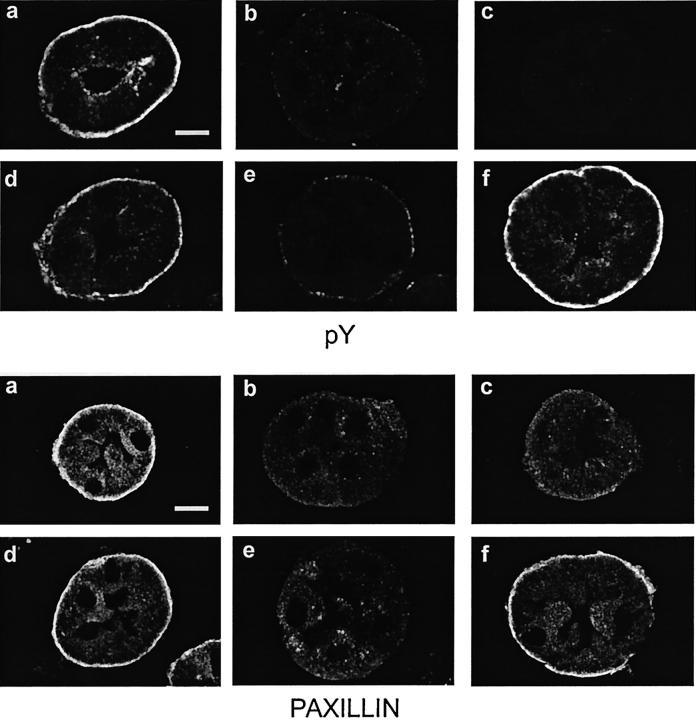
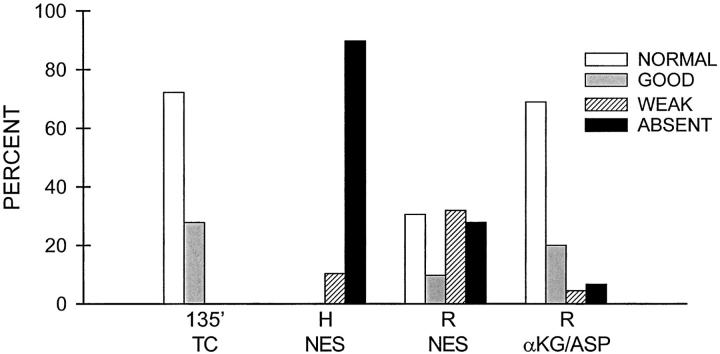
Consistent with the strong pY signals for focal adhesion proteins on the 4G10 immunoblots of control tubules (Figures 5A and 6A) ▶ ▶ , immunostaining for pY with 4G10, like that of paxillin, was concentrated at the basal membrane of oxygenated control tubules (Figure 8, a and d) ▶ . Paxillin staining in some cells was also seen in a supranuclear distribution, which likely reflects its presence in the Golgi apparatus as previously described. 54 Immunostaining for pY almost entirely disappeared during hypoxia (Figure 8, b and c) ▶ . It recovered poorly during reoxygenation in most tubules with NES during hypoxia or reoxygenation (Figure 8e) ▶ , but recovered strongly in most tubules supplemented with αKG/ASP during reoxygenation (Figure 8f) ▶ . Immunostaining for paxillin during hypoxia and reoxygenation followed a pattern similar to that of pY (Figure 8) ▶ . The pY immunostaining results for a series of these experiments are quantitated in Figure 9 ▶ , which shows that, with NES, two-thirds of tubules had weak or absent recovery of pY immunostaining. In the presence of αKG/ASP during reoxygenation, 90% had good or normal staining.
Figure 8.
Immunolocalization of pY and paxillin. Tubules were from the same experiments as illustrated in Figure 3 ▶ and the images are similarly organized. In each set, a and d are oxygenated time controls. b and c: Representative of the range of changes seen in tubules at the end of 60 minutes of hypoxia with NES. e: Representative tubules after hypoxia followed by reoxygenation with NES. f: Paired flasks that were also subjected to hypoxia and reoxygenation, but were supplemented with αKG/ASP during reoxygenation. Magnifications are the same in each panel; scale bars,10 μm.
Figure 9.
Quantitation of pY immunostaining intensity patterns during hypoxia/reoxygenation. Tubules were immunostained for pY as in Figure 8 ▶ after 135 minutes of oxygenated control incubation (135′ TC), 60 minutes hypoxia with no extra substrates (H NES), 60 minutes of hypoxia and 60 minutes of reoxygenation with no extra substrates (R NES), or 60 minutes hypoxia and 60 minutes of reoxygenation with αKG/ASP during reoxygenation (R αKG/ASP). Shown are the percentages of tubules with entirely normal, good, weak, or absent staining among a total of 40 to 70 tubules from three separate preparations that were examined for each condition. By these criteria, a and f of the pY-stained tubules in Figure 8 ▶ show normal tubules. d: A good tubule, which is a common finding under control conditions and is characterized by staining that is weaker or more irregular than the best tubules seen, usually because of the angle of sectioning. b and e: Tubules with weak staining. Staining would be classified as absent for the tubule in c.
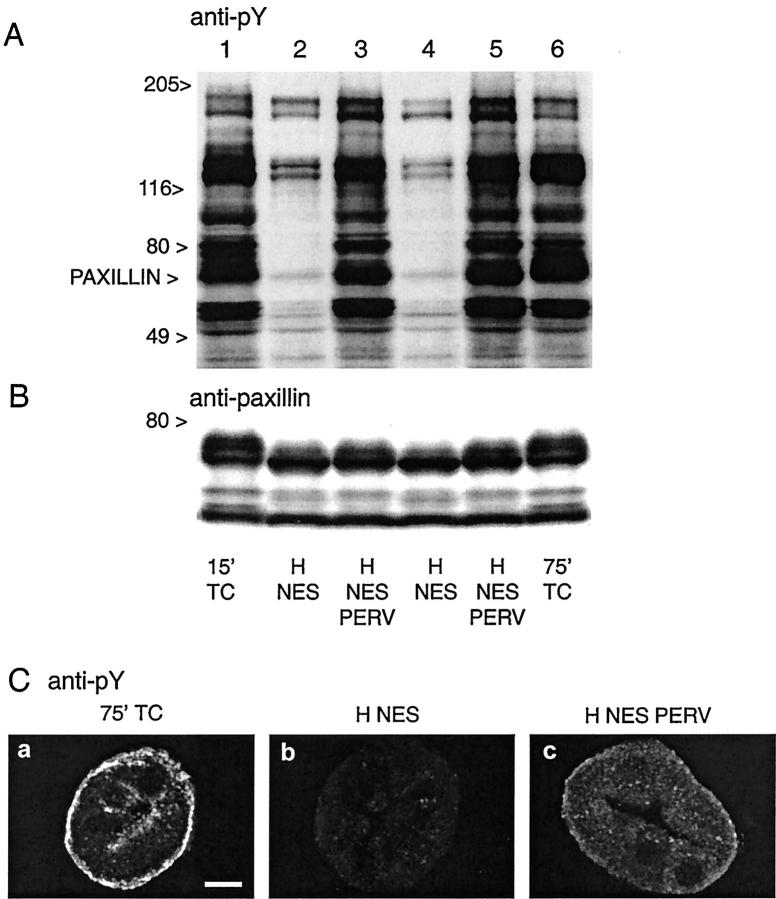
The loss of pY during hypoxia was mediated by vanadate-sensitive phosphatases, because it was almost entirely blocked in tubules treated with pervanadate (Figure 10A ▶ , 40,41 ). The pervanadate-treated tubules had better retention of basal staining for pY, but it was still markedly decreased relative to controls (Figure 10C) ▶ . The faster migration of paxillin during hypoxia, which was evident in both the 4G10-stained immunoblot (Figure 10A) ▶ and the blot immunostained for paxillin (Figure 10B) ▶ , was somewhat reduced, but not eliminated by pervanadate. The failure of vanadate to completely prevent the faster migration of paxillin (Figure 10B) ▶ despite its effect to preserve pY content of the protein (Figure 10A) ▶ is likely because of the substantial serine/threonine phosphorylation of paxillin, 50,51,53 decreases of which would not have been affected by vanadate inhibition of tyrosine phosphatases.
Figure 10.
Effect of inhibiting tyrosine phosphatases with pervanadate on dephosphorylation during hypoxia. Tubules were subjected to 60 minutes of hypoxia (H) with NES without or with 120 μmol/L of pervanadate (PERV). Samples collected at the end of hypoxia were immunoblotted for pY (A) and paxillin (B) and immunostained for pY (C). TC indicates oxygenated time control samples corresponding to the start of hypoxia at 15 minutes of incubation and the end of hypoxia at 75 minutes of incubation. Each lane in the immunoblot is from a separate flask subjected to the indicated conditions.
The studies in Figures 2 to 10 ▶ ▶ ▶ suggest that tyrosine phosphorylation could be used as an index of effective ATP availability, which would complement the information from direct measurements of ATP. ATP recovery of the tubules during reoxygenation is a function of both their capacity for oxidative phosphorylation and the size of the purine pool available for rapid rephosphorylation. Exogenous adenine nucleotides can be added to the tubule suspensions to compensate for decreases of the purine pool during hypoxia 55 and allow cell ATP to be a better index of recovery of mitochondrial function. 33-35 Adenosine formed from catabolism of the medium nucleotides is transported into the cells and increases cell ATP in both oxygenated control tubules and reoxygenated tubules (Figure 1) ▶ . 33-35,56 Exogenous nucleotides are better for this purpose than adenosine itself because of the kinetics of extracellular nucleotide and adenosine catabolism and adenosine uptake by the tubules. 56 As shown in Figure 1 ▶ , under equivalent conditions of exogenous purine supplementation, tubules supplemented with αKG/ASP recovered their ATP levels during reoxygenation better than tubules with NES. However, the ATP levels of the αKG/ASP-supplemented tubules that did not also receive exogenous ATP, particularly the group supplemented with αKG/ASP only during reoxygenation, were only slightly higher than the ATP levels of tubules with NES that received exogenous ATP (Figure 1) ▶ .
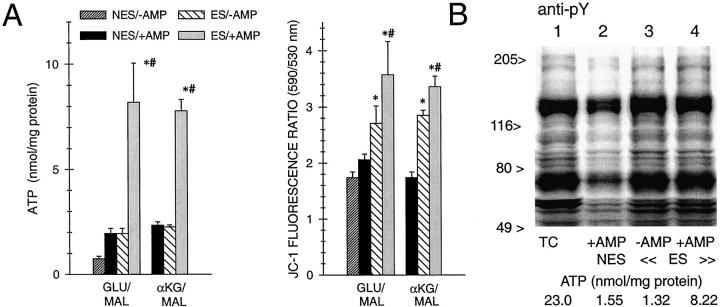
To assess whether the equivalence of ATP levels between the latter two conditions represented similar cellular recovery, we performed additional experiments that included an assessment of mitochondrial membrane potential (Δψm) as a direct marker of mitochondrial functional integrity 34 and of tyrosine phosphorylation (Figure 11) ▶ . In these studies, we used two alternate substrate combinations that behave similarly to αKG/ASP, glutamate plus malate and αKG plus malate (αKG/MAL). 35 Each combination was delivered only during reoxygenation with and without supplemental purine (250 μmol/L AMP) in the medium. With both substrate combinations, the groups that received ES without AMP (+ES/−AMP) had ATP levels that were indistinguishable from tubules with NES that received AMP (NES/+AMP, Figure 11A ▶ ). The +ES/−AMP tubules, however, had nearly complete recovery of pY on immunoblots (Figure 11B) ▶ and significantly better recovery of Δψm than the NES/+AMP groups, although Δψm did not quite reach the level seen in the presence of both supplemental substrate and AMP (+ES/+AMP) (Figure 11A) ▶ . Thus, substrate-supplemented tubules have substantially stronger recovery of both mitochondrial function and tyrosine phosphorylation than tubules without extra protective substrates, even in the absence of the maximal restoration of cellular ATP that is promoted by the exogenous purines.
Figure 11.
Extent of ATP recovery required for protective effects of supplemental substrates. A: Tubules were subjected to 60 minutes of hypoxia and 60 minutes of reoxygenation with either NES or extra substrates (ES). Four mmol/L concentrations of the supplemental substrates, glutamate plus malate or αKG/MAL, were provided only during reoxygenation. For each condition, tubules were studied with (+) and without (−) AMP (250 μmol/L) in the medium during reoxygenation. Values are means ± SE for n = 4–10. *, Significantly different from corresponding NES/+AMP group; #, significantly different from corresponding ES/−AMP group. Values for control oxygenated tubules (not shown in the figure) at 135 minutes of total incubation corresponding to the end of the reoxygenation period in the experimental flasks were: ATP, 19.2 ± 2.3 nmol/mg protein with AMP and 6.57 ± 0.25 without AMP; 5,5′,6,6′-tetrachloro-1,1′,3,3′-tetraethylbenzimidazocarbocyanine iodide (JC-1) 590/530 nm ratio, 4.34 ± 0.06 with AMP and 4.21 ± 0.15 without AMP. B: pY immunoblot for a representative experiment from the series of studies in which αKG/MAL was used as the ES. Lane 1, oxygenated time control (TC); lane 2, hypoxia/reoxygenation with NES, AMP present during reoxygenation (+AMP); lane 3, hypoxia/reoxygenation with ES during reoxygenation, but without AMP (−AMP); lane 4, hypoxia/reoxygenation with ES and AMP present during reoxygenation. The ATP values given for each of the samples were obtained at the end of reoxygenation at the same time as the protein for immunoblotting was collected. pY signals of oxygenated controls were not affected by ES or AMP (not shown).
Discussion
Adhesive contacts between cells and the extracellular matrix are mediated by integrins that concentrate in focal adhesions where actin stress fibers and associated proteins are anchored. Binding of integrins to their matrix targets promotes integrin clustering and association with the cytoskeleton, which, in turn leads to further clustering and remodeling of the matrix in a positive feedback system. 44-46,48 The tyrosine and serine-threonine phosphorylation-mediated interactions among the nonreceptor tyrosine kinase, focal adhesion kinase, 57 and adapter proteins such as paxillin 53 and p130cas 52 that become associated in focal adhesions transduce chemical signals and functionally and physically link these complexes with growth factor 58 and G protein-coupled 59 receptors. Cell shape, motility, survival, 36-38 and proliferation are all regulated by these interactions.
Although available data are conflicting about the precise changes that occur in vivo, 17,18 redistribution of tubule cell β1 integrins from their normal sites at the basal surface during ischemic acute renal failure and related forms of acute tubule injury has been implicated in loss of cell adhesion and dysfunctional re-aggregation of detached tubule cells. 14-19,60,61 In the present study, immunostaining for β1 integrin was strikingly decreased during hypoxia. This observation contrasts with a previous study of rat kidney where it was not changed during ischemia before reperfusion. 18 We have observed a similar decrease of immunostaining for β1 in ischemic rabbit kidney (data not shown), so the loss of immunostaining for β1 is not a peculiarity of the isolated tubules. It does not represent a complete loss of integrins from the basolateral surface because α6, although redistributed, was still partially retained there (Figure 2) ▶ . It is also not due to of degradation of the protein because total β1 protein measured by immunoblotting was unchanged and immunostaining was rapidly restored during reoxygenation in the substrate-supplemented tubules (Figure 3) ▶ . We suspect that the loss of immunostaining for β1 derives from an ATP depletion-dependent change in the epitope recognized by the mAb used, 62 but further studies will be needed to be establish this. Nonetheless, the data demonstrate major changes in both β1 and α6 during the insult.
There is relatively little published information about focal adhesion proteins in proximal tubule cells 13,19,47,63,64 . In the previous work most relevant to the present studies, tyrosine phosphorylation was generally decreased in cultured mouse proximal tubule cells that were ATP depleted with cyanide and deoxyglucose, although increases in some proteins that were enhanced by vanadate provided evidence for continuing tyrosine kinase activity under those conditions. 13 In the present studies, pY content of all of the major focal adhesion proteins decreased by >90% during hypoxia without any changes of total protein content.
The sensitivity of tyrosine phosphorylation to ATP availability and its usefulness for monitoring that parameter is emphasized by the studies of tubules treated with αKG/ASP during hypoxia in which the slightly higher levels of ATP were accompanied by 2.5-fold higher levels of tyrosine phosphorylation of paxillin, although phosphorylation remained low compared to controls (Figure 6) ▶ . This observation importantly demonstrates that, although the steady-state concentration increment of ATP produced by the substrates is extremely small, it is indicative of a continuing supply of ATP that is capable of supporting some phosphorylation of highly labile cytosolic proteins in addition to preventing the mitochondrial lesion. As shown in Figures 1 and 5 ▶ ▶ , these events were sufficient to allow strong recovery of both mitochondrial metabolism and tyrosine phosphorylation during reoxygenation even if protective substrates were not continued during the reoxygenation period. Moreover, provision of the protective substrates only during reoxygenation after the completion of the changes induced by hypoxia per se was nearly as effective.
The measurements at the end of reoxygenation are notable for the rapidity and completeness of recovery of protein phosphorylation and localization in the substrate-supplemented tubules, even after 60 minutes of very severe hypoxia-induced ATP depletion and, as shown in the Figure 11 ▶ studies, despite the limited restoration of cell ATP when the substrate-supplemented tubules were not also purine supplemented. Tubules treated with αKG/MAL or glutamate plus malate during reoxygenation without concomitant AMP supplementation in the medium (ES/−AMP) recovered cell ATP only to the low levels measured in tubules that were not supplemented with protective substrates, but which had AMP added to their medium (NES/+AMP) (Figure 11A) ▶ . Despite their low ATP levels, the ES/−AMP tubules had strong recovery of both Δψm (Figure 11A) ▶ and tyrosine phosphorylation (Figure 11B) ▶ . These observations are best interpreted in the context of the recovery patterns of individual tubules under protected and unprotected conditions. As shown by the quantitative immunostaining data in Figure 9 ▶ , most tubules in unprotected samples have very low or absent recovery of tyrosine phosphorylation, but a subpopulation does recover strongly. Most of the Δψm and immunoblot pY signals derive from this subpopulation that recovers, so the values averaged over the whole suspension underestimate recovery of these cells and overestimate recovery of the rest. In contrast, most substrate-protected tubules recover tyrosine phosphorylation strongly, so that the average values for these samples are more representative of the majority of individual tubules. The 1.9- to 2.3-nmol/mg protein ATP levels of the ES/−AMP tubules, which were 30% of the ATP levels of oxygenated controls not supplemented with AMP and 10% of controls that were supplemented with AMP, are, thus, above the threshold of cell ATP required for essentially full recovery of phosphorylation and localization of the focal adhesion proteins assessed. The data indicate that the threshold for coordinated re-assembly of focal adhesions was not reached in most cells during reoxygenation after 60 minutes of hypoxia without extra protective substrates. Whether other surface protein assemblies that are disrupted during ATP depletion such as tight junctions and adherens junctions 5,9-13 show different patterns of recovery and dependence on ATP availability during reoxygenation is an interesting question that can be addressed by future studies with this model. The excellent recovery of fodrin and microvillar actin in the substrate-protected tubules (Figure 3) ▶ indicates that the benefit is not limited to focal adhesions.
In conclusion, hypoxic isolated proximal tubules develop alterations in basal membrane immunostaining for β1 and α6 integrins and paxillin and extensive dephosphorylation of multiple tyrosine phosphorylated focal adhesion proteins that indicate major disruption of focal adhesions. Citric acid cycle metabolites that support anaerobic pathways of mitochondrial metabolism provide ATP that is available in the cytosol during hypoxia and promote recovery of mitochondrial function during reoxygenation. This enables a strikingly rapid and complete restoration of phosphorylation and normal basal localization of these proteins along with a generalized improvement of cytoskeletal recovery. Given the importance of cell-matrix interactions involving focal adhesions for maintaining cell adhesion and mediating signaling events required for survival, these data support the concept that the energetic deficit in the tubules and its modification by protective substrates play pivotal roles in both their immediate recovery from ATP depletion and their long-term prospects for viability.
Acknowledgments
We thank Magaly Abarzua, Julie A. Davis, Sarah M. Mcdonald, David M. Schoenherr, and Yuan Hua Wen for technical assistance.
Footnotes
Address reprint requests to Dr. Joel M. Weinberg, Nephrology Research, Room 1560, MSRB II, University of Michigan Medical Center, Ann Arbor, MI 48109-0676. E-mail: wnberg@umich.edu.
Supported by National Institutes of Health grants DK-34275 and DK-39255 (to J. M. W.), DK-37139 (to M. A. V.), and DK-53761 and CA–79495 (to I. N.).
A preliminary report of some of the data appeared in abstract form as: JASN 10:642A, 1999.
References
- 1.Solez K, Morel-Maroger L, Sraaer J: >The morphology of “acute tubular necrosis” in man: analysis of 57 renal biopsies and a comparison with the glycerol model. Medicine (Baltimore) 1979, 58:362–376 [PubMed]
- 2.Jones DB: Ultrastructure of human acute renal failure. Lab Invest 1982, 46:254-264 [PubMed] [Google Scholar]
- 3.Venkatachalam MA: Pathology of acute renal failure. Brenner BM Stein JH eds. Acute Renal Failure. 1981, :pp 99-107 Churchill Livingstone, New York [Google Scholar]
- 4.Alejandro V, Scandling JDJ, Sibley RK, Dafoe D, Alfrey E, Denn W, Myers BD: Mechanisms of filtration failure during postischemic injury of the human kidney. : A study of the reperfused renal allograft. J Clin Invest 1995, 95:820-831 [DOI] [PMC free article] [PubMed] [Google Scholar]
- 5.Kwon O, Nelson WJ, Sibley R, Huie P, Scandling JD, Dafoe D, Alfrey E, Myers BD: Backleak, light junctions, and cell-cell adhesion in postischemic injury to the renal allograft. J Clin Invest 1998, 101:2054-2064 [DOI] [PMC free article] [PubMed] [Google Scholar]
- 6.Thadhani R, Pascual M, Bonventre JV: Medical progress—acute renal failure. N Engl J Med 1996, 334:1448-1460 [DOI] [PubMed] [Google Scholar]
- 7.Fish EM, Molitoris BA: Alterations in epithelial polarity and the pathogenesis of disease states. N Engl J Med 1994, 330:1580-1588 [DOI] [PubMed] [Google Scholar]
- 8.Van Why SK, Mann AS, Ardito T, Siegel NJ, Kashgarian M: Expression and molecular regulation of Na+-K+-ATPase after renal ischemia. Am J Physiol 1994, 267:F75-F85 [DOI] [PubMed] [Google Scholar]
- 9.Molitoris BA, Falk SA, Dahl RH: Ischemia-induced loss of epithelial polarity. : Role of the tight junction. J Clin Invest 1989, 84:1334-1339 [DOI] [PMC free article] [PubMed] [Google Scholar]
- 10.Mandel LJ, Bacallao R, Zampighi G: Uncoupling of the molecular ‘fence’ and paracellular ‘gate’ functions in epithelial tight junctions. Nature 1993, 361:552-555 [DOI] [PubMed] [Google Scholar]
- 11.Tsukamoto T, Nigam SK: Role of tyrosine phosphorylation in the reassembly of occludin and other tight junction proteins. Am J Physiol 1999, 276:F737-F750 [DOI] [PubMed] [Google Scholar]
- 12.Tsukamoto T, Nigam SK: Tight junction proteins form large complexes and associate with the cytoskeleton in an ATP depletion model for reversible junction assembly. J Biol Chem 1997, 272:16133-16139 [DOI] [PubMed] [Google Scholar]
- 13.Schwartz JH, Shih T, Menza SA, Lieberthal W: ATP depletion increases tyrosine phosphorylation of beta-catenin and plakoglobin in renal tubular cells. J Am Soc Nephrol 1999, 10:2297-2305 [DOI] [PubMed] [Google Scholar]
- 14.Goligorsky MS, Lieberthal W, Racusen L, Simon E: Integrin receptors in renal tubular epithelium: new insights into pathophysiology of acute renal failure. Am J Physiol 1993, 264:F1-F8 [DOI] [PubMed] [Google Scholar]
- 15.Noiri E, Romanov V, Forest T, Gailit J, DiBona GF, Miller F, Som P, Oster ZH, Goligorsky MS: Pathophysiology of renal tubular obstruction: therapeutic role of synthetic RGD peptides in acute renal failure. Kidney Int 1995, 48:1375-1385 [DOI] [PubMed] [Google Scholar]
- 16.Racusen LC, Fivush BA, Li Y-L, Slatnik I, Solez K, Zapata A, Monckton E, Peteya D, Atkins P: Dissociation of tubular cell detachment and tubular cell death in clinical and experimental “acute tubular necrosis.” Lab Invest 1991, 64:546-556 [PubMed] [Google Scholar]
- 17.Romanov V, Noiri E, Czerwinski G, Finsinger D, Kessler H, Goligorsky MS: Two novel probes reveal tubular and vascular Arg-Gly-Asp (RGD) binding sites in the ischemic rat kidney. Kidney Int 1997, 52:93-102 [DOI] [PubMed] [Google Scholar]
- 18.Zuk A, Bonventre JV, Brown D, Matlin KS: Polarity, integrin, and extracellular matrix dynamics in the postischemic rat kidney. Am J Physiol 1998, 275:C711-C731 [DOI] [PubMed] [Google Scholar]
- 19.Wijesekera DS, Zarama MJ, Paller MS: Effects of integrins on proliferation and apoptosis of renal epithelial cells after acute injury. Kidney Int 1997, 52:1511-1520 [DOI] [PubMed] [Google Scholar]
- 20.Kobryn CE, Mandel LJ: Decreased protein phosphorylation induced by anoxia in proximal renal tubules. Am J Physiol 1994, 267:C1073-C1079 [DOI] [PubMed] [Google Scholar]
- 21.Chen J, Cohn JA, Mandel LJ: Dephosphorylation of ezrin as an early event in renal microvillar breakdown and anoxic injury. Proc Natl Acad Sci USA 1995, 92:7495-7499 [DOI] [PMC free article] [PubMed] [Google Scholar]
- 22.Guder WG, Ross BD: Enzyme distribution along the nephron. Kidney Int 1984, 26:101-111 [DOI] [PubMed] [Google Scholar]
- 23.Bastin J, Cambon N, Thompson M, Lowry OH, Burch HB: Change in energy reserves in different segments of the nephron during brief ischemia. Kidney Int 1987, 31:1239-1247 [DOI] [PubMed] [Google Scholar]
- 24.Weinberg JM: Oxygen deprivation-induced injury to isolated rabbit kidney tubules. J Clin Invest 1985, 76:1193-1208 [DOI] [PMC free article] [PubMed] [Google Scholar]
- 25.Takano T, Soltoff SP, Murdaugh S, Mandel LJ: Intracellular respiratory dysfunction and cell injury in short-term anoxia of rabbit renal proximal tubules. J Clin Invest 1985, 76:2377-2384 [DOI] [PMC free article] [PubMed] [Google Scholar]
- 26.Joseph JK, Bunnachak D, Burke TJ, Schrier RW: A novel method of inducing and assuring total anoxia during in vitro studies of O2 deprivation injury. J Am Soc Nephrol 1990, 1:837-840 [DOI] [PubMed] [Google Scholar]
- 27.Zager RA, Conrad DS, Burkhart K: Phospholipase A2: a potentially important determinant of adenosine triphosphate levels during hypoxic-reoxygenation tubular injury. J Am Soc Nephrol 1996, 7:2327-2339 [DOI] [PubMed] [Google Scholar]
- 28.Weinberg JM, Davis JA, Abarzua M, Rajan T: Cytoprotective effects of glycine and glutathione against hypoxic injury to renal tubules. J Clin Invest 1987, 80:1446-1454 [DOI] [PMC free article] [PubMed] [Google Scholar]
- 29.Dong Z, Patel Y, Saikumar P, Weinberg JM, Venkatachalam MA: Development of porous defects in plasma membranes of ATP-depleted Madin-Darby canine kidney cells and its inhibition by glycine. Lab Invest 1998, 78:657-668 [PubMed] [Google Scholar]
- 30.Weinberg JM, Venkatachalam MA, Goldberg H, Roeser NF, Davis JA: Modulation by Gly, Ca, and acidosis of injury-associated unesterified fatty acid accumulation in proximal tubule cells. Am J Physiol 1995, 268:F110-F121 [DOI] [PubMed] [Google Scholar]
- 31.Nurko S, Sogabe K, Davis JA, Roeser NF, Defrain M, Chien A, Hinshaw D, Athey B, Meixner W, Venkatachalam MA, Weinberg JM: Contribution of actin cytoskeletal alterations to ATP depletion and calcium-induced proximal tubule cell injury. Am J Physiol 1996, 270:F39-F52 [DOI] [PubMed] [Google Scholar]
- 32.Sogabe K, Roeser NF, Davis JA, Nurko S, Venkatachalam MA, Weinberg JM: Calcium dependence of integrity of the actin cytoskeleton of proximal tubule cell microvilli. Am J Physiol 1996, 271:F292-F303 [DOI] [PubMed] [Google Scholar]
- 33.Weinberg JM, Roeser NF, Davis JA, Venkatachalam MA: Glycine-protected, hypoxic, proximal tubules develop severely compromised energetic function. Kidney Int 1997, 52:140-151 [DOI] [PubMed] [Google Scholar]
- 34.Weinberg JM, Venkatachalam MA, Roeser NF, Nissim I: Mitochondrial dysfunction during hypoxia/reoxygenation and its correction by anaerobic metabolism of citric acid cycle intermediates. Proc Natl Acad Sci USA 2000, 97:2826-2831 [DOI] [PMC free article] [PubMed] [Google Scholar]
- 35.Weinberg JM, Venkatachalam MA, Roeser NF, Saikumar P, Dong Z, Senter RA, Nissim I: Anaerobic and aerobic pathways for salvage of proximal tubules from hypoxia-induced mitochondrial injury. Am J Physiol 2000, 279:F927-F943 [DOI] [PMC free article] [PubMed] [Google Scholar]
- 36.O’Brien V, Frisch SM, Juliano RL: Expression of the integrin a5 subunit in HT29 colon carcinoma cells suppresses apoptosis triggered by serum deprivation. Exp Cell Res 1996, 224:208-213 [DOI] [PubMed] [Google Scholar]
- 37.Ilic D, Almeida EA, Schlaepfer DD, Dazin P, Aizawa S, Damsky CH: Extracellular matrix survival signals transduced by focal adhesion kinase suppress p53-mediated apoptosis. J Cell Biol 1998, 143:547-560 [DOI] [PMC free article] [PubMed] [Google Scholar]
- 38.Chan PC, Lai JF, Cheng CH, Tang MJ, Chiu CC, Chen HC: Suppression of ultraviolet irradiation-induced apoptosis by overexpression of focal adhesion kinase in Madin-Darby canine kidney cells. J Biol Chem 1999, 274:26901-26906 [DOI] [PubMed] [Google Scholar]
- 39.Chen LB, Smiley ST: Probing mitochondrial membrane potential in living cells by a J-aggregate-forming dye. Mason WT eds. Fluorescent and Luminescent Probes for Biological Activity. 1994, :pp 124-132 Academic Press, New York [Google Scholar]
- 40.Li J, Elberg G, Gefel D, Shechter Y: Permolybdate and pertungstate—potent stimulators of insulin effects in rat adipocytes: mechanism of action. Biochemistry 1995, 34:6218-6225 [DOI] [PubMed] [Google Scholar]
- 41.Volberg T, Zick Y, Dror R, Sabanay I, Gilon C, Levitzki A, Geiger B: The effect of tyrosine-specific protein phosphorylation on the assembly of adherens-type junctions. EMBO J 1992, 11:1733-1742 [DOI] [PMC free article] [PubMed] [Google Scholar]
- 42.Simon EE, McDonald JA: Extracellular matrix receptors in the kidney cortex. Am J Physiol 1990, 259:F783-F792 [DOI] [PubMed] [Google Scholar]
- 43.Simon EE, Liu CH, Das M, Nigam S, Broekelmann TJ, McDonald JA: Characterization of integrins in cultured human renal cortical tubule epithelial cells. Am J Physiol 1994, 267:F612-F623 [DOI] [PubMed] [Google Scholar]
- 44.Clark EA, Brugge JS: Integrins and signal transduction pathways: the road taken. Science 1995, 268:233-239 [DOI] [PubMed] [Google Scholar]
- 45.Richardson A, Parsons JT: Signal transduction through integrins: a central role for focal adhesion kinase? Bioessays 1995, 17:229-236 [DOI] [PubMed] [Google Scholar]
- 46.Rozengurt E: Convergent signalling in the action of integrins, neuropeptides, growth factors and oncogenes. Cancer Surv 1995, 24:81-96 [PubMed] [Google Scholar]
- 47.Tremblay L, Beliveau R: Tyrosine protein phosphorylation in plasma membranes of rat kidney cortex. Am J Physiol 1994, 267:F415-F422 [DOI] [PubMed] [Google Scholar]
- 48.Giancotti FG, Ruoslahti E: Integrin signaling. Science 1999, 285:1028-1032 [DOI] [PubMed] [Google Scholar]
- 49.Cobb BS, Schaller MD, Leu TH, Parsons JT: Stable association of pp60src and pp59fyn with the focal adhesion-associated protein tyrosine kinase, pp125FAK. Mol Cell Biol 1994, 14:147-155 [DOI] [PMC free article] [PubMed] [Google Scholar]
- 50.Salgia R, Li JL, Lo SH, Brunkhorst B, Kansas GS, Sobhany ES, Sun Y, Pisick E, Hallek M, Ernst T: Molecular cloning of human paxillin, a focal adhesion protein phosphorylated by P210BCR/ABL. J Biol Chem 1995, 270:5039-5047 [DOI] [PubMed] [Google Scholar]
- 51.Hildebrand JD, Schaller MD, Parsons JT: Paxillin, a tyrosine phosphorylated focal adhesion-associated protein binds to the carboxyl terminal domain of focal adhesion kinase. Mol Biol Cell 1995, 6:637-647 [DOI] [PMC free article] [PubMed] [Google Scholar]
- 52.Vuori K, Ruoslahti E: Tyrosine phosphorylation of p130Cas and cortactin accompanies integrin-mediated cell adhesion to extracellular matrix. J Biol Chem 1995, 270:22259-22262 [DOI] [PubMed] [Google Scholar]
- 53.Turner CE: Paxillin. Int J Biochem Cell Biol 1998, 30:955-959 [DOI] [PubMed] [Google Scholar]
- 54.Mazaki Y, Uchida H, Hino O, Hashimoto S, Sabe H: Paxillin isoforms in mouse. : Lack of the gamma isoform and developmentally specific beta isoform expression. J Biol Chem 1998, 273:22435-22441 [DOI] [PubMed] [Google Scholar]
- 55.Weinberg JM: Adenine nucleotide metabolism by isolated kidney tubules during oxygen deprivation. Biochem Med Metab Biol 1988, 39:319-329 [DOI] [PubMed] [Google Scholar]
- 56.Weinberg JM, Davis JA, Lawton A, Abarzua M: Modulation of cell nucleotide levels of isolated kidney tubules. Am J Physiol 1988, 254:F311-F322 [DOI] [PubMed] [Google Scholar]
- 57.Ilic D, Damsky CH, Yamamoto T: Focal adhesion kinase: at the crossroads of signal transduction. J Cell Sci 1997, 110:401-407 [DOI] [PubMed] [Google Scholar]
- 58.Sieg DJ, Hauck CR, Ilic D, Klingbeil CK, Schaefer E, Damsky CH, Schlaepfer DD: FAK integrates growth factor and integrin signals to promote cell migration. Nature Cell Biol 2000, 2:249-257 [DOI] [PubMed] [Google Scholar]
- 59.Needham LK, Rozengurt E: Galpha12 and Galpha13 stimulate Rho-dependent tyrosine phosphorylation of focal adhesion kinase, paxillin, and p130 Crk-associated substrate. J Biol Chem 1998, 273:14626-14632 [DOI] [PubMed] [Google Scholar]
- 60.Gailit J, Colflesh D, Rabiner I, Simone J, Goligorsky MS: Redistribution and dysfunction of integrins in cultured renal epithelial cells exposed to oxidative stress. Am J Physiol 1993, 264:F149-F157 [DOI] [PubMed] [Google Scholar]
- 61.Lieberthal W, Mckenney JB, Kiefer CR, Snyder LM, Kroshian VM, Sjaastad MD: b1 integrin-mediated adhesion between renal tubular cells after anoxic injury. J Am Soc Nephrol 1997, 8:175-183 [DOI] [PubMed] [Google Scholar]
- 62.O’Toole TE, Katagiri Y, Faull RJ, Peter K, Tamura R, Quaranta V, Loftus JC, Shattil SJ, Ginsberg MH: Integrin cytoplasmic domains mediate inside-out signal transduction. J Cell Biol 1994, 124:1047-1059 [DOI] [PMC free article] [PubMed] [Google Scholar]
- 63.Sorenson CM, Sheibani N: Focal adhesion kinase, paxillin, and bcl-2: analysis of expression, phosphorylation, and association during morphogenesis. Dev Dyn 1999, 215:371-382 [DOI] [PubMed] [Google Scholar]
- 64.Liu CH, Simon EE: Focal adhesion kinase (FAK) in proximal tubule epithelial cells in primary culture. J Am Soc Nephrol 1995, 6:900A [Google Scholar]


