

Abstract
This study investigated the hypothesis that p53 accumulation in neuroblastoma, in the absence of mutation, is associated with functional inactivation, which interferes with downstream mediators of p53 function. To test this hypothesis, p53 expression, location, and functional integrity was examined in neuroblastoma by irradiating 6 neuroblastoma cell lines and studying the effects on p53 transcriptional function, cell cycle arrest, and induction of apoptosis, together with the transcriptional function of p53 after irradiation in three ex vivo primary, untreated neuroblastoma tumors. p53 sequencing showed five neuroblastoma cell lines, two of which were MYCN-amplified, and that all of the tumors were wild-type for p53. p53 was found to be predominantly nuclear before and after irradiation and to up-regulate the p53 responsive genes WAF1 and MDM2 in wild-type p53 cell lines and a poorly-differentiated neuroblastoma, but not a differentiating neuroblastoma or the ganglioneuroblastoma part of a nodular ganglioneuroblastoma in short term culture. This suggests intact p53 transcriptional activity in proliferating neuroblastoma. Irradiation of wild-type p53 neuroblastoma cell lines led to G1 cell cycle arrest in cell lines without MYCN amplification, but not in those with MYCN amplification, despite induction of WAF1. This suggests MYCN amplification may alter downstream mediators of p53 function in neuroblastoma.
Neuroblastoma comprises 10% of childhood malignancies, but despite recent advances in understanding the biology, still accounts for more deaths in childhood than any other cancer. 1 Most neuroblastomas are initially chemo- and radiosensitive, but, when recurrent, are resistant, with <25% of stage 4 patients over 1 year of age being long term survivors. 1,2 MYCN amplification occurs in 20 to 25% of neuroblastoma, and is a poor prognostic indicator in localized tumors and infants <1 year of age. 1
An important mechanism of intrinsic chemoresistance in many tumor cells is an abnormality in the p53 tumor suppressor gene pathway. 3 p53 is mutated in up to 60% of human cancers, leading, in most cases, to accumulation of a non-functional protein. 3 p53, a nuclear phosphoprotein, is usually present at low levels in the cell due to a short half-life of 30 minutes, but accumulates in response to cellular stress such as DNA damage from irradiation or alkylating agents. It binds DNA in a sequence-specific manner to activate the transcription of a number of genes, including p21WAF1, MDM2 and BAX. WAF1 inhibits G1 cyclin-dependent kinases, blocking cell cycle progression from G1 into S phase. MDM2 binds to p53 and blocks its ability to function as a transcription factor so creating an autoregulatory feedback loop to tightly regulate p53 levels. Tumors with mutant p53 cannot usually bind to DNA and up-regulate MDM2 and consequently, there is a lack of MDM2 to bind to p53 and target it for ubiquitin-mediated degradation, resulting in p53 accumulation. 4
p53 can also respond to cellular stress by inducing apoptosis, which may be transcriptionally dependent or independent depending on the cell type. In some cell types, p53 transcriptionally induces BAX, a pro-apoptotic gene that forms mitochondrial pores leading to cytosolic release of cytochrome c, which activates caspases and leads to apoptosis. 4 BAX may also form heterodimers with BCL2, an anti-apoptotic membranous protein, which may be transcriptionally repressed by p53. Whether a cell undergoes growth arrest, or apoptosis, is dependent on the cell type, phase of the cell cycle, differentiation status, the presence of other oncogenic abnormalities and external growth and survival factors, and the level of DNA damage and p53 induced. Since p53 induction can lead to apoptosis following DNA damage, acquisition of p53 mutations might promote tumorigenesis and lead to chemoresistance. Several studies screening for p53 mutations by single strand conformational polymorphism analysis followed by direct sequencing, have shown that p53 mutations in neuroblastoma tumors 5-8 and cell lines 6,9 are rare. However, p53 is readily detectable in neuroblastoma tissue 10,11 and cell lines 9,12,13 where it has a prolonged half-life of 6 to 10 hours, and there is increased transcription. 9,12 Stabilization of p53 can occur through mechanisms other than mutation such as binding to viral oncoproteins, but in neuroblastoma cell lines p53 has not been found to bind to the SV40 viral large T antigen or heat shock protein-70 using co-immunoprecipitation. 9
Accumulation of p53 can also occur in conjunction with altered subcellular localization, and this has been proposed as a mechanism for the accumulation and functional inactivation of p53 in neuroblastoma. An immunocytochemical (ICC) study of frozen neuroblastomas reported cytoplasmic sequestration of p53 in undifferentiated neuroblastomas. 14 In contrast, two other ICC studies on formalin-fixed, paraffin-embedded tissue reported nuclear localization of p53. 10,11 In neuroblastoma cell lines, some studies report nuclear, 15,16 and others cytoplasmic, localization of p53. 17,18 There is further controversy over whether cytoplasmic localization renders p53 non-functional, with some studies suggesting that it does 17,18 and others suggesting that it does not. 19,20
This study investigated the hypothesis that p53 accumulation in neuroblastoma, in the absence of mutation, is associated with functional inactivation, which interferes with downstream mediators of p53 function. The current study showed that p53 is both nuclear and functional in wild-type p53 neuroblastoma cell lines and a poorly differentiated ex-vivo neuroblastoma in short term culture. The response of wild-type p53 neuroblastoma cell lines to irradiation was heterogeneous in terms of the transcriptional activity of p53, cell cycle arrest and level of apoptosis. In particular it was observed that MYCN-amplified neuroblastoma cell lines with wild-type p53 underwent predominantly G2 arrest after irradiation despite induction of WAF1. The role of MYCN in affecting the downstream response to p53 in neuroblastoma should be further explored.
Materials and Methods
Cell Lines and Tumors
Six human Mycoplasma-free neuroblastoma cell lines were studied: IMR32, 21 SKNSH, 22 SHSY5Y (a neuroblastic (N) type clone of SKNSH), SHEP (a substrate adherent (S) type clone of SKNSH), 22 NGP 23 and SKNBE(2c). 22 Three human control cell lines were also studied; MCF7 breast cancer cell line as a positive control for functional wild-type p53 24 and two negative controls, the p53 mutant neuroepithelioma/Ewing’s tumor cell line NB/CHP100, 9,25 and the p53 null SAOS2 osteosarcoma cell line. 26 All cell lines were grown as monolayers in RPMI 1640 medium (Life Technologies, Paisley, United Kingdom) supplemented with 10% fetal calf serum in a 37°C, 5% CO2, humidified incubator. Karyotypic analysis of all neuroblastoma cell lines and the NB100 cell line was performed to confirm previously published karyotypes and ensure the cell lines were genuine.
Three primary untreated tumors were obtained within 1 hour of surgical resection for ex vivo studies in short-term culture. Two were from children aged 2 years with stage 1 and 4 non-MYCN amplified neuroblastomas (tumors 1 and 3, respectively), and one was from a two-year-old child with a MYCN-amplified, 1p deleted stage 4 neuroblastoma (tumor 2).
p53 Sequencing of Cell Lines and Tumors
Total cellular RNA was extracted from frozen cell pellets (∼5 × 10 7 cells) using RNAzol B (Biogenesis, Poole, UK). RNA was used as a template to synthesize full length p53 cDNA using the RT-1 primer CGG GAG GTA GAC (5 μg/ml), Superscript II reverse transcriptase (Life Technologies), first strand buffer, 10 mmol/L DTT, dNTPs (4 mmol/L) and 2 μg RNA heated to 65°C for 10 minutes. The 20 μl reaction mix was incubated for 1 hour at 46°C.
The p53 cDNA was amplified by the polymerase chain reaction (RT-PCR) in a thermal cycler (Perkin-Elmer, Norwalk, CT) using forward and reverse primers with phosphorothioate linkages: 5′-ATT TGA TGC TGT CCC CGG ACG ATA TTG AA-s-C-3′ (5 μg/ml) and 5′-ACC CTT TTT GGA CTT CAG GTG GCT GGA GT-s-G-3′ (5 μg/ml), Pfu DNA polymerase (Stratagene, La Jolla, CA), 10× reaction buffer (Stratagene) and dNTPs (0.2 mmol/L) (Pharmacia, Herts, United Kingdom), in a 20 μl reaction mix. The PCR reaction involved an initial denaturation step at 95°C for 5 minutes followed by 35 cycles of subsequent denaturation at 94°C for 30 seconds, annealing at 65°C for 60 seconds, and elongation at 78°C for 80 seconds. The products were analyzed by electrophoresis on a 1.8% (w/v) low melting point agarose gel (NuSieve, Maine) in Tris acetate buffer. Products were excised and purified using a QIAquick gel extraction kit (Qiagen, West Sussex, United Kingdom). The purified p53 cDNA was then sequenced using the above primers and two additional internal ones 5′-TGG CCA TCT ACA AGC AGT CA-3′ and 5′-GGG CAC CAC CAC ACT ATG TC-3′, by dideoxy chain termination thermocycle sequencing (Perkin-Elmer). The sequences obtained span exons 4–10 of the human p53 gene and were compared with the published p53 sequence using DNAStar computer software (Madison, WI). Any cell line with a p53 mutation detected in the RT-PCR product had the mutation confirmed by genomic DNA sequencing of the relevant exon using methods described previously. 27 Genomic sequencing of DNA from the 3 primary untreated tumors was also performed by these methods for exons 4–9 of the p53 gene. 27
ICC
Cell pellets (3 × 10 7 cells) were prepared as cytoblocks using a cytospin (Shandon, Pittsburgh, PA). Three micrometer sections were cut from formalin-fixed, paraffin-embedded cell cytoblocks and tumors and placed on adhesive coated 3–(aminopropyltriethoxysilane) (Sigma, St Louis, MO) microscope slides. Endogenous peroxidase activity was blocked by incubation in 0.5% hydrogen peroxide/methanol for 10 minutes and antigen retrieval performed by incubating slides in 0.01 mol/L citrate buffer pH 6.0 in a 650W microwave oven for two 5 minute incubations. ICC was also performed on cell lines from cells grown on Labtek chamber glass slides (Nunc, Naperville, IL) and cytospins of cell pellets, after fixation with 1:1 acetone:methanol for 5 minutes, followed by air drying. Nonspecific binding of antibody was prevented by blocking for 10 minutes in normal rabbit serum diluted 1:10 with Tris-buffered saline (TBS). ICC was performed using the streptavidin-biotin peroxidase technique. Three mouse monoclonal primary antibodies were used which recognize epitopes at the amino terminal of wild-type and mutant p53. NCL-Pab1801 (amino acids 46–55) at 1:40, NCL-DO-7 (both NovoCastra, Newcastle-upon-Tyne, UK), (amino acids 20–25) at 1:50 and DO-1 (hybridoma supernatant) (amino acids 20–25) at 1:4. Other primary antibodies used for ICC were mouse monoclonal antibodies for Ki67 (MIB1), WAF1, and BCL2 (all NovoCastra) at dilutions of 1:200, 1:20, and 1:50 respectively. Rabbit anti-mouse biotinylated secondary antibody (Dako, Glostrup, Denmark) was used at 1:500, streptavidin-biotinylated horseradish peroxidase complex (Dako) at 1:100, the chromagen 3,3-diaminobenzidine tetrachloride (Sigma) in 0.3% hydrogen peroxide solution in TBS and hematoxylin as a nuclear counterstain. The labeling index (LI), percent of immunostained cells, was determined by counting 1000 cells in the areas of densest immunostaining using an Olympus CX microscope at ×40 magnification.
Irradiation
Exponentially growing cells from all cell lines were plated in 28 cm 2 tissue culture dishes (Nunc) at 5 × 10⁵/dish. When ∼70% confluent cells were treated with 4 Gy γ-irradiation from a 137cesium γ-irradiator (Gamma Cell 1000 Elite; Nordion International Inc., Ontario, Canada) at 3.64 Gy/minute and returned to the incubator to be harvested at specific times afterward. The fresh tumors were placed in RPMI 1640 medium with 10% fetal calf serum immediately after surgical resection. After finely chopping they were placed in dishes as above and half the sample irradiated as above and then incubated for 6 hours before harvesting with non-irradiated controls.
Western Blotting
Cells were harvested at 0, 1, 2, 4, 6, and 24 hours after irradiation, lysed in boiled Laemmli lysis buffer [62.5 mmol/L Tris-HCl (pH 6.8), 2% SDS, 10% glycerol], 28 boiled for 10 minutes, sonicated (Soniprep 150, MSE), and the protein content estimated (Pierce, Rockford, IL). Before loading the gel, 5% 2-mercaptoethanol and 0.005% bromophenol blue were added, the samples were boiled again for 5 minutes, centrifuged briefly, and 50 μg of protein loaded on to a 4 to 20% Tris-HCl precast sodium dodecyl sulfate-polyacrylamide gel (Biorad, Hercules, CA) for electrophoresis. Molecular weight markers (Novex, San Diego, CA) or ECL markers (Amersham, UK) were used on every gel. The proteins were transferred electrophoretically overnight to Hybond C nitrocellulose membrane (Amersham). Primary antibodies used were mouse monoclonal NCL-p53DO-7 at 1:1000, MDM2 (Ab-1) (Calbiochem, Cambridge, MA) at 1:100, WAF1 (Ab1) (Calbiochem) at 1:100, NCL-BCL2 at 1:100, MYCN (NCMII100) 29 at 1:10, polyclonal rabbit BAX antibody (Pharmingen, San Diego, CA) both at 1:1000, and mouse monoclonal anti-actin ascitic fluid (Sigma) at 1:1000 as a loading and transfer control. Blots were reprobed for other proteins without prior stripping. Secondary antibodies used were peroxidase-conjugated, affinity isolated, goat anti-mouse (Dako), goat anti-rabbit immunoglobulin (Dako) or biotinylated rabbit anti-mouse (Dako). Secondary antibodies were used at 1:1000, followed by peroxidase conjugated streptavidin (Dako) at 1:5000 after the biotinylated secondary. Protein detection was performed using enhanced chemiluminescence (Amersham). Densitometry was performed on immunoblots using a Bio Image capture system (Millipore, MI) and CCT camera linked to a Sun View computer (Sun View Microsystems, CA). Where >1 band was present only the band of the correct protein size was used in the analysis.
Cell Cycle Analysis
Adherent cells (2 × 10⁶) were harvested 6 and 24 hours after irradiation by trypsinization, fixed with ice-cold 70% ethanol in PBS, and stored at 4°C, followed by resuspension in PBS with RNase (0.1 mg/ml) and propidium iodide (40 μg/ml) (Sigma), and incubation at 37°C for 30 minutes. 30 DNA was analyzed by fluorescence activated cell sorting (Becton-Dickinson, Oxford, UK) and LYSII or Cell Quest computer software used to calculate the proportions of cells in different phases of the cell cycle. Results shown are mean of three experiments ± SD.
Apoptosis Measurements
Cells (2 × 10⁶) were harvested 1, 2, 4, 6, 24, 48, 72, 96, and 108 hours after irradiation by trypsinization, fixed in Carnoy’s (3:1 v/v methanol:acetic acid), centrifuged and resuspended in Carnoy’s and an equal volume of Hoechst 33258 (8 μg/ml). They were examined under a microscope using a UV filter (Zeiss) and the proportion of apoptotic nuclei scored out of 500 counted.
Clonogenic Assays
Cells (1 × 10⁶) were trypsinized immediately after irradiation and a single cell suspension was prepared. After counting with a hemocytometer, between 200 and 40,000 were seeded into 10-cm diameter petri-dishes with 10 ml of medium. They were placed in an incubator and the colony formation (>50 cells) examined after 2 to 3 weeks. The number of colonies per dish was counted after fixing with Carnoy’s and staining with 0.4% crystal violet.
Statistical Analyses
These were performed using Minitab version 11.2 1996 (Minitab Inc., PA) and Stata for Windows 95 version 5.0 1996 (Stata Corporation, Texas) statistical software.
Results
p53 Sequencing, Location and Related Protein Expression in Cell Lines
p53 cDNA sequencing confirmed that the IMR32, SKNSH, SHEP, SHSY5Y, and NGP neuroblastoma cell lines, together with the breast cancer MCF7 cell line, were wild-type for p53. The p53 status of MDM2-amplified NGP cells 31 has not previously been reported but MDM2 gene amplification is associated with wild-type p53 in other cell types. 32 In NB100 neuroepithelioma cells, a 4-bp insertion between codon 232 and 233 in exon 7 was confirmed resulting in a translational stop codon at position 240. 9 The presence of a missense mutation in the SKNBE(2c) neuroblastoma cell line in exon 5 was confirmed at codon 135: G to T transversion; TGC (cysteine) to TTC (phenylalanine). 33
All cell lines with wild-type p53 expressed a 53-kd protein on Western blotting, but not p53 null SAOS2 and p53 mutant NB100 cells (Figure 1) ▶ . The highest level of p53 protein expression was in p53 mutant SKNBE(2c) cells, which expressed a mean of 2.6 times more p53 than IMR32 cells, which expressed higher levels of p53 than any of the other neuroblastoma cell lines (Figure 1) ▶ . The intense p53 band in SKNBE(2c) was still present when the blots were subsequently reprobed for actin (40kd) (Figure 1) ▶ . All cell lines with wild-type p53 showed predominantly nuclear p53 by ICC of formalin-fixed, paraffin-embedded cell pellets (Figure 2a) ▶ , cystospins (data not shown), and cells grown on glass slides (Figure 2b) ▶ . SKNSH cells are composed of two types, a neuroblastic (N type) population, small cells with delicate processes (neuropil) and a larger epithelioid or substrate adherent cell (S type). Some cytoplasmic p53 was present in SKNSH cells using 3 p53 antibodies (DO-7, DO-1 and 1801), particularly in N type cells (Figure 2b ▶ C and D), but cytoplasmic staining of controls without primary antibody, was also observed (Figure 2b, A and B) ▶ . Some mild cytoplasmic staining was also seen in N type cells with other nuclear antigens WAF1 (Figure 2b, E and F) ▶ and Ki67 (Figure 2b, I and J) ▶ , in contrast to strong BCL2 cytoplasmic immunostaining (Figure 2b, G and H) ▶ .
Figure 1.

Western blots of p53 and related proteins in all cell lines studied (50 μg protein/well)
Figure 2.
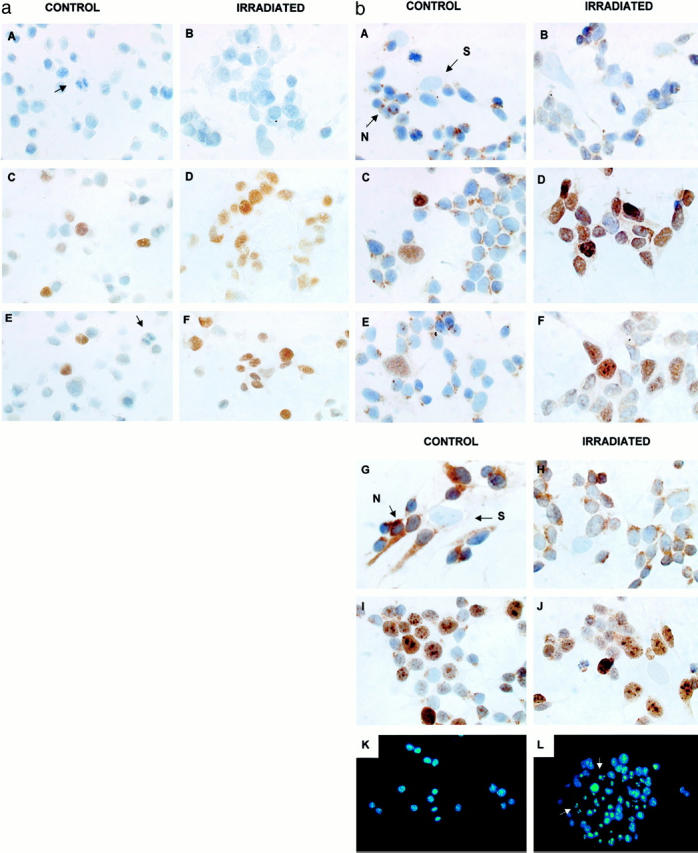
a: Immunocytochemistry (ICC) before and 6 hours after 4 Gy irradiation of IMR32 cells prepared as cytoblocks. A and B: controls without primary antibodies. Note the mitotic cell in A (arrow). C and D: p53 DO-7 ICC showing an increase in nuclear immunostaining (brown) after treatment. E and F: WAF1 ICC showing an increase in nuclear immunostaining after treatment. Note the negative mitotic cell in E (arrow) (original magnification, ×500). b: Immunocytochemistry of SKNSH cells grown on glass slides before and 6 hours after 4 Gy irradiation. A and B: controls without primary antibodies. Note nonspecific brown staining in the cytoplasm of some cells especially N types. C and D: p53DO-7 immunostaining (brown) in both nucleus and cytoplasm of controls and increased positivity predominantly in nucleus after treatment. E and F: WAF1 immunostaining showing nuclear positivity in S type cells before and nuclear positivity in N type cells after treatment. G and H: BCL2 immunostaining of SKNSH cells grown on collagen slides before and 6 hours after 4 Gy irradiation showing cytoplasmic positivity in N type cells but not S type. I and J: Ki67 immunostaining before and 6 hours after irradiation showing nucleolar enhancement (×300). K and L: apoptosis using Hoechst (33258) nuclear staining before and 24 hours after irradiation. Apoptotic cells arrowed (×200).
MCF7 cells expressed the most baseline WAF1 protein, followed by SHEP cells (Figure 1) ▶ . These cell lines also had a high proportion of cells in G1 (data not shown). NGP cells (MDM2-amplified) expressed the highest level of MDM2 protein, followed by MCF7 cells, which have been reported to over-express MDM2 (Figure 1) ▶ . 32 BCL2 was expressed at highest levels in SKNSH cells, but was absent in SHEP cells as previously reported (Figures 1 and 2b ▶ ▶ G). 34 MYCN was readily detectable in the three MYCN-amplified cell lines (IMR32, NGP, and SKNBE(2c)) (Figure 1) ▶ . 35
p53 Transcriptional Function after Irradiation of Cell Lines
All neuroblastoma cell lines studied with wild-type p53 (ie, SKNSH, SHSY5Y, SHEP, NGP, IMR32 and the MCF7 positive control cell line) showed nuclear accumulation of p53 after 4 Gy irradiation (Table 1 ▶ and Figure 2 ▶ ). In SKNSH, IMR32, and MCF7 cells, DO-1 and Pab1801 were also used for ICC and both of these antibodies also showed predominantly nuclear p53 before and after irradiation (data not shown).
Table 1.
Effect of 4 Gy Irradiation on Mean Maximal Increase in p53 and Related Protein Expression and Time after Irradiation, Clonogenic Survival, and Apoptosis Relative to Untreated Controls in Cell Lines Studied
| Cell line | p53 status | p53* | Hours | MDM2 | Hours | WAF1 | Hours | Clonogenic survival† (%) | Apoptosis‡ (%) maximum (hours) |
|---|---|---|---|---|---|---|---|---|---|
| Neuroblastoma | |||||||||
| SHSY5Y | WT | 11.5 (0.1) | 4–6 | 13.8 (7.9) | 6 | 19.1 (13.9) | 6 | 5.05 (3.64–7.02) | 14.46 (96) |
| SHEP | WT | 2.1 (0.4) | 2 | 4.4 (0.1) | 4–6 | 2.1 (0.9) | 6 | 19.28 (14.00–26.54) | 2.3 (108) |
| SKNSH | WT | 18.6 (10.7) | 4–6 | 15.4 (11.2) | 4–6 | 6.1 (2.4) | 6–24 | 0.66 (0.22–1.97) | 35.31 (24) |
| IMR32 | WT | 24.7 (10.1) | 2 | 4.4 (1.3) | 4–6 | 11.4 (8.6) | 6–24 | 0.10 (0.02–0.41) | 5.64 (48) |
| NGP | WT | 3.4 (2.2) | 2 | 2.0 (1.0) | 4–6 | 8.2 (2.1) | 6–24 | 2.24 (1.62–3.10) | 32.03 (96) |
| SKNBE(2c) | Mut | N/C | N/C | N/D | 16.33 (11.36–23.48) | 7.02 (108) | |||
| Controls | |||||||||
| NB100 | Mut | N/D | N/C | N/D | 8.78 (5.41–14.25) | 13.03 (108) | |||
| MCF7 | WT | 4.9 (1.6) | 4 | 6.4 | 6 | 5.5 (1.6) | 6–24 | 2.15 (1.64–2.81) | 5.55 (108) |
| SAOS2 | Null | N/D | N/C | N/D | 4.28 (3.16–5.80) | 10.93 (108) |
*Mean maximal protein induction (±SD of at least two independent experiments) measured by densitometry relative to control and loading control actin. If <2-fold change = N/C. 50 μg total protein on Western blots.
†Mean (95% confidence interval) of three independent experiments set up in quadruplicate.
‡Apoptosis assessed by nuclear staining with Hoechst 33258. Maximum recorded value of three experiments.
WT, wild-type; Mut, mutant; N/C, no change; N/D, not detectable.
The increase in p53 in SHSY5Y cells was detectable after 1 hour, maximal at 2 to 6 hours, and was still elevated 24 hours after irradiation (Table 1 ▶ and Figure 3a ▶ ). p53 induction varied among the cell lines from 2- to 3-fold in the SHEP and NGP cell lines to 20- to 25-fold in the SKNSH and IMR32 cell lines. The p53 mutant NB100 and null SAOS2 cell lines showed no induction of p53 post irradiation (Table 1) ▶ and the p53 mutant SKNBE(2c) cell line showed no increase above high basal p53 expression (Table 1 ▶ and Figure 3a ▶ ).
Figure 3.

a: Western blots of SHSY5Y (wild-type p53) cells and SKNBE(2c) (mutant p53) cells for p53 and p53 regulated genes after 4 Gy irradiation. Protein expression quantitated by densitometry and measured relative to loading control actin and untreated controls (0 hours) or 1 hour if not detectable at 0 hours. Less than a twofold change in values is not stated (50 μg protein/well). p53+ con = positive control for p53 (recombinant human p53). MDM2 +con = positive for MDM2 (recombinant human MDM2); M, marker, n/d, not detectable. bi: G1/S phase ratio before and 24 hours after 4 Gy irradiation. Mean ± SD of three experiments. bii: Proportion of cells in G2 before and 24 hours after 4 Gy irradiation. Mean ± SD of three experiments. biii: DNA histograms of wild-type p53 SKNSH and IMR32, and mutant p53 SKNBE(2c) neuroblastoma cells, before and 24 hours after 4 Gy irradiation. G1 arrest is shown in SKNSH cells, G2 arrest in IMR32 (MYCN-amplified) cells and no cell cycle arrest in SKNBE(2c) cells.
All wild-type p53 cell lines studied showed that p53 was able to function as a transcription factor and up-regulate the p53 responsive genes WAF1 and MDM2, whereas those cell lines with mutant or null p53 could not (Table 1 ▶ , Figures 2 and 3a ▶ ▶ ). WAF1 and MDM2 were induced from 4 hours, and MDM2 peaked at 4 or 6 hours after irradiation. WAF1 remained elevated 24 hours after irradiation in all cell lines with wild-type p53, whereas MDM2 had returned to pretreatment levels by this time (Figure 3a) ▶ . The relative increase in WAF1 varied from twofold in SHEP cells to 19-fold in SHSY5Y, and for MDM2, from twofold in the MDM2-amplified NGP cell line, to 15-fold in SKNSH cells (Table 1) ▶ . BAX expression increased more than twofold in two cell lines with wild-type p53-SKNSH and IMR32, and there was a reduction in BCL2 expression only in IMR32 and p53 null SAOS2 cells (data not shown). There was no change in MYCN expression after irradiation in any of the cell lines studied with MYCN amplification (data not shown).
Cell Cycle Arrest and Apoptosis after Irradiation of Cell Lines
Cell cycle analysis showed that three wild-type p53 neuroblastoma cell lines (SKNSH, SHSY5Y, and SHEP) and MCF7 cells underwent strong G1 arrest, as shown by an increase in G1/S ratio at 24 hours compared with control, and the DNA histograms (Figure 3b ▶ , i and iii). Two cell lines with wild-type p53, IMR32 and NGP, did not show G1 arrest despite evidence of WAF1 induction, however they underwent a striking G2 arrest, as shown by the DNA histograms and an increased proportion of cells in G2 at 24 hours compared with control (Figure 3b ▶ ii and iii). Mutant p53 NB100 and null p53 SAOS2 cells did undergo some G2 arrest but it was not as strong as IMR32 and NGP (Figure 3b, ii) ▶ .
Apoptosis as measured by Hoechst nuclear staining was detectable from 6 hours after irradiation and measured up to 108 hours later (Table 1) ▶ . Using analysis of variance, the rate of induction of apoptosis ie, the slope of the apoptosis versus time curve, the maximum value and the time from irradiation at which the maximum value occurred, were compared in cell lines wild-type or mutant for p53. After allowing for differences between individual cell lines, there was no significant difference between cell lines that were wild-type and those that were mutant for p53 (rate of induction, P = 0.66; maximum value, P = 0.40; and time of maximal induction, P = 0.30). Clonogenic survival varied between cell lines in response to 4 Gy irradiation with IMR32 cells being the most sensitive and SHEP cells the most resistant (Table 1) ▶ . Comparing the clonogenic survival between individual cell lines using a Poisson log-linear rates model, there was no significant difference between cell lines that were mutant and those that were wild-type for p53 (P = 0.08).
Histology, p53 Sequencing, ICC, and Irradiation of Primary Neuroblastoma Tumors
Tumor 1 was a Schwannian stroma-poor (<50% tumor tissue), differentiating neuroblastoma with >5% neuronal differentiation toward ganglion cells and calcification (favorable histology; International Neuroblastoma Pathology Classification) 36 (Table 2) ▶ . Tumor 2 was a Schwannian stroma-poor, poorly-differentiated neuroblastoma, with a high (327/5000) mitosis-karyorrhexis index and no calcification (unfavorable histology) (Figure 4 ▶ and Table 2 ▶ ). Tumor 3 was a nodular ganglioneuroblastoma (unfavorable histology). A non-nodular area of stroma-rich, differentiating neuroblastoma was studied, but there was insufficient material to study a nodule as well (Figure 4 ▶ and Table 2 ▶ ).
Table 2.
Characteristics of the Three Primary Neuroblastoma Tumors Irradiated
| Tumor identity | Age of patient (yr) | Stage | Genetics | p53 status | Histology* | p53 DO-7 LI % | p53 DO-1 LI % | p53 1801 LI % | Ki67 LI % |
|---|---|---|---|---|---|---|---|---|---|
| 1 | 2 | 1 | Non-MYCN amplified | WT | >5% Differentiating, stroma poor, calcification (favorable) | 3 | 3 | 0 | 13 |
| 2 | 2 | 4 | MYCN amplified, 1p deleted | WT | Poorly differentiated, high MKI, stroma poor (unfavorable) | 74 | 33 | 9 | 86 |
| 3 | 2 | 4 | Non-MYCN amplified | WT | Ganglioneuroblastoma, nodular (unfavorable), stroma rich part studied | 3 | 1 | <1 | 15 |
*International Neuroblastoma Pathology Classification.
LI, labeling index; WT, wild type; MKI, mitosis karyorrhexis index.
Figure 4.

A and B: Hematoxylin and eosin stained sections of tumors 2 and 3 showing mitotic and apoptotic cells in A (arrows). C and D: Control immunostained sections without primary antibodies of tumors 2 and 3 showing apoptotic cells in C (arrows). E and F: Immunostaining of tumors 2 and 3 with p53 DO-7 antibody showing many cells with heterogeneous nuclear immunostaining in E and a few weakly positive cells in F (brown staining) (original magnification, ×200).
Genomic sequencing of DNA from the three primary tumors revealed that they were all wild-type for p53. In tumor 2 the previously described polymorphism in codon 72 was found. ICC of sections from formalin-fixed, paraffin-embedded blocks from the tumors showed that only tumor 2 expressed significant amounts of nuclear p53 with the three different p53 antibodies (Figure 4 ▶ and Table 2 ▶ ), together with high Ki67 (a proliferation marker) expression (Table 2) ▶ . In contrast, tumors 1 and 3 expressed low levels of nuclear p53 and Ki67. In tumor 1 some differentiating neuroblastoma cells did express cytoplasmic p53 with all three antibodies, but cytoplasmic staining was also present in the control without primary antibody (data not shown) and p53 was undetectable on Western blotting (Figure 5) ▶ , suggesting this was nonspecific binding to neuropil.
Figure 5.

p53 and related protein expression in three short-term primary neuroblastoma tumor cell cultures before and 6 hours after 4 Gy irradiation. Protein expression quantitated by densitometry and measured relative to loading control actin and untreated controls. If no there was no detectable protein in control, then the absolute value for treated is shown. We used IMR32 cells 6 hours after irradiation as a positive control (50 μg protein/well). Rx, treatment; n/d, not detectable.
After treatment with 4 Gy irradiation only the poorly differentiated MYCN-amplified neuroblastoma (tumor 2) showed induction of p53 and p53 regulated genes (Figure 5) ▶ . p53 expression increased by a mean of ninefold (range, 3–13, n = 4), 6 hours after irradiation with concomitant detection of WAF1 and a 90kd MDM2 protein, but no change in MYCN expression. The 2 differentiating neuroblastomas (tumors 1 and 3) did not express p53, MYCN, or a 90-kd MDM2 protein by Western blotting before or after irradiation, but there was baseline expression of WAF1, which was unchanged following irradiation (Figure 5) ▶ . BCL2 and BAX expression were unchanged after irradiation in all of the tumors studied (data not shown).
Discussion
Wild-type p53 has been reported to accumulate in neuroblastoma 9 and, because of the potentially lethal effects of functional p53 in terms of induction of apoptosis, p53 is presumed to be inactive in this tumor. This study investigated the hypothesis that p53 accumulation in neuroblastoma, in the absence of mutation, is associated with functional inactivation, which interferes with downstream mediators of p53 function.
Five neuroblastoma cell lines studied were found to be p53 wild-type (SKNSH, SHSY5Y, SHEP, IMR32, and NGP), after sequencing exons 4–10 of p53 cDNA. p53 mutations outside exons 4–9 are rare, 3,4 which is consistent with the structure and function of p53 and where mutations leading to functional inactivation would be expected. 3
In wild-type p53 neuroblastoma cell lines immunofluorescence studies have reported the cellular localization of p53 in untreated cells to be wholly cytoplasmic, 17 cytoplasmic in N type cells and both nuclear and cytoplasmic in S type cells, 18 or wholly nuclear. 15,16 Most studies reporting cytoplasmic p53 used the 1801 antibody, which is believed to cross-react. 15 In the current study, three different methods of cell preparation were used for ICC, which gave similar results showing predominantly nuclear p53 in wild-type p53 neuroblastoma cell lines with three different antibodies (DO-7, DO-1, and 1801). In neuroblastoma cells grown on glass slides, some cytoplasmic p53 was detectable with all three antibodies. However, the presence of punctate cytoplasmic staining in controls without primary antibodies, particularly in N type SKNSH cells, suggests that some of this may be nonspecific binding to neuropil produced by neuroblastoma. Cell fractionation studies have also been used to localize p53 in neuroblastoma and studies report both nuclear and cytoplasmic p53, 17-20 particularly in N type cells, whereas S type cells have been reported to have mainly nuclear p53. 18,37 It is likely that p53 in neuroblastoma is both nuclear and cytoplasmic, but predominantly nuclear, and the ease of detecting one or the other may be determined by the nuclear to cytoplasmic ratio of the cell and the amount of neuropil produced.
Although p53 was detectable in all wild-type p53 cell lines, WAF1 was only detectable in SHEP and MCF7 cells, suggesting that, under normal growth conditions, apparent over-expression of wild-type p53 in most neuroblastoma cell lines is not up-regulating WAF1, and is consistent with active cellular proliferation. This situation is analogous to F9 murine teratocarcinoma cells, which have been reported to express high basal levels of p53 but low levels of WAF1 and MDM2, and it has been shown that the p53 is inactive unless DNA damage occurs. 38 Neuroblastoma cells treated with 4 Gy ionizing radiation show further accumulation of p53 protein and transcriptional activation of target genes, particularly WAF1 and MDM2 consistent with previous studies. 16,19 These effects all occur in a similar time course and manner to MCF7 cells, which were used as positive control, as they have previously been shown to have functional wild-type p53. 24
p53 induction in SHEP cells was less than other wild-type p53 neuroblastoma cell lines. They failed to undergo apoptosis, consistent with previous reports, 18,37 despite lacking BCL2, and were the most resistant cell line in clonogenic assays. The low level of apoptosis and radiation resistance of SHEP cells probably accounts for the failure to detect a significant difference between apoptosis and clonogenicity in mutant p53 cell lines compared with the wild-type ones studied in this report. In the MDM2-amplified cell line NGP, the induction of p53 and p53 responsive genes was also less than for the other wild-type p53 cell llines suggesting attenuation of p53 transcriptional function by MDM2 amplification, an effect observed in another MDM2-amplified neuroblastoma cell line NB-1691. 16
Four out of six cell lines with wild-type p53 underwent G1 arrest (SHSY5Y, SHEP, SKNSH, and MCF7) 24 hours after irradiation, whereas the other two wild-type p53 cell lines (IMR32 and NGP) failed to show evidence of G1 arrest despite induction of WAF1 at this time. Lack of G1 arrest after irradiation despite induction of WAF1 has previously been reported in a Burkitt’s lymphoma cell line, 39 in which it has been shown that this results from instability of WAF1. In the current study WAF1 expression remained maximally elevated 24 hours after irradiation in both IMR32 and NGP cells. Both these cell lines did, however, undergo strong G2 arrest, unlike the mutant or null p53 cell lines, which did not arrest strongly in G2 or G1. IMR32 and NGP were the only MYCN-amplified wild-type p53 cell lines, and this may have affected cell cycle distribution. It is possible that MYCN overexpression in the MYCN-amplified cell lines is able to override the effect of WAF1 and impair G1 arrest. Overexpression of c-myc has been recently shown to cause p53- and WAF1-dependent G2 arrest of normal fibroblasts. 40 MYCN-transfected SHEP cells have increased DNA synthesis, a shortened G1 phase, and accelerated G0 to S progression after mitogenic stimulation, 41 and recent evidence suggests that activation of MYCN in neuroblastoma causes an increase in the retinoblastoma protein inhibitor, Id2, leading to cell cycle progression. 42
The p53 response pathway was also studied in three wild-type p53 tumors in short term culture. p53 was iduced after ex vivo irradiation of the poorly-differentiated tumor, together with upregulation of MDM2 and WAF1, but not in the two differentiating tumors in which there was baseline expression of WAF1, consistent with cell growth arrest, which did not change following irradiation. These preliminary findings need to be confirmed by a much larger study of ex-vivo neuroblastomas. Nevertheless, low level p53 expression in differentiating neuroblastoma is consistent with cell line studies showing a reduction in p53 expression following retinoic acid induced differentiation, 9,13 and pretreatment of neuroblastoma cell lines with retinoic acid confers resistance to p53 dependent apoptosis. 43,44 If p53 function is impaired in differentiating neuroblastoma, it may have implications for the design of clinical trials of neuroblastoma where differentiation agents, such as retinoids, are used alongside conventional chemotherapy. Furthermore, tumor 3 was a nodular ganglioneuroblastoma, a tumor composed of hemorrhagic neuroblastic nodules coexisting with a stroma rich ganglioneuroblastoma component. 36 Nodular ganglioneuroblastoma carries a poor prognosis, which is thought to be due to the presence of biologically aggressive clones. If the differentiating component of these tumors can resist p53-dependent cytotoxic therapy, and later de-differentiate, this would provide a route for subsequent relapse. In the absence of continued differentiation stimuli in vitro, neuroblastoma cells de-differentiate and begin to proliferate. 45 Transdifferentiation of neuroblastoma cell lines from the N to the S type and vice versa 46 can occur spontaneously resulting in altered sensitivity to cytotoxic agents including irradiation as reported here.
In conclusion, this study examined the p53 pathway in detail after irradiation in six human neuroblastoma cell lines and three ex vivo tumors. p53 transcriptional function was shown to be intact in neuroblastoma cell lines with wild-type p53, and the poorly-differentiated neuroblastoma in short term culture. The lack of G1 arrest despite WAF1 induction in two MYCN-amplified wild-type p53 neuroblastoma cell lines is suggestive of an abnormality downstream of p53 in MYCN-amplified cells which warrants further study.
Acknowledgments
We thank June Biedler and Barbara Spengler (Fordham University, New York) for SKNBE(2c) cells, Rogier Versteeg (Amsterdam University, Netherlands) for NGP cells, Penny Lovat (Newcastle University, UK) for IMR32, NB100, SKNSH, SHSY5Y, and SHEP cells, Ximena Montano (Cancer Research Unit (CRU), Newcastle University) for SAOS2 cells and the p53 DO-1 antibody, Mike Roberts (CRU) for MCF7 cells, Nick Bown, (Human Genetics, Newcastle University) for karyotyping the cell lines, Helen Atkins (CRU) for sequencing the tumors and Wendy Scaife (CRU) for helping sequencing the cell lines. We are very grateful to Nao Igekaki, (Philadelphia, PA) for the MYCN antibody and to NovoCastra (Newcastle) for their antibodies. Huiling Liang (CRU) provided the Baculovirus p53 protein, and John Anderson (Pathology, Newcastle University) provided the recombinant MDM2 protein. Dick Variend and Catherine Cullinane, (Consultant Pediatric Pathologists, UK) reviewed the neuroblastoma histology.
Footnotes
Address reprint requests to Dr. D. A. Tweddle, Cancer Research Unit, The Medical School, Framlington Place, University of Newcastle, Newcastle-upon-Tyne, NE2 4HH, UK. E-mail: d.a.tweddle@newcastle.ac.uk.
Supported by the North of England Children’s Cancer Research Fund and the UK Cancer Research Campaign.
References
- 1.Pearson ADJ, Philip T: Prognosis of low-risk and high-risk neuroblastoma. Brodeur GM Sawada T Tsuchida Y Voute PA eds. Neuroblastoma. 2000, :pp 551-570 Elsevier Science, Amsterdam, The Netherlands Amsterdam [Google Scholar]
- 2.Tweddle DA, Pinkerton CR, Lewis IJ, Ellershaw C, Cole M, Pearson ADJ: OPEC/OJEC for stage 4 neuroblastoma over 1 year of age. Med Pediatr Oncol 2001, 36:239-242 [DOI] [PubMed] [Google Scholar]
- 3.Levine A: p53, the cellular gatekeeper for growth and division. Cell 1997, 88:323-331 [DOI] [PubMed] [Google Scholar]
- 4.Kirsch D, Kastan M: Tumour suppressor p53: implications for tumor development and prognosis. J Clin Oncol 1998, 16:3158-3168 [DOI] [PubMed] [Google Scholar]
- 5.Vogan K, Bernstein M, Leclerc J-M, Brisson L, Brossard J, Brodeur G, Pelletier J, Gros P: Absence of p53 gene mutations in primary neuroblastoma. Cancer Res 1993, 53:5269-5273 [PubMed] [Google Scholar]
- 6.Komuro H, Hayashi Y, Kawamura M, Hayashi K, Kaneko Y, Kamoshita S, Hanada R, Yamamoto K, Hongo T, Yamada M, Tsuchida Y: Mutations of the p53 gene are involved in Ewing’s sarcomas but not in neuroblastomas. Cancer Res 1993, 53:5284-5288 [PubMed] [Google Scholar]
- 7.Imamura J, Bartram C, Berthold F, Harms D, Nakamura H, Koeffler H: Mutation of the p53 gene in neuroblastoma and its relationship with N-myc amplification. Cancer Res 1993, 53:4053-4058 [PubMed] [Google Scholar]
- 8.Hosoi G, Hara J, Okamura T, Osugi Y, Ishihara S, Fukuzawa M, Okada A, Okada S, Tawa A: Low frequency of the p53 gene mutations in neuroblastoma. Cancer 1994, 73:3087-3093 [DOI] [PubMed] [Google Scholar]
- 9.Davidoff A, Pence J, Shorter N, Inglehart J, Marks J: Expression of p53 in neuroblastoma and neuroepithelioma-derived cell lines. Oncogene 1992, 7:127-133 [PubMed] [Google Scholar]
- 10.Layfield L, Thompson J, Dodge R, Kerns B: Prognostic Indicators for neuroblastoma: stage, grade, DNA ploidy, MIB-1 proliferation index, p53, HER-2/neu and EGFr: a survival study. J Surg Oncol 1995, 59:21-27 [DOI] [PubMed] [Google Scholar]
- 11.Hoehner J, Gestblom C, Olsen L, Pahlman S: Spatial association of apoptosis-related gene expression and cellular death in clinical neuroblastoma. Br J Cancer 1997, 75:1185-1194 [DOI] [PMC free article] [PubMed] [Google Scholar]
- 12.Levitsky K, Chandrasekaran K, Mora P, Simmons D: Immunoaffinity chromatography of a cellular tumor antigen from mouse neuroblastoma cells. Int J Cancer 1983, 32:597-602 [DOI] [PubMed] [Google Scholar]
- 13.Sidell N, Koeffler H: Modulation of Mr 53,000 protein with induction of differentiation of human neuroblastoma cells. Cancer Res 1988, 48:2226-2230 [PubMed] [Google Scholar]
- 14.Moll U, LaQuaglia M, Benard J, Riou G: Wild-type p53 undergoes cytoplasmic sequestration in undifferentiated neuroblastomas but not differentiated tumors. Proc Natl Acad Sci USA 1995, 92:4407-4411 [DOI] [PMC free article] [PubMed] [Google Scholar]
- 15.Smart P, Lane EB, Lane DP, Midgely C, Vojtesek B, Lain S: Effects on normal fibroblasts and neuroblastoma cells of the activation of the p53 response by the nuclear export inhibitor leptomycin B. Oncogene 1990, 18:7378-7386 [DOI] [PubMed] [Google Scholar]
- 16.McKenzie PP, Guichard SM, Middlemas DS, Ashmun RA, Danks MK, Harris LC: Wild-type p53 can induce p21 and apoptosis in neuroblastoma cells but the DNA damage-induced G1 checkpoint function is attenuated. Clin Cancer Res 1999, 5:4199-4207 [PubMed] [Google Scholar]
- 17.Moll U, Ostremeyer A, Haladay R, Winkfield B, Frazier M, Zambetti G: Cytoplasmic sequestration of wild-type p53 impairs the G1 checkpoint after DNA damage. Mol Cell Biol 1996, 16:1125-1137 [DOI] [PMC free article] [PubMed] [Google Scholar]
- 18.Isaacs J, Hardman R, Carman T, Barrett J, Weissman B: Differential subcellular p53 localization and function in N- and S- type neuroblastoma cell lines. Cell Growth Differ 1998, 9:545-555 [PubMed] [Google Scholar]
- 19.Goldman S, Chen C-Y, Lansing T, Gilmer T, Kastan M: The p53 signal transduction pathway is intact in human neuroblastoma despite cytoplasmic location. Am J Pathol 1996, 148:1381-1385 [PMC free article] [PubMed] [Google Scholar]
- 20.Ronca F, Chan S, Yu V: 1-(5-Isoquinolinesulfonyl)-2-methylpiperazine induces apoptosis in human neuroblastoma cells SHSY5Y through a p53 dependent pathway. J Biol Chem 1997, 272:4252-4260 [DOI] [PubMed] [Google Scholar]
- 21.Tumilowicz J, Nichols WW, Cholon J, Greene A: Definition of a continuous human cell line derived from neuroblastoma. Cancer Res 1970, 30:2110-2118 [PubMed] [Google Scholar]
- 22.Biedler JL, Roffler-Tarlov S, Schachner M, Freedman LS: Multiple neurotransmitter synthesis by human neuroblastoma cell lines and clones. Cancer Res 1978, 38:3751-3757 [PubMed] [Google Scholar]
- 23.Brodeur GM, Sekhon GS, Goldstein MN: Chromosomal aberrations in human neuroblastomas. Cancer 1977, 40:2256-2263 [DOI] [PubMed] [Google Scholar]
- 24.O’Connor P, Jackman J, Bae I, Myers T, Fan S, Mutoh M, Scudiero D, Monks A, Sausville E, Weinstein J, Friend S, Fornace A: Characterization of the p53 tumor suppressor pathway in cell lines of the National Cancer Institute anticancer drug screen and correlation with the growth inhibitory potency of 123 anti-cancer agents. Cancer Res 1997, 57:4285-4300 [PubMed] [Google Scholar]
- 25.Schlesinger HR, Gerson JM, Moorhead PS, Maguire H, Hummeler K: Establishment and characterisation of human neuroblastoma cell lines. Cancer Res 1976, 36:3094-3100 [PubMed] [Google Scholar]
- 26.Diller L, Kassel J, Nelson CE, Gryka MA, Litwak G, Gebbhardt M: p53 functions as a cell cycle control protein in osteosarcomas. Mol Cell Biol 1990, 10:5772-5781 [DOI] [PMC free article] [PubMed] [Google Scholar]
- 27.Abdel-Fattah R, Challen C, Griffiths TRL, Robinson MC, Neal DE, Lunec J: Alterations of TP53 in microdissected transitional cell carcinoma of the human urinary bladder: high frequency of TP53 accumulation in the absence of detectable mutations is associated with poor prognosis. Br J Cancer 1998, 77:2230-2238 [DOI] [PMC free article] [PubMed] [Google Scholar]
- 28.Laemmli U: Cleavage of structural proteins during the assembly of the head of bacteriophage T4. Nature 1970, 227:680-685 [DOI] [PubMed] [Google Scholar]
- 29.Ikegaki N, Bukovsky J, Kennett RH: Identification and characterisation of the NMYC product in human neuroblastoma cells by monoclonal antibodies with defined specificities. Proc Natl Acad Sci USA 1986, 83:5929-5933 [DOI] [PMC free article] [PubMed] [Google Scholar]
- 30.Ormerod MG: Flow Cytometry: A Practical Approach. 1990. IRL Press, Edited by D Rickwood and BD Hames. The Practical Approach Series. Oxford
- 31.Corvi R, Savelyeva L, Breit S, Wenzel A, Handgretinger R, Barak J, Oren M, Amler L, Schwab M: Non-syntenic amplification of MDM2 and MYCN in neuroblastoma. Oncogene 1995, 10:1081-1086 [PubMed] [Google Scholar]
- 32.Freedman DA, Levine AJ: Regulation of the p53 protein by the MDM2 oncoprotein-Thirty-eighth G.H.A Clowes Memorial Award Lecture. Cancer Res 1999: 1–7 [PubMed]
- 33.Kaghad M, Bonnet H, Yang A, Creancier L, Biscan J, Valent A, Minty A, Chalon P, Lelias J, Dumont X, Ferrara P, McKeon F, Caput D: Monoallelically expressed gene related to 1p36, a region frequently deleted in neuroblastoma and other human cancers. Cell 1997, 90:809-819 [DOI] [PubMed] [Google Scholar]
- 34.Reed J, Meister L, Tanaka S, Cuddy M, Yum S, Geyer C, Pleasure D: Diferential expression of bcl2 protooncogene in neuroblastoma and other human tumor cell lines of neural origin. Cancer Res 1991, 51:6529-6538 [PubMed] [Google Scholar]
- 35.Reynolds CP, Tomayko MM, Doner L, Helson L, Seeger RC, Triche TJ, Brodeur GM: Biological classification of cell lines derived from human extra-cranial neural tumors. Prog Clin Biol Res 1988, 271:291-306 [PubMed] [Google Scholar]
- 36.Shimada H, Ambros I, Dehner L, Hata J, Joshi V, Roald B: Terminiology and morphologic criteria of neuroblastic tumors: recommendations by the international neuroblastoma pathology committee. Cancer 1999, 86:349-363 [PubMed] [Google Scholar]
- 37.Jasty R, Lu J, Irwin T, Suchard S, Clarke M, Castle V: Role of apoptosis in the regulation of irradiation induced apoptosis in neuroblastoma cells. Mol Gen Metab 1998, 64:155-164 [DOI] [PubMed] [Google Scholar]
- 38.Lutzker S, Levine A: A functionally inactive p53 protein in teratocarcinoma cells is activated by either DNA damage or cellular differentiation. Nat Med 1996, 2:804-810 [DOI] [PubMed] [Google Scholar]
- 39.Bae I, Fan S, Bhatia K, Kohn K, Fornace AJ, O’Connor PM: Relationships between G1 arrest and stability of the p53 and p21 proteins following γ-irradiation of human lymphoma cells. Cancer Res 1995, 55:2387-2393 [PubMed] [Google Scholar]
- 40.Felsher DW, Zetterberg A, Zhu J, Tlsty T, Bishop JM: Overexpression of MYC causes p53-dependent G2 arrest of normal fibroblasts. Proc Natl Acad Sci USA 2000, 97:10544-10548 [DOI] [PMC free article] [PubMed] [Google Scholar]
- 41.Lutz W, Stohr M, Schurmann J, Wenzel A, Lohr A, Schwab M: Conditional expression of N-myc in human neuroblastoma cells increases expression of alpha-prothymosin and ornithine decarboxylase and accelerates progression into S-phase after early mitogenic stimulation of quiescent cells. Oncogene 1996, 13:803-812 [PubMed] [Google Scholar]
- 42.Lasorella A, Noseda M, Beyna M, Iavarone A: Id2 is a retinoblastoma protein target and mediates signalling by Myc oncoproteins. Nature 2000, 407:592-598 [DOI] [PubMed] [Google Scholar]
- 43.Ronca F, Yee KSY, Yu VC: Retinoic acid confers resistance to p53-dependent apoptosis in SHSY5Y neuroblastoma cells by modulating nuclear import of p53. J Biol Chem 1999, 274:18128-18134 [DOI] [PubMed] [Google Scholar]
- 44.Tieu K, Zuo DM, Yu PH: Differential effects of staurosporine and retinoic acid on the vulnerability of the SHSY5Y neuroblastoma cells: involvement of Bcl-2 and p53 proteins. J Neurosci Res 1999, 58:426-435 [PubMed] [Google Scholar]
- 45.Reynolds CP, Kane DJ, Einhorn PA, Matthay KK, Crouse VL, Wilbur JR, Shurin SB, Seeger RC: Response of neuroblastoma to retinoic acid in vitro and in vivo. Prog Clin Biol Res 1991, 366:203-211 [PubMed] [Google Scholar]
- 46.Ross RA, Spengler BA, Biedler JL: Coordinate morphological and biochemical interconversion of human neuroblastoma cells. J Natl Cancer Inst 1983, 71:741-749 [PubMed] [Google Scholar]