

Abstract
Purpose
The purpose of this study was to examine the possibility that all-trans-retinoic acid (RA) in the eye is a signal related to changes in scleral extracellular matrix in a primate model of postnatal eye growth.
Methods
Juvenile marmosets (Callithrix jacchus) were divided into two experimental groups based on their response to monocular deprivation with diffusers: group 1, treated eyes becoming longer than fellow control eyes (n = 8), and group 2, treated eyes becoming shorter than control eyes (n = 7). Eyes were enucleated, dissected, and assayed for changes in the rates of scleral glycosaminoglycan (GAG) synthesis and ocular RA synthesis. The rate of incorporation of 35SO4 into CPC-precipitable GAG in scleras was taken as a measure of the rate of synthesis of proteoglycans. In the same eyes the rate of RA synthesis in vivo was measured separately in the retina and the choroid/RPE (choroid with RPE attached) by HPLC. The effect of RA on the rate of scleral GAG synthesis was also examined in tissue-cultured pieces of sclera from additional marmosets.
Results
Induced changes in vitreous chamber length in diffuser-treated eyes correlated inversely with the rate of scleral GAG synthesis (P < 0.05) and directly correlated with the rate of RA synthesis measured separately in the retina (P < 0.05) and the choroid/RPE (P < 0.05). In group 1, the rate of scleral GAG synthesis was significantly lower (P < 0.01) in the treated eyes relative to control eyes, and the rate of RA synthesis in both the retina and the choroid/RPE was significantly higher (P < 0.01). In group 2, the rates of scleral GAG synthesis and RA synthesis in either the retina or choroid/RPE were not found to change significantly in the treated eyes compared with the control eyes. RA partially reduces the rate of scleral GAG synthesis in tissue-cultured primate sclera in a dose-dependent manner after several days.
Conclusions
RA may play a role in the visual control of postnatal eye growth in primates, possibly by inducing changes in scleral extracellular matrix associated with increasing eye size. Decreasing growth rate below control levels may involve other mechanisms.
Research involving animal models has established that visual feedback is involved in the control of postnatal eye growth and the development of the refractive state in several species, including nonhuman primates (e.g., Refs. 1-6 and, for a recent review, see Ref. 7). Several studies support the hypothesis that the growth response to visual input is largely local to the eye.8-10 Consequently, the visual control of eye size and refractive state probably involves a cascade of biochemical signals that arise from the processing of visual input by the retina. Through an unknown number of steps, these signals must pass through the retinal pigmented epithelium (RPE) and choroid and into the sclera, ultimately altering eye size and refractive state.11
There is accumulating evidence from studies in mammals (tree shrews and marmosets) that an increase in the turnover of scleral extracellular matrix occurs during increasing eye size and induced myopia (for a review, see Ref. 11). The sclera in these larger eyes is thinner relative to control eyes (Norton TT, et al. IOVS 1996;37:ARVO Abstract S324),12,13 whereas DNA synthesis is unchanged,13,14 synthesis of extracellular matrix proteins are reduced,13-16 and protease activity is increased.18 These changes are most likely related to altered biomechanical properties reported in tree shrew sclera.12,18 Whether any of these scleral changes are the cause or effect of changing eye size is still to be determined, but taken together the evidence suggests that the mechanism underlying induced myopia in mammals (and possibly the visual regulation of eye size) may involve modulating the sclera’s ability to respond to other forces that may drive changes in eye size. Such forces include intraocular pressure,19-26 the effects of accommodation,20,21,27,28 or extraocular muscle activity.21,29,30
Defining the biochemical pathways underlying the control of eye growth is complicated by species differences in the way eyes compensate for imposed defocus produced by positive or negative lenses. In mammals, there is scleral thinning, whereas in chicks, the sclera actively grows. This difference is presumably based in anatomic differences between the scleras of mammals and chicks. Typical mammalian sclera is composed of a single fibrous layer of dense regular connective tissue. In chick, the sclera is composed of an inner cartilaginous and an outer fibrous layer, and experimentally induced increases in eye size and myopia are associated with growth in the cartilaginous layer (measured as increased tissue mass, increased protein synthesis, and increased synthesis of proteoglycans).31-34 The outer fibrous layer has been reported to decrease in thickness and reduce the rate of proteoglycan synthesis,35 similar to the mammalian sclera.
Many substances may be involved in the signal cascade controlling eye size. During the development of induced myopia, several biochemical changes have been reported in the retina,36-42 the RPE and choroid,43-45 and the sclera.11,14,35,46-48 How these changes are related to induced myopia and whether any are actually part of the mechanism underlying the associated change in eye size is uncertain. In both mammals (marmosets and guinea pigs) and chicks, evidence suggests that all-trans-retinoic acid (RA), a potent inhibitor of scleral glycosaminoglycan (GAG) synthesis, is involved in the regulation of eye size. Like the scleral changes observed in experimental myopia, there are species-specific differences in how changes in RA synthesis are related to induced changes in eye size and refraction (see Fig. 1). In the original study of chicks,43 the rate of RA synthesis in the choroid with RPE attached (choroid/RPE) decreased in eyes growing faster than normal and becoming myopic, and increased in eyes growing slower than normal and becoming hyperopic. In a recent study of guinea pigs49 induced axial myopia was associated with an increase in RA concentration in undissociated choroid/RPE, exactly opposite to that in chicks. In a preliminary study in marmosets (Mertz JR, et al. IOVS 2001;42:ARVO Abstract 56) the rate of RA synthesis in choroid/RPE was found to increase in eyes with induced axial myopia relative to untreated control eyes. This species difference between chicks and mammals in RA synthesis with induced changes in eye size is consistent with the differences in scleral GAG changes associated with increased vitreous chamber depth, given the inhibitory effect of RA on GAG synthesis rates in vitro.43 A decrease in the rate of RA synthesis in chick eyes with induced myopia could increase the rate of scleral GAG synthesis associated with those eyes, whereas an increase in the rate of RA synthesis in the eyes of mammals with induced myopia could be responsible for the observed decrease in scleral GAG synthesis rates observed in those eyes.
FIGURE 1.

Mean (±SD) RA in the choroid/RPE of form-deprived eyes relative to the fellow untreated control eyes are replotted from three earlier studies. Chick data are replotted from Mertz and Wallman.43 Marmoset data are from Mertz et al. (IOVS 2001;42:ARVO Abstract 56). Guinea pig data are replotted from McFadden et al.49 In all three studies, the RA in the form-deprived eyes was significantly different from the controls and the effect in chick is opposite to that in marmosets or guinea pigs. The rate of RA synthesis (converted to picomoles per hour) was measured in the studies of chicks and marmosets. RA concentration (measured as micrograms per gram wet weight) was measured in the study using guinea pigs.
In this study, we examined the relationship between the rates of synthesis of RA and scleral GAGs in marmoset eyes undergoing different rates of growth in response to form deprivation. The marmoset is a New World primate with eyes that possess all the morphologic characteristics of human eyes50 and are susceptible to visual manipulations of eye size and refractive state.6,51-56 We also examine the effect of RA on marmoset sclera in vitro. Some of the data presented herein have been published in abstract form (Mertz JR, et al. IOVS 2001;42:ARVO Abstract 56; Troilo D, et al. IOVS 2004;45: ARVO E-Abstract 1235).57,58
MATERIALS AND METHODS
Animals and Experimental Manipulations
A total of 25 common marmosets were used in the study. All animals were bred and housed in groups in our animal facility (for details, see Ref. 54). The care and use of the animals in this study conformed to USDA standards and the ARVO Statement for the Use of Animals in Ophthalmic and Vision Research.
Eye size was altered in one eye of 15 marmosets by monocular form deprivation with translucent diffusers mounted using a system similar to that described by Graham and Judge.56 Deprivation began at 52 ± 21 (mean ± SD) days of age and lasted for 62 ± 36 days. Earlier studies showed that form deprivation by lid suture produced myopia that persisted well after the end of the visual manipulation,51,53 but when a diffuser paradigm was used on juvenile marmosets, the responses were variable, and after removal of the diffuser, various degrees of recovery from myopia were observed.54 We took advantage of this variability to examine different growth responses, increased growth shifting the eyes toward myopia, and decreased growth shifting them toward hyperopia. Refractive states and the vitreous chamber depths of the eyes were monitored at 2- to 3-week intervals until changes between the treated and control eyes were detected (for details of optometric procedures, see Ref. 54). The animals were divided into two groups based on the interocular difference in vitreous chamber depth: group 1, treated eyes longer than fellow control eyes (n = 8), and group 2, treated eyes shorter than control eyes (n = 7; Table 1). After a change in vitreous chamber depth was first detected, the animals were raised for another 2 to 4 weeks, at which time they were measured again and then euthanatized by an overdose of pentobarbital. In some animals, the diffusers became loose, and the deprivation had to be discontinued early. These animals were monitored for several weeks more and euthanatized when changes in axial length were detected. After euthanasia, the eyes were enucleated immediately for processing. The retina, choroid/RPE, and sclera were dissected, and the rates of synthesis of RA (retina and choroid/RPE) and GAGs (sclera) were measured.
TABLE 1.
Experimental Subjects Categorized and Rank Ordered by the Induced Change in Vitreous Chamber Depth in the Treated Eye Relative to That in the Control Eye
| Subject | Start of Deprivation (days of age) | Duration (d) | Age at Biochemistry (days of age) | Refraction (D) (Treated - Control) | VC Depth (mm) (Treated - Control) |
|---|---|---|---|---|---|
| Group 1: increasing growth of treated eye | |||||
| O6 | 48 | 21 | 69 | -6.0 | 0.41 |
| L4 | 89 | 51 | 140 | -5.8 | 0.24 |
| J5 | 71 | 50 | 138 | -2.0 | 0.23 |
| N6 | 48 | 21 | 69 | -4.5 | 0.22 |
| M4 | 89 | 41 | 174 | -0.4 | 0.12 |
| N5 | 57 | 30 | 122 | 0.3 | 0.07 |
| L5 | 57 | 44 | 122 | 0.5 | 0.06 |
| H6 | 31 | 87 | 118 | -2.5 | 0.05 |
| Mean ± SD | 61.2 ± 19.2 | 43.1 ± 20 | 119 ± 33.2 | -2.6 ± 2.5 | 0.17 ± 0.12 |
| Group 2: decreasing growth of treated eye | |||||
| M5 | 57 | 44 | 122 | -0.6 | -0.03 |
| K5 | 71 | 85 | 156 | -1.0 | -0.07 |
| R6 | 41 | 131 | 172 | 5.5 | -0.09 |
| S6 | 41 | 131 | 172 | 1.6 | -0.10 |
| G6 | 31 | 87 | 119 | 2.9 | -0.15 |
| Sb | 99 | 18 | 117 | 1.8 | -0.17 |
| A6 | 38 | 70 | 122 | 7.9 | -0.54 |
| Mean ± SD | 54 ± 21.2 | 92.6 ± 55 | 140 ± 23.7 | 2.6 ± 3.0 | -0.16 ± 0.16 |
GAG Assay
The rate of GAG synthesis was determined by measuring the amount of 35SO4 incorporated into the sclera during tissue culture. Immediately after enucleation and dissection, whole scleras were incubated for 6 hours at 37°C in Dulbecco’s modified Eagle’s medium (DMEM) containing 500 μCi/mL 35SO4. After incubation, tissue was stored at -80°C until processing. Two punches, 3 mm in diameter, were taken from the sclera near the optic nerve head (posterior sclera), and two punches 3 mm in diameter were taken near the limbus (anterior sclera). The punches were digested with proteinase K, and the GAGs precipitated with 0.5% cetylpyridinium chloride (CPC) in the presence of carrier chondroitin sulfate. The CPC technique has been shown to be a reliable and accurate technique for the measurement of GAG synthesis.59 Radiolabeled GAG precipitate was collected on filters (Whatman GF/A; Eastman Kodak, Rochester, NY) and measured by scintillation counting. The rates of GAG synthesis were determined from the average counts in the two punches sampled at each location in each eye. All data are presented as differences in counts per minute (cpm) between the corresponding samples from the treated and control eyes from each subject (to convert to femtomoles 35SO4/hr per punch, cpm was multiplied by 9.257 × 10⁻⁴). Although punch thickness was not specifically controlled for in these analyses, DNA concentrations were measured in a subset of animals with a fluorometer (Picofluor; Turner Designs, Sunnyvale, CA) using a double-stranded DNA binding reagent (Pico Green; Invitrogen, Carlsbad, CA), together with a standard curve of salmon sperm DNA (1-1000 ng/mL), according to the standard protocol (Picofluor; Turner Designs). The results indicated that the number of scleral cells did not differ between punches from treated and control eyes (see Results). Therefore, the raw counts represent the rates of GAG synthesis by an approximately equal number of cells.
RA Assay
The retina and choroid/RPE were separated and incubated at 37°C for 1.5 hours in 0.5 mL DMEM plus 15% fetal bovine serum containing 1 μCi/mL of tritiated all-trans-retinol (Dupont NEN, Boston, MA). After incubation, tissue was stored at -80°C until processing. Tissues were homogenized in 0.5 mL PBS, and 100 ng of unlabeled RA was added as a carrier. Total RA levels were determined by normal-phase HPLC. Each retinoid peak was collected manually, and the amount of radioactivity was determined by scintillation counting. For detailed methods see Mertz and Wallman.43 In that study, normal-phase and reversed-phase HPLC were used, and normal-phase was determined to be the better method for measuring RA synthesis. All data are given as counts per minute (to convert to picomoles/h per sample, cpm is multiplied by 1.23 × 10⁻³). The rate of RA synthesis was determined for all animals except monkeys L5, M5, N5, and Sb, which were excluded because the samples were lost during preparation.
Effect of RA on Sclera in Culture
To determine the effect of RA on the rate of GAG synthesis in cultured marmoset sclera, two to four punches of sclera 2-mm in diameter were obtained from near the optic nerve head from both eyes of 10 untreated animals. All punches were incubated in 0.5 mL DMEM containing 15% fetal bovine serum. Medium was refreshed every 24 hours for 72 hours. For the final 6 hours in culture, the medium was replaced by medium containing 500 μCi/mL 35SO4 and processed as described earlier. Two different experiments were performed: one to test the effect of RA on GAG synthesis rate as a function of time in culture, the other to determine the RA dose-response curve. For the effect of RA with time, two to three pairs of punches from two marmosets were examined after 24, 48, and 72 hours in culture with 5 × 10⁻⁵ MRA (with ethanol as a vehicle). Pairs of punches were taken from the same eye for processing; one punch was cultured with RA+ethanol, and the other was cultured with ethanol alone as a control. The concentration of ethanol in the medium was maintained at 1%. Pilot experiments indicated that up to a 5% ethanol concentration does not affect the rate GAG synthesis compared with synthesis rate in DMEM alone. Labeled GAGs were detected by scintillation counting and the ratio of the RA-treated to ethanol-control punch was determined. Punches from eyes of eight other marmosets were used to generate a dose-response curve using seven concentrations of RA ranging from 10-9 Mto5 ×10-4 M. As in the time course assay, the effect of RA concentration was determined as counts per minute relative to a paired control punch from the same eye incubated under identical conditions with vehicle alone.
Statistics and Data Analyses
All statistical analyses were performed on computer (Statview; SAS, Cary, NC). ANOVA and post hoc t-tests were used to examine interocular differences (treated - control) or data from the same eye measured at different times or at different locations. Unpaired t-tests were used to examine differences between data sets from different animals. All probabilities from multiple comparisons were adjusted using the Bonferroni correction. The significance of correlations was tested with the Fisher z transform. Dose-response data were fitted with a sigmoidal function by an iterative process using data analysis and graphing software (KaleidaGraph; Synergy Software, Reading, PA).
RESULTS
In an earlier study, we reported that the direction and magnitude of diffuser-induced changes in vitreous chamber depth and refractive error are variable in juvenile marmosets.54 The animals used in this study, some of which were included in the earlier study,54 also showed a range of responses to form deprivation that included increased growth rates and myopia in some eyes and reduced growth rates and hyperopia in others. The animals were divided into two groups based on the type of the growth response measured as the change relative to the control eye (treated-control; Table 1, Fig. 2). Group 1 comprised animals with eyes that when treated became relatively longer and, on average, myopic compared to the contralateral control eye. The mean (±SD) interocular differences in refractive state (-2.6 ± 2.5 D) and vitreous chamber depth (0.17 ± 0.12 mm) for group 1 were statistically significant (one-sample t-tests, P < 0.01). Group 2 comprises animals with eyes that when treated became relatively shorter and, on average, more hyperopic than the control. The mean interocular differences in refractive state (2.6 ± 3.0 D) and vitreous chamber depth (-0.16 ± 0.16 mm) for group 2 were statistically significant (one-sample t-tests, P < 0.01). The changes in refractive state and vitreous chamber depth were significantly different between the two groups (unpaired t-test, P < 0.01) and there was a significant linear correlation between the final measurement of interocular differences in refractive error and vitreous chamber depth (Fig. 2; R = 0.898, P < 0.01). Figure 3 shows the rate of change in vitreous chamber depth of the treated eyes between the penultimate and final ultrasound measures plotted with the vitreous chamber depths of untreated eyes for comparison. The treated eyes of two animals in group 2 (G6 and Sb) actually showed decreasing vitreous chamber depths, and the rest of the animals in both groups exhibited various rates of increasing vitreous chamber depths. The mean rate of change in vitreous chamber depth between the penultimate and final measures (Fig. 3, inset) was significantly different between the groups (mean ± SE millimeters per day: group 1, 0.010 ± 0.002 vs. group, 2 0.003 ± 0.002, unpaired t-test, P < 0.05).
FIGURE 2.
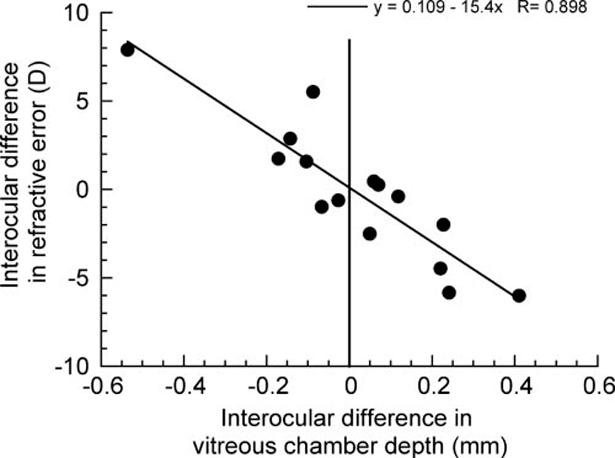
Diffuser-induced changes in refractive state and vitreous chamber depth (plotted as the interocular difference between the treated and control eye, n = 15) correlate significantly (P < 0.01). The vertical line (x = 0) separates the experimental groups. Right of line: group 1, treated eye longer and, on average, more myopic; left of line: group 2, treated eye shorter and, on average, more hyperopic.
FIGURE 3.
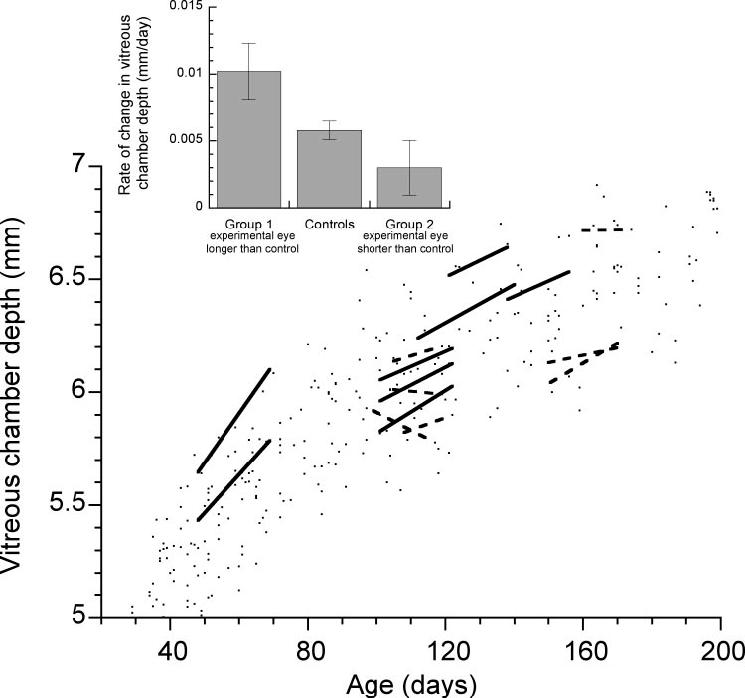
The rates of change of the vitreous chamber depth of the treated eyes are plotted as lines linking the penultimate and final measurements of individual animals in this study. Solid lines: animals from group 1, treated eyes longer than control eyes (n = 8); dashed lines: animals from group 2, treated eyes shorter than control eyes (n = 7). The range of vitreous chamber depths from the eyes of untreated and pretreated marmoset eyes (data from our database and Ref. 53) are shown as points of comparison. The mean (±SE) rate of change in the vitreous chamber depth of the treated eyes is shown (inset) for groups 1 and 2 (group means were significantly different, unpaired t-test, P < 0.05). The mean change in vitreous chamber depth for the control eyes for both groups (n = 15) is shown for comparison.
DNA Content of Scleral Punches
To determine whether scleral cell density changed in the treated eyes, because of changes in either tissue thickness or cell proliferation, the DNA concentrations in punches from the scleras of treated and control eyes were measured in seven animals (three from group 1: O6, N6, and H6; four from group 2: R6, S6, G6, and A6) representing different responses to deprivation. Table 2 gives the DNA concentration in both eyes of each animal sampled in anterior and posterior sclera. There was no statistically significant difference in DNA concentration in either anterior or posterior sclera between the treated and control eyes in either group. Correlations of the interocular difference in DNA concentration per punch with the interocular difference in vitreous chamber depth were not significant (anterior sclera, R = 0.098, P = 0.83; posterior sclera, R = -0.180, P = 0.70).
TABLE 2.
DNA Concentration in Scleral Punches
| Anterior Sclera DNA Concentration (ng/mL) |
Posterior Sclera DNA Concentration (ng/mL) |
VC Depth (mm) |
||||||
|---|---|---|---|---|---|---|---|---|
| Subject | Group | Treated | Control | Difference | Treated | Control | Difference | Difference |
| O6 | 1 | 584.8 | 601.5 | -16.6 | 679.0 | 723.6 | -44.6 | 0.41 |
| N6 | 1 | 728.5 | 521.8 | 206.7 | 740.0 | 672.8 | 67.2 | 0.22 |
| H6 | 1 | 182.4 | 193.6 | -11.2 | 187.8 | 207.1 | -19.2 | 0.05 |
| Mean ± SD | 498.6 ± 283.1 | 439.0 ± 216.2 | 59.6 ± 127.4 | 535.6 ± 302.7 | 534.5 ± 284.7 | 1.1 ± 58.6 | 0.23 ± 0.18 | |
| R6 | 2 | 848.4 | 544.7 | 303.7 | 723.6 | 1139.3 | -415.7 | -0.09 |
| S6 | 2 | 594.2 | 711.4 | -117.2 | 731.8 | 616.4 | 115.5 | -0.10 |
| G6 | 2 | 203.3 | 203.0 | 0.3 | 234.4 | 232.2 | 2.2 | -0.14 |
| A6 | 2 | 202.7 | 188.0 | 14.7 | 358.0 | 216.6 | 141.5 | -0.54 |
| Mean ± SD | 462.1 ± 316.7 | 411.8 ± 258.9 | 50.4 ± 178.9 | 512.0 ± 254.2 | 551.1 ± 433.5 | -39.1 ± 258.2 | -0.22 ± 0.21 | |
Rate of Scleral GAG Synthesis
Analysis of both eyes in all animals in both groups showed that the rate of GAG synthesis in the posterior sclera was significantly greater than in the anterior sclera (n = 30, mean ± SE cpm, posterior sclera 10,313 ± 1,551 vs. anterior sclera 4,195 ± 730, paired t-test, P < 0.01; see Fig. 4A for a breakdown by group and treated or control eye). The difference in GAG synthesis rate in the treated and control eyes (treated-control) was examined in both experimental groups at both locations in the sclera (Fig. 4B). Only the posterior scleras of the treated eyes in group 1 showed a significant difference in the rate of GAG synthesis relative to their controls (mean ± SE cpm, treated-control, group 1 posterior sclera -3,994 ± 1,068, one-sample t-test, P < 0.01; group 1 anterior sclera -1,798 ± 1,370, one-sample t-test, P = 0.230; group 2 posterior sclera 4,166 ± 2,348, one-sample t-test, P = 0.126; group2 anterior sclera, 918 ± 769, one-sample t-test, P = 0.278). The interocular difference in the rate of GAG synthesis was significantly different between the groups in the posterior sclera (group 1 vs. group 2, mean ± SE cpm, -3,994 ± 1,068 vs. 2,451 ± 1,790, unpaired t-test, P < 0.01), but not in the anterior sclera (mean ± SE cpm, -1,798 ± 1,370 vs. 918 ± 769, unpaired t-test, P = 0.12). There was no significant difference in the rate of GAG synthesis in the posterior sclera of the control eyes between the two groups (mean ± SE cpm, group 1 vs. group 2, 1.44 × 10⁴ ± 0.39 × 10⁴ vs. 0.59 × 10⁴ ± 0.16 × 10⁴, unpaired t-test, P = 0.08).
FIGURE 4.
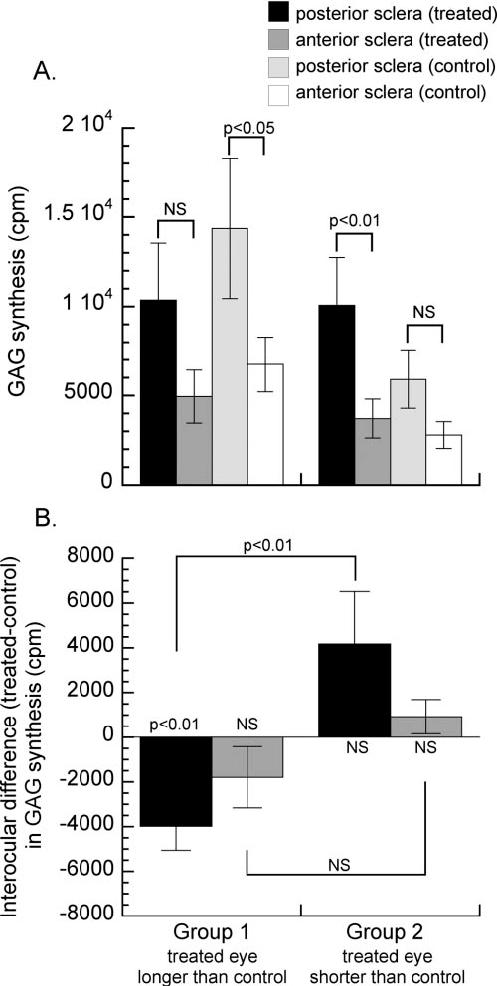
(A) Bars show the rate of GAG synthesis (mean ± SE) in treated eyes of both experimental groups (group 1, n = 8; group 2, n = 7) measured in the posterior and anterior sclera of treated eyes. Measures of posterior and anterior sclera from control eyes are shown for comparison. The probabilities are calculated from paired t-tests comparing GAG synthesis rates in different parts of the scleras of the same eyes. (B) Bars show the mean (±SE) difference in the rates of GAG synthesis in the treated eyes and control eyes (treated-control) in both experimental groups. The probabilities along the horizontal line (y = 0) indicate the results of one-sample tests. The probabilities on the brackets show the results of unpaired tests comparing experimental groups (NS, not significant).
The rate of GAG synthesis in the posterior sclera of all treated eyes correlated inversely with the rate of vitreous chamber elongation (Fig. 5, R = 0.538, P < 0.05). A similar trend for GAG synthesis rate in the anterior sclera was observed but is not statistically significant (R = 0.472, P = 0.076). Both correlations should be viewed cautiously because of the variability in the measures of GAG synthesis rate and the clustering of the data with relatively few data points at the high and low vitreous chamber elongation rates. More data are needed to confirm whether these trends are indeed significant.
FIGURE 5.

Rate of GAG synthesis in the sclera of all treated eyes in both groups 1 and 2 plotted against the rate of vitreous chamber elongation (n = 15). Linear regression equations and correlations are shown. The rate of GAG synthesis in the posterior sclera correlates weakly, but significantly, with vitreous chamber elongation (P < 0.05). The rate of GAG synthesis in the anterior sclera does not correlate significantly with the rate of vitreous chamber elongation (P = 0.076). Given the variability of the GAG data and the clustering of the data points, more data are required to verify these trends.
Rate of RA Synthesis
RA synthesis rate was altered in the more rapidly elongating treated eyes of group 1, but did not change in the more slowly elongating treated eyes of group 2 (Fig. 6). In group 1, the rate of RA synthesis in both the choroid/RPE and the retina was significantly greater in the treated eyes relative to the contralateral controls (Fig. 6; mean ± SE cpm, choroid/RPE, 695.1 ± 119.7, one-sample t-test, P < 0.01; retina, 568.0 ± 69.0, one-sample t-test, P < 0.01). However, in group 2, there was no significant difference in the rate of RA synthesis in either tissue in the treated eyes compared with the fellow control eyes (Fig. 6). Analysis of all animals in both groups showed that the percentage change in the rate of RA synthesis in the choroid/RPE and retina of the treated eyes relative to the control eyes correlated positively with the percentage change in vitreous chamber depth (Fig. 7; choroid/RPE, R = 0.835, P < 0.01; retina, R = 0.706, P < 0.01).
FIGURE 6.
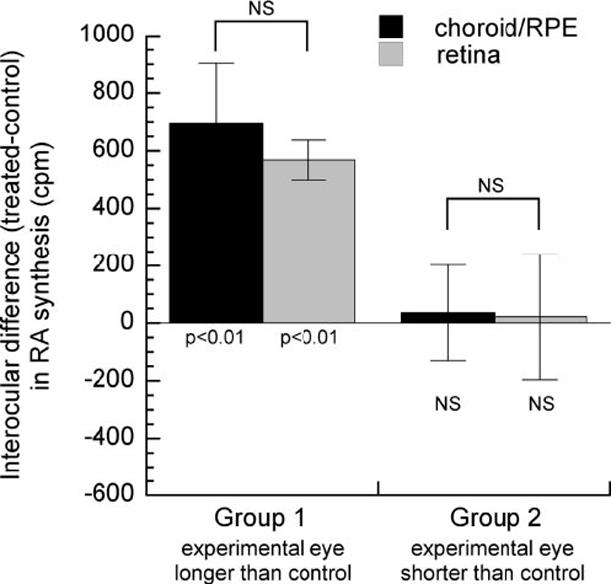
Mean (±SE) RA synthesis rates in choroid/RPE or retina from treated eyes relative to the contralateral control eyes (treated-control) for group 1 (n = 6) and group 2 (n = 5). The probabilities along the horizontal line (y = 0) indicate the results of one-sample tests of the difference between the experimental and control eyes (NS, not significant). No significant differences were observed between the interocular differences in the rates of RA synthesis in retina versus choroid/RPE in either group (brackets indicate unpaired t-tests).
FIGURE 7.
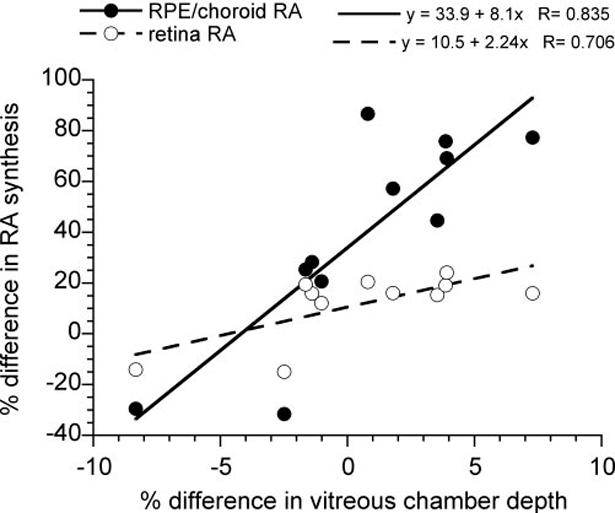
The percentage difference in the rate of RA synthesis in treated eyes (n = 11) relative to their contralateral control eyes for choroid/RPE and retina plotted against the percentage difference in the treated eye’s vitreous chamber depth relative to the control eye. Linear regression equations and correlations are shown. The differences in rate of RA synthesis in both choroid/RPE and retina correlate significantly with the differences in vitreous chamber depth (P < 0.01).
Effect of RA on the Rate of GAG Synthesis In Vitro
RA inhibited the rate of scleral GAG synthesis slowly and incompletely (Fig. 8A). RA (5 × 10⁻⁵ M) reduced the rate of scleral GAG synthesis to approximately 50% of control levels after 72 hours (lesser inhibition and slower than the approximately 98% inhibition observed for cartilaginous chick sclera at the same dose after 6 to 8 hours43). This effect was dose dependent and the EC50 was 8.5 × 10⁻⁷ M (Fig. 8C). The effect of RA on the rate of scleral GAG synthesis is shown in Figure 8 relative to the rate of GAG synthesis in paired control punches cultured with 1% ethanol (RA vehicle). Ethanol alone had no effect on the rate of GAG synthesis over 72 hours in culture (Fig. 8B).
FIGURE 8.
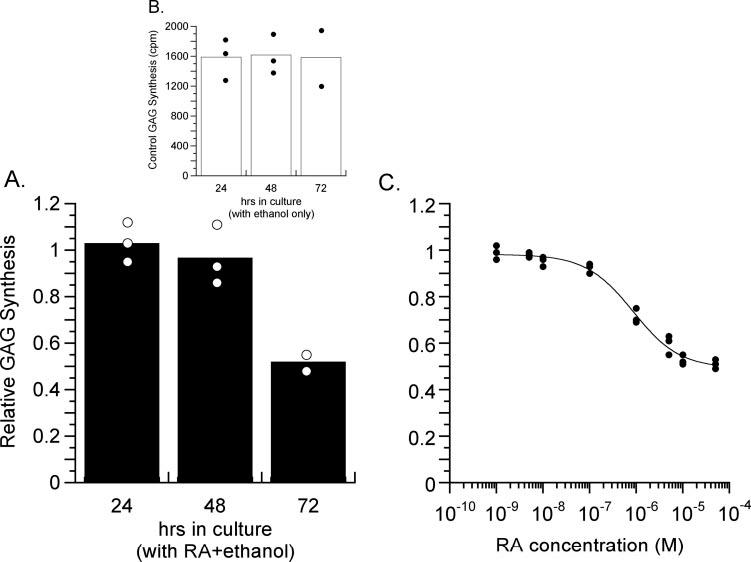
all-trans-Retinoic acid reduced the rate of scleral GAG synthesis in vitro. Data are plotted as the ratio of GAG synthesis rate in scleral punches cultured with RA in the medium to the GAG synthesis rate in control medium containing ethanol (the vehicle for RA) maintained at a 1% concentration. (A) The effect of 5 × 10⁻⁵ M RA on the rate of GAG synthesis. Means and values from each experimental/control pair of punches are shown after 24, 48, and 72 hours in culture. The rate of GAG synthesis was reduced to approximately 50% after 72 hours. (B) The GAG synthesis rate was unaffected in punches cultured with the ethanol vehicle as a control. (C) Dose-response curve for RA effects on the rate of GAG synthesis in vitro after 72 hours in culture. At the highest concentration of RA tested (5 × 10⁻⁴ M) the rate of GAG synthesis was reduced to approximately 50% of that observed in the control (ethanol) punches. The EC50 for this function is approximately 8.5 × 10⁻⁷ M.
Relationship of RA and GAG Changes In Vivo
RA synthesis rates in either retina or choroid/RPE did not correlate significantly with the rate of GAG synthesis in either anterior or posterior sclera in vivo. This was the case whether examined as absolute measures of synthesis rate in the treated eyes or as the interocular difference in the rate of synthesis relative to the control eyes (Fig. 9).
FIGURE 9.
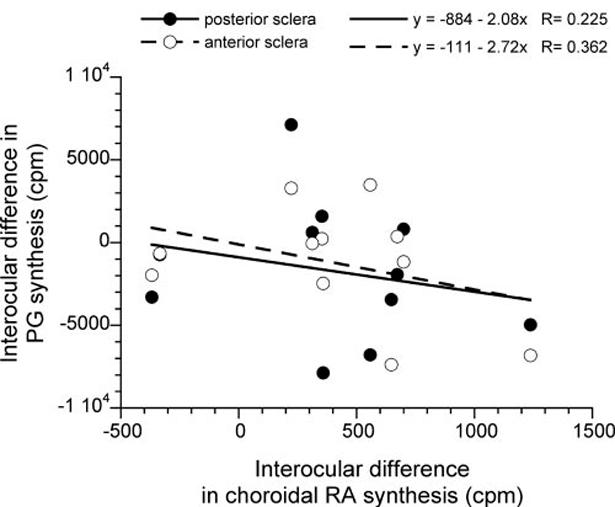
Experimentally induced change in the rate of RA synthesis in choroid/RPE (x-axis, plotted as interocular difference; treated - control eyes) does not correlate significantly with the interocular difference in the rate of scleral GAG synthesis (y-axis) for either posterior or anterior sclera. Linear regression equations and correlations are shown.
DISCUSSION
Current understanding of the visual control of eye growth suggests that retinal processing of visual stimuli related to image defocus results in a signal cascade from retina to sclera that involves the RPE and choroid and ultimately effects changes in eye length by altering scleral extracellular matrix (for recent reviews, see Refs. 7,11). In support of this hypothesis, changes in the rate of scleral GAG synthesis13,14,32-34 and an increase in MMP activity,17,60-62 which degrades a variety of extracellular matrix components including GAGs and denatured collagen, have been observed with form-deprivation myopia. The reorganization of scleral extracellular matrix is associated with changes in the mechanical properties of the sclera12,18 that, in turn, could alter the way the sclera responds to yet other forces, such as IOP, to alter axial length and refractive state.
The overall growth of the eye may involve a different mechanism than that for the visual regulation of axial eye length for emmetropization.20 We speculate that anabolic processes control a baseline ocular growth rate that results in ocular enlargement that is proportional in all dimensions. Superimposed on this rate are mechanisms that modulate the depth of the vitreous chamber and consequently the eye’s refractive state, in response to visual signals. We further speculate that different mechanisms may be responsible for increasing or decreasing vitreous chamber depth. In support of this, we reported in an earlier study13 that scleral changes in marmosets with persistent form-deprivation myopia were observed long after the end of the deprivation, even after the ocular growth rate had returned to normal. In the present study we looked at scleral changes in marmosets in which the eye size was actively increasing or decreasing relative to control eyes. We found that the rate of GAG synthesis in the posterior sclera is significantly decreased in eyes becoming longer than normal and may be inversely proportional to the degree of ocular elongation. In contrast, in eyes that were shorter than normal, the rate of GAG synthesis was not, on average, significantly increased. These results are consistent with the hypothesis that the biochemical basis of increasing eye size in primates involves remodeling of the sclera, which is achieved, at least in part, through a decrease in synthesis of sclera extracellular matrix components. Because the rate of scleral GAG synthesis was not significantly changed in the eyes growing slower than the control, it appears that slowing the rate of elongation may involve a different mechanism. However, at present we cannot say this with any certainty. A trend toward an increased rate of GAG synthesis was observed in the posterior sclera of eyes that were growing slower than controls, which may be statistically significant with a greater sample size. Moreover, in our data set there were only two animals in group 2 whose treated eyes were actually decreasing in absolute size; the others were growing to varying degrees (see Fig. 3). The effects on the rate of scleral GAG synthesis in these two animals were contradictory; in one animal, scleral GAG synthesis rate in the treated eye was lower than in the control eye, but in the other, the opposite was true. Additional data are needed to resolve this issue.
Recent studies in animal models of myopia suggest that RA may be an important molecular signal in the control of eye size38,40,43,45,49,63 and acts on scleral extracellular matrix.43,49 RA is known to affect extracellular matrix metabolism in many other systems and has been shown to be involved in the expression of hundreds of genes and transcription factors (for reviews, see Refs. 64-66). RA has been shown to inhibit proteoglycan/GAG synthesis in chick sclera43 in vitro, and in this study we have confirmed it in primates. Application of RA to cultured marmoset sclera at physiological concentrations produced an inhibition of GAG synthesis with an EC50 of approximately 8.5 × 10⁻⁷ M. This concentration is similar to that reported for RA inhibition of GAG synthesis in chick sclera (10-7 M)43 as well as to the effect of RA on growth inhibition in transformed and untransformed mouse embryonic fibroblasts (10-6 M)67 and on RA induction of apoptosis in a carcinoma cell line (10-7 M).68 In the present study, we found that the in vivo rate of RA synthesis in both retina and choroid/RPE is proportional to induced increases in vitreous chamber depth relative to the control. In eyes in which the vitreous chamber depths were decreasing relative to the control, however, the rate of RA synthesis did not differ from that in control eyes.
Despite the lack of statistically significant changes in the rate of either RA or GAG synthesis in marmoset eyes with decreased rates of vitreous chamber elongation, the rate of RA synthesis, and possibly the rate of GAG synthesis as well, correlated with increasing rates. More data are needed to verify this trend, but such a trend would be expected if RA and GAG synthesis rates were part of a mechanism that increased vitreous chamber depth and were at, or near, baseline levels in eyes with stable or decreasing vitreous chamber depths. The lack of a statistically significant reduction in the rate of RA synthesis in eyes with reduced rates of elongation and the fact that experimentally induced changes in both GAG and RA synthesis rates persist in older marmosets in which growth rate has stabilized after the end of form deprivation,13,57 further suggests that different mechanisms mediate increasing and decreasing vitreous chamber depth in primates. It may be that these hypothetical mechanisms involve completely different pathways, or perhaps the RA effects themselves are further modulated in the sclera. For example, regulating the rate of RA metabolism modulates its effects on cellular differentiation and growth.69 Similarly, controlling the rate of RA degradation may be important for modulating its effects on the sclera and may play a role in reducing the rate of ocular elongation. Increasing the rate of RA degradation could also explain the reduction in RA concentration in guinea pigs eyes raised with positive lenses, causing a decrease in eye length relative to control eyes,49 although we did not see a reduction in the rate of RA synthesis in similarly changing marmoset eyes in this study. It is also possible that modulation of the RA receptors in sclera is involved. Retinoid receptor activation is complex and is known to involve many coregulators (for reviews, see Refs 66,70-72). Although the number of possible RA coregulators is enormous, TGF-β is a particularly interesting candidate, as it is a known RA coregulator and has been shown to change in relationship to the progression of experimentally induced myopia.63,73,74
Although we found a dose-dependent effect of RA on GAG synthesis in vitro, the effects were relatively slow and incomplete. This result is consistent with earlier reports indicating that the effects of RA on cartilage differentiation in chondrocyte cultures require 2 to 5 days for a significant reduction in the rate of GAG synthesis,75-77 an increased rate of degradation of cartilage proteoglycans,78 and an irreversible depletion of proteoglycans from the cartilage matrix.79 Furthermore, the induced change in the rate of RA synthesis was not correlated with the change in the rate of GAG synthesis observed in vivo. This may also be because of the involvement of intervening steps in the effects of RA on sclera and is consistent with the view that coregulators modulate the efficacy of RA. It has been proposed, for example, that RA modulates extracellular matrix homeostasis through alterations in the expression of TIMP,80 MMPs,81 hyaluronic acid, TGF-β,82 and IGF-1,83 and their subsequent effects on proteoglycan core protein transcription,84 synthesis, and turnover in the extracellular matrix. Based on these studies, we speculate that choroidal and/or retinal RA modulates GAG synthesis and turnover through a complex series of interactions with endogenous growth factors, transcription factors, and other matrix components within the scleral stroma. Finally, we cannot rule out with certainty the possibility that the changes in RA and GAG synthesis rates are not causally related to the changes in eye size at all, but rather are secondary to them13 and involve a common regulatory mechanism.
The nature of the relationship between RA synthesis in the retina and the choroid/RPE is unknown in both primates and chicks. We found that the rate of RA synthesis in the retina as well as in the choroid/RPE was increased in eyes with increased rates of vitreous chamber elongation. However, in chicks under the same conditions, the rate of RA synthesis is increased in the retina but decreased in the choroid/RPE. This species difference presumably is related to the opposite effects of induced axial elongation on GAG synthesis seen in the cartilaginous sclera of chicks32-34 compared with the fibrous sclera of mammals13-16 and requires further investigation.
In conclusion, the results of this and our other report on marmosets13 suggest that changes in the rate of scleral GAG synthesis are related to changes in eye elongation and refractive state in primate eyes, but we cannot say whether they are a cause of the growth change or an effect. We speculate that changes in the rate of RA synthesis in the retina and the choroid/RPE may mediate the decrease in scleral GAG synthesis rate that is associated with increasing the rate of ocular elongation. The mechanism that reduces the rate of ocular elongation appears to involve other, as yet undetermined, factors.
Acknowledgments
The authors thank Heidi Denman and Kristen Totonelly for assistance with marmoset care and Lisa Palmer for technical assistance with biochemical analyses of the scleras.
Footnotes
Supported by National Eye Institute Grants EY011228 (DT) and EY09391 (JSR).
Disclosure: D. Troilo, None; D.L. Nickla, None; J.R. Mertz, None; J.A. Summers Rada, None
The publication costs of this article were defrayed in part by page charge payment. This article must therefore be marked “advertisement” in accordance with 18 U.S.C. §1734 solely to indicate this fact.
References
- 1.Wallman J, Adams JI. Developmental aspects of experimental myopia in chicks: susceptibility, recovery and relation to emmetropization. Vision Res. 1987;27:1139–1163. doi: 10.1016/0042-6989(87)90027-7. [DOI] [PubMed] [Google Scholar]
- 2.Schaeffel F, Howland HC. Visual optics in normal and ametropic chickens. Clin Vision Sci. 1988;3:83–98. [Google Scholar]
- 3.Troilo D, Wallman J. The regulation of eye growth and refractive state: an experimental study of emmetropization. Vision Res. 1991;31:1237–1250. doi: 10.1016/0042-6989(91)90048-a. [DOI] [PubMed] [Google Scholar]
- 4.McBrien NA, Norton TT. The development of experimental myopia and ocular component dimensions in monocularly lid-sutured tree shrews (Tupaia belangeri) Vision Res. 1992;32:843–852. doi: 10.1016/0042-6989(92)90027-g. [DOI] [PubMed] [Google Scholar]
- 5.Hung L-F, Crawford MLJ, Smith EL. Spectacle lenses alter eye growth and the refractive status of young monkeys. Nat Med. 1995;1:761–765. doi: 10.1038/nm0895-761. [DOI] [PubMed] [Google Scholar]
- 6.Whatham AR, Judge SJ. Compensatory changes in eye growth and refraction induced by daily wear of soft contact lenses in young marmosets. Vision Res. 2001;41:267–273. doi: 10.1016/s0042-6989(00)00250-9. [DOI] [PubMed] [Google Scholar]
- 7.Wallman J, Winawer J. Homeostasis of eye growth and the question of myopia. Neuron. 2004;43:447–468. doi: 10.1016/j.neuron.2004.08.008. [DOI] [PubMed] [Google Scholar]
- 8.Troilo D, Gottlieb MD, Wallman J. Visual deprivation causes myopia in chicks with optic nerve section. Curr Eye Res. 1987;6:993–999. doi: 10.3109/02713688709034870. [DOI] [PubMed] [Google Scholar]
- 9.Wildsoet CF, Pettigrew JD. Experimental myopia and anomalous eye growth patterns unaffected by optic nerve section in chickens: evidence for local control of eye growth. Clin Vision Sci. 1988;3:99–107. [Google Scholar]
- 10.Norton TT, Essinger JA, McBrien NA. Lid-suture myopia in tree shrews with retinal ganglion cell blockade. Vis Neurosci. 1994;11:143–153. doi: 10.1017/s0952523800011184. [DOI] [PubMed] [Google Scholar]
- 11.McBrien NA, Gentle A. Role of the sclera in the development and pathological complications of myopia. Prog Retin Eye Res. 2003;22:307–338. doi: 10.1016/s1350-9462(02)00063-0. [DOI] [PubMed] [Google Scholar]
- 12.Phillips JR, Khalaj M, McBrien NA. Induced myopia associated with increased scleral creep in chick and tree shrew eyes. Invest Ophthalmol Vis Sci. 2000;41:2028–2034. [PubMed] [Google Scholar]
- 13.Rada JA, Nickla DL, Troilo D. Decreased proteoglycan synthesis associated with form deprivation myopia in mature primate eyes. Invest Ophthalmol Vis Sci. 2000;41:2050–2058. [PubMed] [Google Scholar]
- 14.Norton TT, Rada JA. Reduced extracellular matrix in mammalian sclera with induced myopia. Vision Res. 1995;35:1271–1282. doi: 10.1016/0042-6989(94)00243-f. [DOI] [PubMed] [Google Scholar]
- 15.McBrien NA, Lawlor P, Gentle A. Scleral remodeling during the development of and recovery from axial myopia in the tree shrew. Invest Ophthalmol Vis Sci. 2000;41:3713–3719. [PubMed] [Google Scholar]
- 16.Gentle A, Liu YY, Martin JE, Conti GL, McBrien NA. Collagen gene expression and the altered accumulation of scleral collagen during the development of high myopia. J Biol Chem. 2003;278:16587–16594. doi: 10.1074/jbc.M300970200. [DOI] [PubMed] [Google Scholar]
- 17.Guggenheim JA, McBrien NA. Form-deprivation myopia induces activation of scleral matrix metalloproteinase-2 in tree shrew. Invest Ophthalmol Vis Sci. 1996;37:1380–1395. [PubMed] [Google Scholar]
- 18.Siegwart JT, Norton TT. Regulation of the mechanical properties of tree shrew sclera by the visual environment. Vision Res. 1999;39:387–407. doi: 10.1016/s0042-6989(98)00150-3. [DOI] [PubMed] [Google Scholar]
- 19.Coulombre A. The role of intraocular pressure in the development of the chick eye. I. Control of eye size. J Exp Zool. 1956;133:211–225. [Google Scholar]
- 20.van Alphen GWHM. On emmetropia and ametropia. Ophthalmologica. 1961;142(Suppl):1–92. [PubMed] [Google Scholar]
- 21.Greene PR. Mechanical considerations in myopia: Relative effects of accommodation, convergence, intraocular pressure, and the extraocular muscles. Am J Optom Physiol Opt. 1980;57:902–914. [PubMed] [Google Scholar]
- 22.Pruett RC. Progressive myopia and intraocular pressure: what is the linkage?—a literature review. Acta Ophthalmol. 1988;66(Suppl 185):117–127. doi: 10.1111/j.1755-3768.1988.tb02685.x. [DOI] [PubMed] [Google Scholar]
- 23.Quinn GE, Berlin JA, Young TL, Ziylan S, Stone RA. Association of intraocular pressure and myopia in children. Ophthalmology. 1995;102:180–185. doi: 10.1016/s0161-6420(95)31038-x. [DOI] [PubMed] [Google Scholar]
- 24.Edwards MH, Brown B. IOP in myopic children: the relationship between increases in IOP and the development of myopia. Ophthalmic Physiol Opt. 1996;16:243–246. [PubMed] [Google Scholar]
- 25.Nickla DL, Wildsoet C, Wallman J. The circadian rhythm in intraocular pressure and its relation to diurnal ocular growth changes in chicks. Exp Eye Res. 1998;66:183–193. doi: 10.1006/exer.1997.0425. [DOI] [PubMed] [Google Scholar]
- 26.Schmid KL, Hills T, Abbott M, Humphries M, Pyne K, Wildsoet CF. Relationship between intraocular pressure and eye growth in chick. Ophthalmic Physiol Opt. 2003;23:25–33. doi: 10.1046/j.1475-1313.2003.00085.x. [DOI] [PubMed] [Google Scholar]
- 27.Bell GR. The Coleman theory of accommodation and its relevance to myopia. J Am Optom Assoc. 1980;51:582–588. [PubMed] [Google Scholar]
- 28.Wyatt HJ. Some aspects of the mechanics of accommodation. Vision Res. 1988;28:75–86. [PubMed] [Google Scholar]
- 29.Goss DA, Rosenfield M. Vergence and myopia. In: Rosenfield M, GIlmartin B, editors. Myopia and Nearwork. Butterworth Heinemann; Oxford, UK: 1998. pp. 147–161. [Google Scholar]
- 30.Flitcroft DI. A model of the contribution of oculomotor and optical factors to emmetropization and myopia. Vision Res. 1998;38:2869–2879. doi: 10.1016/s0042-6989(98)00087-x. [DOI] [PubMed] [Google Scholar]
- 31.Gottlieb MD, Joshi HB, Nickla DL. Scleral changes in chicks with form-deprivation myopia. Curr Eye Res. 1990;9:1157–1165. doi: 10.3109/02713689009003472. [DOI] [PubMed] [Google Scholar]
- 32.Christensen AM, Wallman J. Evidence that scleral growth underlies visual deprivation myopia in chicks. Invest Ophthalmol Vis Sci. 1991;32:2143–2150. [PubMed] [Google Scholar]
- 33.Rada JA, Mcfarland AL, Cornuet PK, Hassell JR. Proteoglycan synthesis by scleral chondrocytes is modulated by a vision dependent mechanism. Curr Eye Res. 1992;11:767–782. doi: 10.3109/02713689209000750. [DOI] [PubMed] [Google Scholar]
- 34.Rada JA, Matthews AL. Visual deprivation upregulates extracellular matrix synthesis by chick scleral chondrocytes. Invest Ophthalmol Vis Sci. 1994;35:2436–2447. [PubMed] [Google Scholar]
- 35.Marzani D, Wallman J. Growth of the two layers of the chick sclera is modulated reciprocally by visual conditions. Invest Ophthalmol Vis Sci. 1997;38:1726–1739. [PubMed] [Google Scholar]
- 36.Stone RA, Laties AM, Raviola E, Wiesel TN. Increase in retinal vasoactive intestinal polypeptide after eyelid fusion in primates. Proc Natl Acad Sci USA. 1988;85:257–260. doi: 10.1073/pnas.85.1.257. [DOI] [PMC free article] [PubMed] [Google Scholar]
- 37.Iuvone PM, Tigges M, Fernandes A, Tigges J. Dopamine synthesis and metabolism in rhesus monkey retina: development, aging, and the effects of monocular visual deprivation. Vis Neurosci. 1989;2:465–471. doi: 10.1017/s0952523800012360. [DOI] [PubMed] [Google Scholar]
- 38.Seko Y, Shimizu M, Tokoro T. Retinoic acid increases in the retina of the chick with form deprivation myopia. Ophthalmic Res. 1998;30:361–367. doi: 10.1159/000055496. [DOI] [PubMed] [Google Scholar]
- 39.Fischer AJ, McGuire JJ, Schaeffel F, Stell WK. Light- and focusdependent expression of the transcription factor ZENK in the chick retina. Nat Neurosci. 1999;2:706–712. doi: 10.1038/11167. [DOI] [PubMed] [Google Scholar]
- 40.Bitzer M, Feldkaemper M, Schaeffel F. Visually induced changes in components of the retinoic acid system in fundal layers of the chick. Exp Eye Res. 2000;70:97–106. doi: 10.1006/exer.1999.0762. [DOI] [PubMed] [Google Scholar]
- 41.Stone RA, Liu J, Sugimoto R, Capehart C, Zhu XS, Pendrak K. GABA, experimental myopia, and ocular growth in chick. Invest Ophthalmol Vis Sci. 2003;44:3933–3946. doi: 10.1167/iovs.02-0774. [DOI] [PubMed] [Google Scholar]
- 42.George A, Schmid KL, Pow DV. Retinal serotonin, eye growth and myopia development in chick. Exp Eye Res. 2005;81:616–625. doi: 10.1016/j.exer.2005.03.021. [DOI] [PubMed] [Google Scholar]
- 43.Mertz JR, Wallman J. Choroidal retinoic acid synthesis: a possible mediator between refractive error and compensatory eye growth. Exp Eye Res. 2000;70:519–527. doi: 10.1006/exer.1999.0813. [DOI] [PubMed] [Google Scholar]
- 44.Feldkaemper MP, Wang HY, Schaeffel F. Changes in retinal and choroidal gene expression during development of refractive errors in chicks. Invest Ophthalmol Vis Sci. 2000;41:1623–1628. [PubMed] [Google Scholar]
- 45.Simon P, Feldkaemper M, Bitzer M, Ohngemach S, Schaeffel F. Early transcriptional changes of retinal and choroidal TGFbeta-2, RALDH-2, and ZENK following imposed positive and negative defocus in chickens. Mol Vis. 2004;10:588–597. [PubMed] [Google Scholar]
- 46.Rada JA, Thoft RA, Hassell JR. Increased aggrecan (cartilage proteoglycan) production in the sclera of myopic chicks. Dev Biol. 1991;147:303–312. doi: 10.1016/0012-1606(91)90288-e. [DOI] [PubMed] [Google Scholar]
- 47.Nickla DL, Wildsoet C, Wallman J. Compensation for spectacle lenses involves changes in proteoglycan synthesis in both the sclera and choroid. Curr Eye Res. 1997;16:320–326. doi: 10.1076/ceyr.16.4.320.10697. [DOI] [PubMed] [Google Scholar]
- 48.Gentle A, Truong HT, McBrien NA. Glycosaminoglycan synthesis in the separate layers of the chick sclera during myopic eye growth: comparison with mammals. Curr Eye Res. 2001;23:179–184. doi: 10.1076/ceyr.23.3.179.5466. [DOI] [PubMed] [Google Scholar]
- 49.McFadden SA, Howlett MHC, Mertz JR. Retinoic acid signals the direction of ocular elongation in the guinea pig eye. Vision Res. 2004;44:643–653. doi: 10.1016/j.visres.2003.11.002. [DOI] [PubMed] [Google Scholar]
- 50.Troilo D, Howland HC, Judge SJ. Visual optics and retinal cone topography in the common marmoset (Callithrix jacchus) Vision Res. 1993;33:1301–1310. doi: 10.1016/0042-6989(93)90038-x. [DOI] [PubMed] [Google Scholar]
- 51.Troilo D, Judge SJ. Ocular development and visual deprivation myopia in the common marmoset (Callithrix jacchus) Vision Res. 1993;33:1311–1324. doi: 10.1016/0042-6989(93)90039-y. [DOI] [PubMed] [Google Scholar]
- 52.Troilo D, Nickla DL, Wildsoet CW. Choroidal thickness changes during altered eye growth and refractive state in a primate. Invest Ophthalmol Vis Sci. 2000;41:1249–1258. [PubMed] [Google Scholar]
- 53.Troilo D, Nickla DL, Wildsoet CF. Form deprivation myopia in mature common marmosets (Callithrix jacchus) Invest Ophthalmol Vis Sci. 2000;41:2043–2049. [PubMed] [Google Scholar]
- 54.Troilo D, Nickla DL. The response to visual form deprivation differs with age in marmosets. Invest Ophthalmol Vis Sci. 2005;46:1873–1881. doi: 10.1167/iovs.04-1422. [DOI] [PMC free article] [PubMed] [Google Scholar]
- 55.Graham B, Judge SJ. Normal development of refractive state and ocular component dimensions in the marmoset (Callithrix jacchus) Vision Res. 1999;39:177–187. doi: 10.1016/s0042-6989(98)00188-6. [DOI] [PubMed] [Google Scholar]
- 56.Graham B, Judge SJ. The effects of spectacle wear in infancy on eye growth and refractive error in the marmoset (Callithrix jacchus) Vision Res. 1999;39:189–206. doi: 10.1016/s0042-6989(98)00189-8. [DOI] [PubMed] [Google Scholar]
- 57.Mertz JR, Nickla DL, Troilo D. Choroidal retinoic acid in a primate model of eye growth: the common marmoset. In: Thorn F, Troilo D, Gwiazda J, editors. Myopia 2000: Proceedings of the VIII International Conference on Myopia. Myopia 2000, Inc.; Boston: 2000. pp. 200–204. [Google Scholar]
- 58.Troilo D, Nickla DL, Mertz JR, Summers Rada JA. A primate model for studying the biochemical mechanisms of emmetropization and the development of myopia (Abstract) Exp Eye Res. 2004;79(Suppl):123. [Google Scholar]
- 59.Wasteson J, Uthne K, Westermark B. A novel assay for the biosynthesis of sulphated polysaccharide and its application to studies on the effects of somatomedin on cultured cells. Biochem J. 1973;136:1069–1074. doi: 10.1042/bj1361069. [DOI] [PMC free article] [PubMed] [Google Scholar]
- 60.Jones BE, Thompson EW, Hodos W, Waldbillig RJ, Chader GJ. Scleral matrix metalloproteinases, serine proteinase activity and hydrational capacity are increased in myopia induced by retinal image degradation. Exp Eye Res. 1996;63:369–381. doi: 10.1006/exer.1996.0127. [DOI] [PubMed] [Google Scholar]
- 61.Rada JA, Brenza HL. Increased latent gelatinase activity in the sclera of visually deprived chicks. Invest Ophthalmol Vis Sci. 1995;36:1555–1565. [PubMed] [Google Scholar]
- 62.Rada JA, Perry CA, Slover ML, Achen VR. Gelatinase A and TIMP-2 expression in the fibrous sclera of myopic and recovering chick eyes. Invest Ophthalmol Vis Sci. 1999;40:3091–3099. [PubMed] [Google Scholar]
- 63.Seko Y, Shimokawa H, Tokoro T. In vivo and in vitro association of retinoic acid with form-deprivation myopia in the chick. Exp Eye Res. 1996;63:443–452. doi: 10.1006/exer.1996.0134. [DOI] [PubMed] [Google Scholar]
- 64.Gudas LJ. Retinoids and vertebrate development. J Biol Chem. 1994;269:15399–15402. [PubMed] [Google Scholar]
- 65.Means AL, Gudas LJ. The roles of retinoids in vertebrate development. Annu Rev Biochem. 1995;64:201–233. doi: 10.1146/annurev.bi.64.070195.001221. [DOI] [PubMed] [Google Scholar]
- 66.Balmer JE, Blomhoff R. Gene expression regulation by retinoic acid. J Lipid Res. 2002;43:1773–1808. doi: 10.1194/jlr.r100015-jlr200. [DOI] [PubMed] [Google Scholar]
- 67.Herget T, Specht H, Esdar C, Oehrlein SA, Maelicke A. Retinoic acid induces apoptosis-associated neural differentiation of a murine teratocarcinoma cell line. J Neurochem. 1998;70:47–58. doi: 10.1046/j.1471-4159.1998.70010047.x. [DOI] [PubMed] [Google Scholar]
- 68.Hoosein NM, Brattain DE, McKnight MK, Childress KE, Chakrabarty S, Brattain MG. Comparison of the effects of transforming growth factor beta, N,N-dimethylformamide and retinoic acid on a human colon carcinoma cell line. Cancer Let. 1988;40:219–232. doi: 10.1016/0304-3835(88)90014-6. [DOI] [PubMed] [Google Scholar]
- 69.Sonneveld E, van der Saag PT. Metabolism of retinoic acid: implications for development and cancer. Int J Vitam Nutr Res. 1998;68:404–410. [PubMed] [Google Scholar]
- 70.Wei LN. Retinoid receptors and their coregulators. Annu Rev Pharmacol Toxicol. 2002;43:47–72. doi: 10.1146/annurev.pharmtox.43.100901.140301. [DOI] [PubMed] [Google Scholar]
- 71.Mehta K. Retinoids as regulators of gene expression. J Biol Regul Homeost Agents. 2003;17:1–12. [PubMed] [Google Scholar]
- 72.Bastien J, Rochette-Egly C. Nuclear retinoid receptors and the transcription of retinoid-target genes. Gene. 2004;328:1–16. doi: 10.1016/j.gene.2003.12.005. [DOI] [PubMed] [Google Scholar]
- 73.Kusakari T, Sato T, Tokoro T. Visual deprivation stimulates the exchange of the fibrous sclera into the cartilaginous sclera in chicks. Exp Eye Res. 2001;73:533–546. doi: 10.1006/exer.2001.1064. [DOI] [PubMed] [Google Scholar]
- 74.Jobling AI, Nguyen M, Gentle A, McBrien NA. Isoform-specific changes in scleral transforming growth factor-beta expression and the regulation of collagen synthesis during myopia progression. J Biol Chem. 2004;279:18121–18126. doi: 10.1074/jbc.M400381200. [DOI] [PubMed] [Google Scholar]
- 75.Iwamoto M, Golden EB, Adams SL, Noji S, Pacifici M. Responsiveness to retinoic acid changes during chondrocyte maturation. Exp Cell Res. 1993;205:213–224. doi: 10.1006/excr.1993.1079. [DOI] [PubMed] [Google Scholar]
- 76.Lau WF, Tertinegg I, Heersche JN. Effects of retinoic acid on cartilage differentiation in a chondrogenic cell line. Teratology. 1993;47:555–563. doi: 10.1002/tera.1420470607. [DOI] [PubMed] [Google Scholar]
- 77.Freyria A-M, Ronziere M-C, Boutillon M-M, Herbage D. Effect of retinoic acid on protein synthesis by foetal bovine chondrocytes in high-density culture: down-regulation of the glucose-regulated protein, GRP-78, and type II collagen. Biochem J. 1995;305:391–396. doi: 10.1042/bj3050391. [DOI] [PMC free article] [PubMed] [Google Scholar]
- 78.Lark MW, Gordy JT, Weidner JR, et al. Cell-mediated catabolism of aggrecan. Evidence that cleavage at the “aggrecansase” site (Glu373-Ala374) is a primary event in proteolysis of the interglobular domain. J Biol Chem. 1995;270:2550–2556. doi: 10.1074/jbc.270.6.2550. [DOI] [PubMed] [Google Scholar]
- 79.Von den Hoff HW, van Kampen GP, van der Korst JK. Proteoglycan depletion of intact articular cartilage by retinoic acid is irreversible and involves loss of hyaluronate. Osteoarth Cart/OARS, Osteoarthritis Research Society. 1993;1:157–166. doi: 10.1016/s1063-4584(05)80086-x. [DOI] [PubMed] [Google Scholar]
- 80.Overall CM. Repression of tissue inhibitor of matrix metalloproteinase expression by all-trans-retinoic acid in rat bone cell populations: comparison with transforming growth factor-beta 1. J Cell Physiol. 1995;164:17–25. doi: 10.1002/jcp.1041640104. [DOI] [PubMed] [Google Scholar]
- 81.Fosang AJ, Last K, Knauper V, Murphy G, Neame PJ. Degradation of cartilage aggrecan by collagenase-3 (MMP-13) FEBS Lett. 1996;380:17–20. doi: 10.1016/0014-5793(95)01539-6. [DOI] [PubMed] [Google Scholar]
- 82.Morales TI, Roberts AB. The interaction between retinoic acid and the transforming growth factors-beta in calf articular cartilage organ cultures. Arch Biochem Biophys. 1992;293:79–84. doi: 10.1016/0003-9861(92)90368-7. [DOI] [PubMed] [Google Scholar]
- 83.Morales TI. Transforming growth factor-beta and insulin-like growth factor-1 restore proteoglycan metabolism of bovine articular cartilage after depletion by retinoic acid. Arch Biochem Biophys. 1994;286:99–106. doi: 10.1006/abbi.1994.1489. [DOI] [PubMed] [Google Scholar]
- 84.Kahari VM, Hakkinen L, Westermark J, Larjava H. Differential regulation of decorin and biglycan gene expression by dexamethasone and retinoic acid in cultured human skin fibroblasts. J Invest Derm. 1995;104:503–508. doi: 10.1111/1523-1747.ep12605969. [DOI] [PubMed] [Google Scholar]