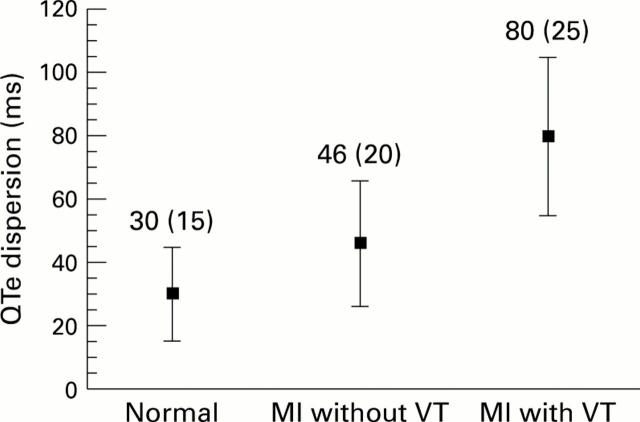
Figure 3 .
Comparison of QTe dispersion index values (means; bars = 1 SD) highlighting the differences and the overlap between the three clinical groups: normal subjects, patients with myocardial infarction (MI) without ventricular tachyarrhythmia (VT), and patients with myocardial infarction complicated by arrhythmias.

